| Param | Original file | Final file |
|---|---|---|
| Filename | modeM0/AS1A11_047T09_9000005362_38062cztM0_level2.fits | modeM0/AS1A11_047T09_9000005362_38062cztM0_level2_quad_clean.evt |
| Size (bytes) | 222,180,480 | 40,199,040 |
| Size | 211.9 MB | 38.3 MB |
| Events in quadrant A | 1,379,236 | 286,928 |
| Events in quadrant B | 1,219,434 | 289,444 |
| Events in quadrant C | 1,722,167 | 272,651 |
| Events in quadrant D | 3,710,464 | 191,286 |
| Mode M0 | |||
|---|---|---|---|
| Quadrant | BADHDUFLAG | Total packets | Discarded packets |
| A | 0 | 5492 | 2 |
| B | 0 | 5142 | 1 |
| C | 0 | 6858 | 1 |
| D | 0 | 12726 | 1 |
| Mode SS | |||
|---|---|---|---|
| Quadrant | BADHDUFLAG | Total packets | Discarded packets |
| A | 0 | 52 | 0 |
| B | 0 | 52 | 0 |
| C | 0 | 52 | 0 |
| D | 0 | 52 | 0 |
| Mode M9 | |||
|---|---|---|---|
| Quadrant | BADHDUFLAG | Total packets | Discarded packets |
| A | 0 | 13 | 0 |
| B | 0 | 13 | 0 |
| C | 0 | 13 | 0 |
| D | 0 | 13 | 0 |
| Quadrant | Total seconds | Saturated seconds | Saturation percentage |
|---|---|---|---|
| A | 2459 | 8 | 0.325336% |
| B | 2459 | 16 | 0.650671% |
| C | 2459 | 37 | 1.504677% |
| D | 2459 | 758 | 30.825539% |
Noise dominated data is calculated using 1-second bins in cleaned event files. If a bin has >2000 counts, and if more than 50% of those come from <1% of pixels, then it is considered to be noise-dominated and hence unusable.
| Quadrant | # 1 sec bins | Bins with >0 counts | Bins with >2000 counts | High rate bins dominated by noise | Noise dominated (total time) | Noise dominated (detector-on time) | Marked lightcurve |
|---|---|---|---|---|---|---|---|
| A | 3772 | 2460 | 4 | 4 | 0.11% | 0.16% | 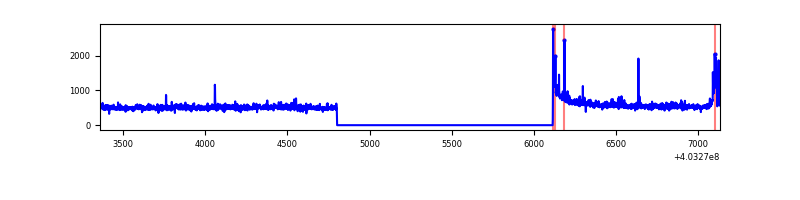 |
| B | 3772 | 2460 | 12 | 12 | 0.32% | 0.49% | 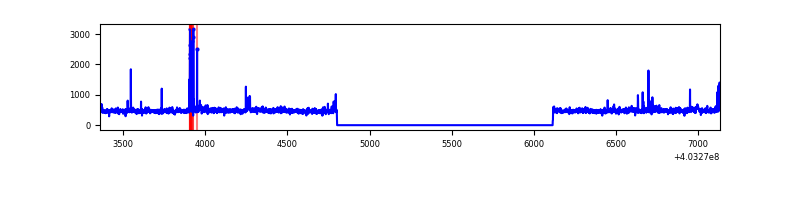 |
| C | 3772 | 2460 | 29 | 29 | 0.77% | 1.18% | 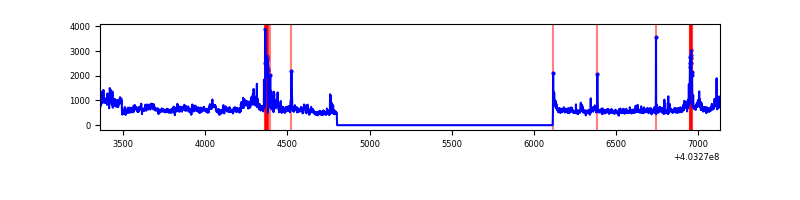 |
| D | 3772 | 2460 | 726 | 726 | 19.25% | 29.51% | 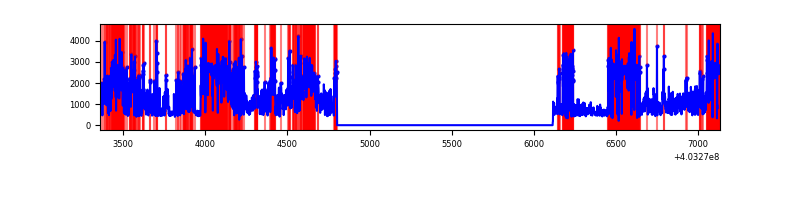 |
Top three noisy pixels from each quadrant. If the there are fewer than three noisy pixels in the level2.evt file, extra rows are filled as -1
| Pixel properties | Quadrant properties | ||||||
|---|---|---|---|---|---|---|---|
| Quadrant | DetID | PixID | Counts | Sigma | Mean | Median | Sigma |
| A | 10 | 83 | 170573 | 2810.4 | 289 | 284 | 60.6 |
| A | 7 | 16 | 38626 | 632.79 | 289 | 284 | 60.6 |
| A | 15 | 222 | 23712 | 386.65 | 289 | 284 | 60.6 |
| B | 5 | 184 | 38042 | 649.12 | 289 | 281 | 58.2 |
| B | 5 | 172 | 10140 | 169.48 | 289 | 281 | 58.2 |
| B | 12 | 111 | 7039 | 116.17 | 289 | 281 | 58.2 |
| C | 3 | 233 | 333408 | 4914.47 | 279 | 280 | 67.8 |
| C | 1 | 23 | 193997 | 2857.81 | 279 | 280 | 67.8 |
| C | 15 | 214 | 102829 | 1512.85 | 279 | 280 | 67.8 |
| D | 12 | 227 | 2527847 | 40583.57 | 246 | 238 | 62.3 |
| D | 13 | 249 | 86919 | 1391.76 | 246 | 238 | 62.3 |
| D | 2 | 250 | 29204 | 465.08 | 246 | 238 | 62.3 |
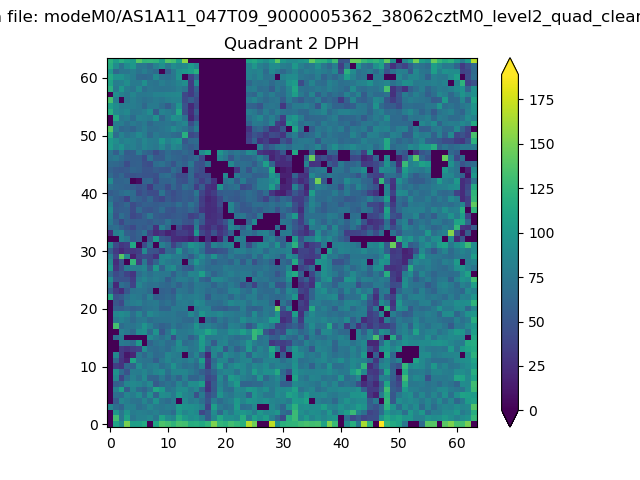
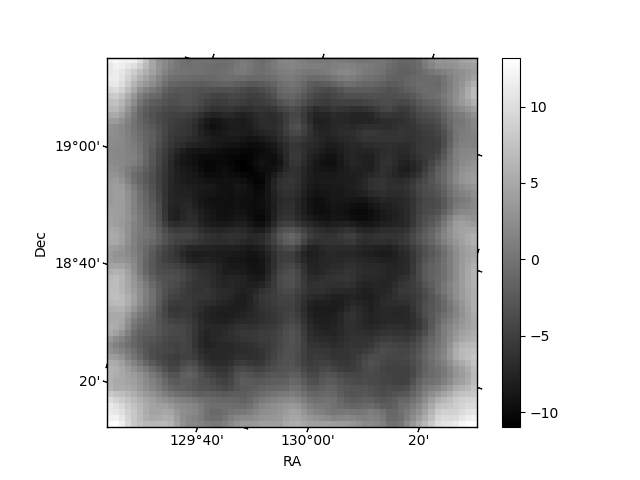
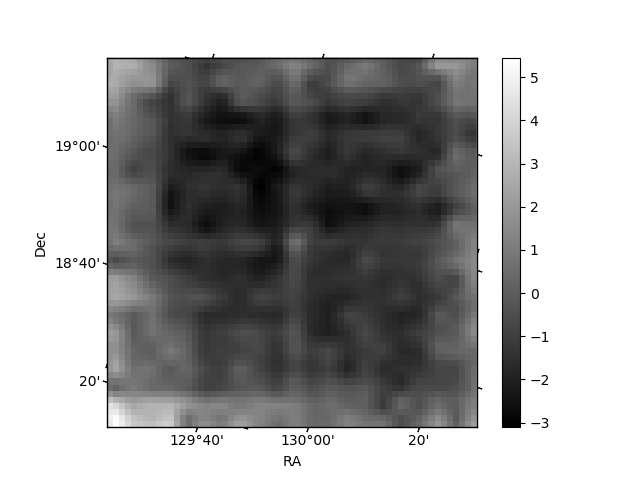
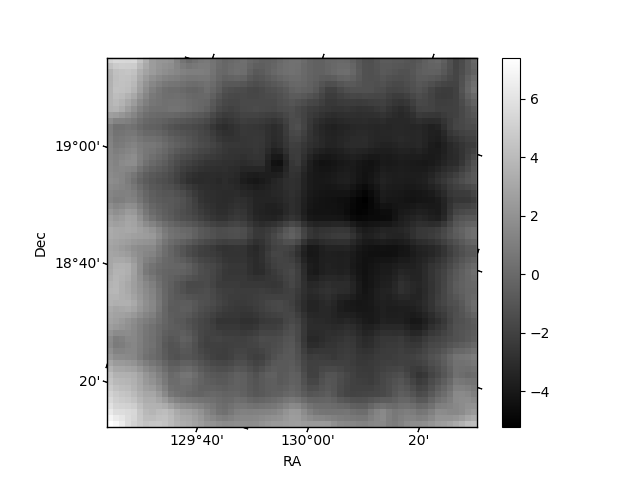
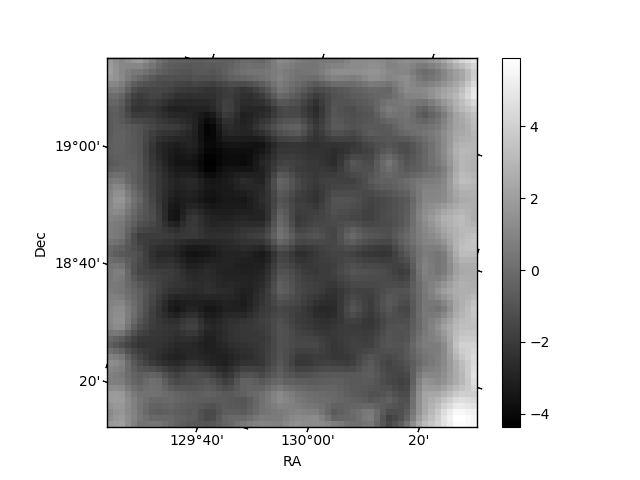
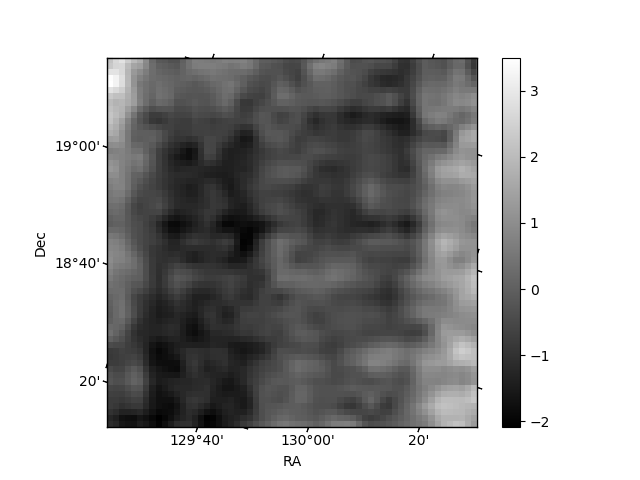
Histogram calculated using DETX and DETY for each event in the final _common_clean file
| Quadrant A | 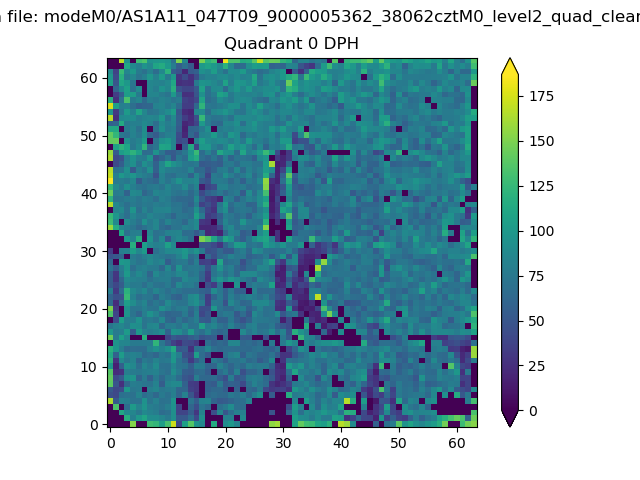 |
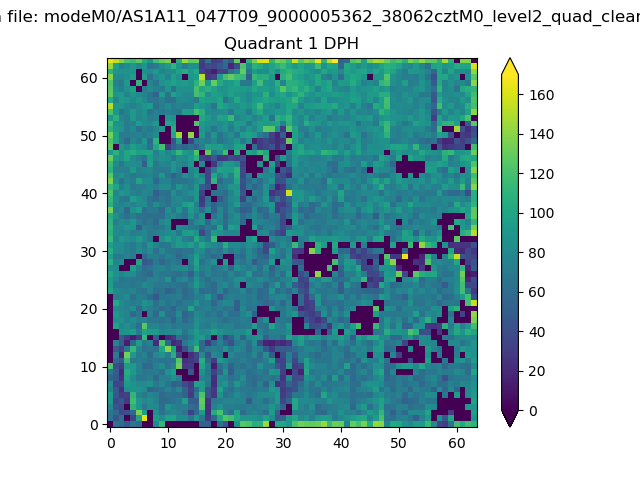 |
Quadrant B |
|---|---|---|---|
| Quadrant D | 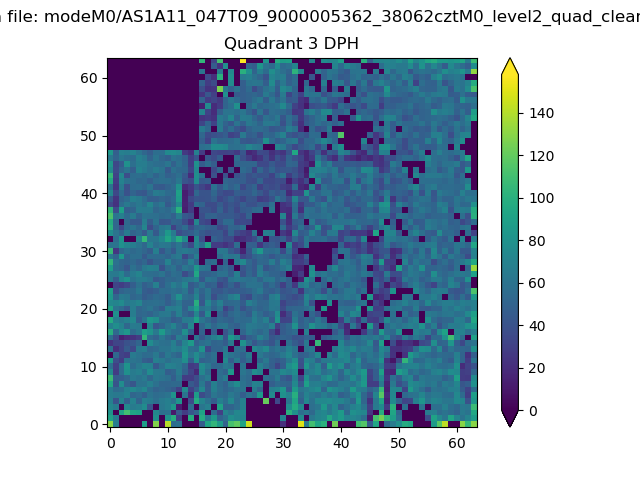 |
 |
Quadrant C |
| Plot type | Count rate plots | Images |
|---|---|---|
| Comparison with Poisson distribution Blue bars denote a histogram of data divided into 1 sec bins. Red curve is a Poisson curve with rate = median count rate of data. |
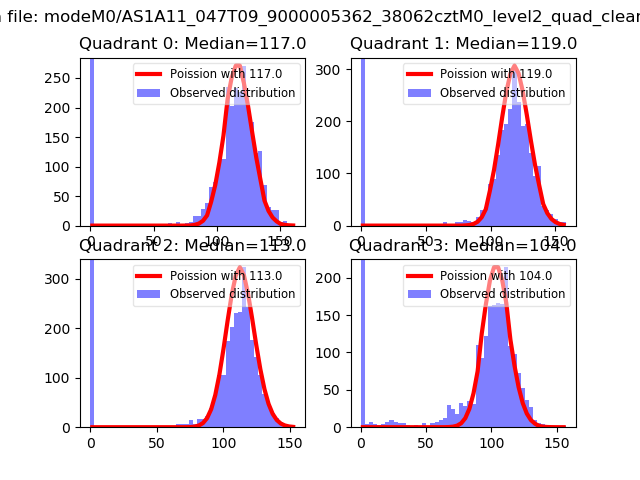 |
 |
| Quadrant-wise count rates Data is divided into 100 sec bins |
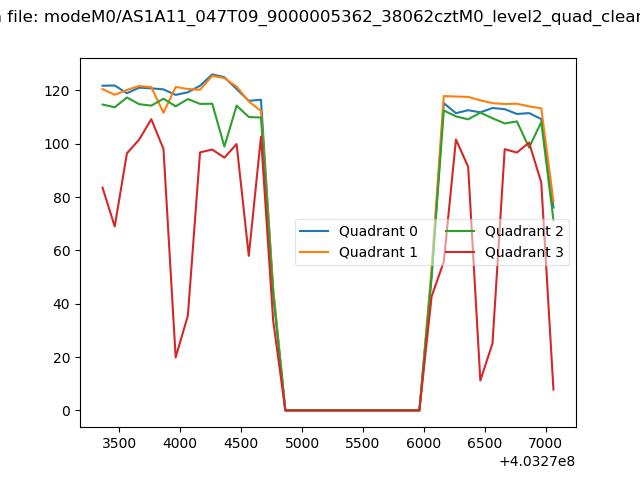 |
|
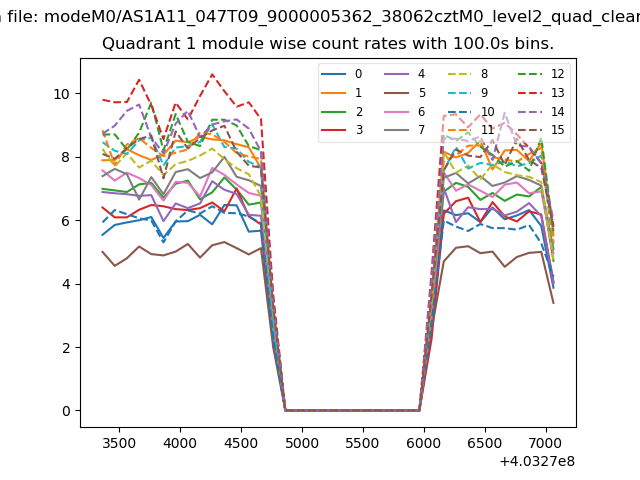
| Module-wise count rates for Quadrant A Data is divided into 100 sec bins |
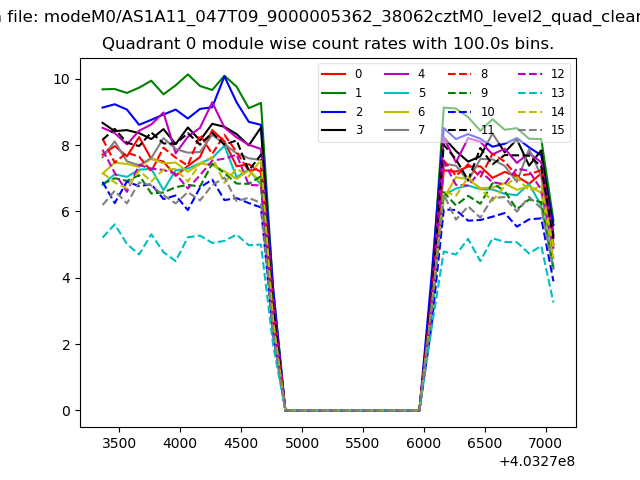 |
 |
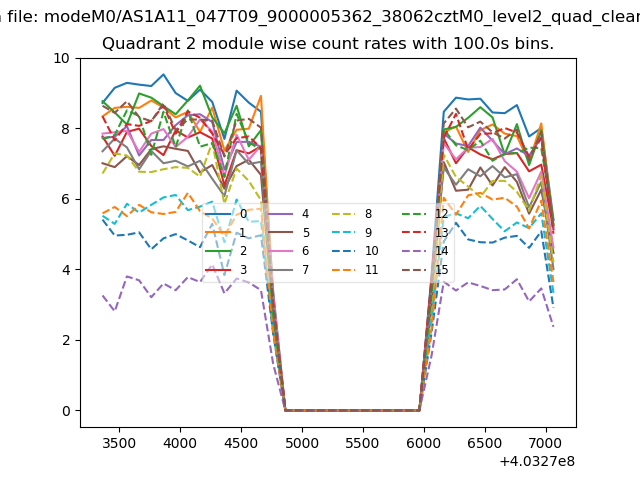
| Module-wise count rates for Quadrant B Data is divided into 100 sec bins |
 |
 |
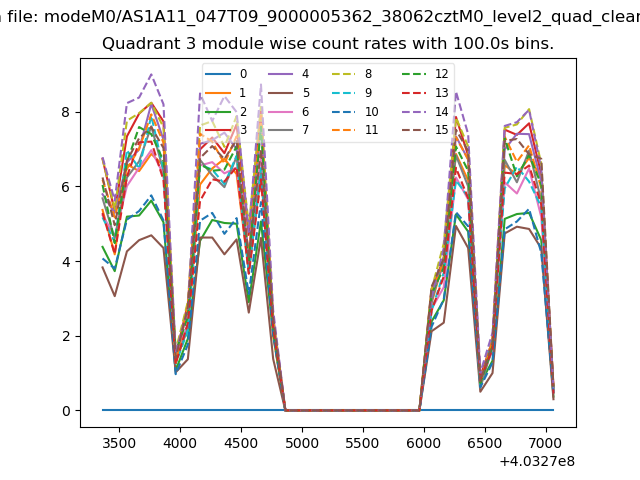
| Module-wise count rates for Quadrant C Data is divided into 100 sec bins |
 |
 |
| Module-wise count rates for Quadrant D Data is divided into 100 sec bins |
 |
 |
| Parameter | Plot |
|---|---|
| CZT HV Monitor | 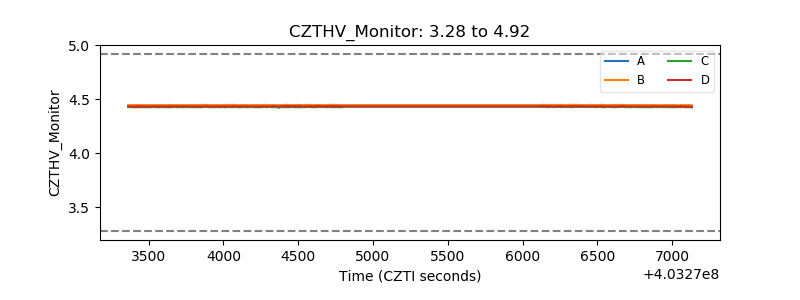 |
| D_VDD | 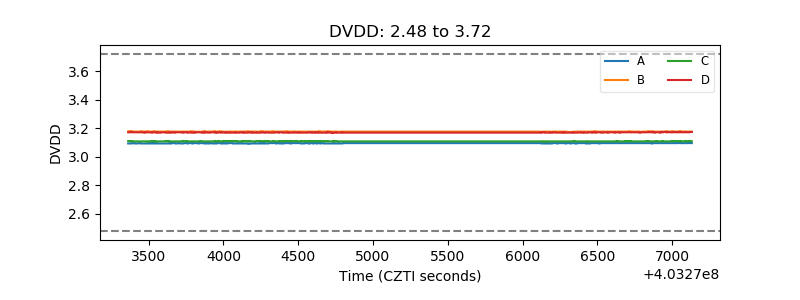 |
| Temperature 1 | 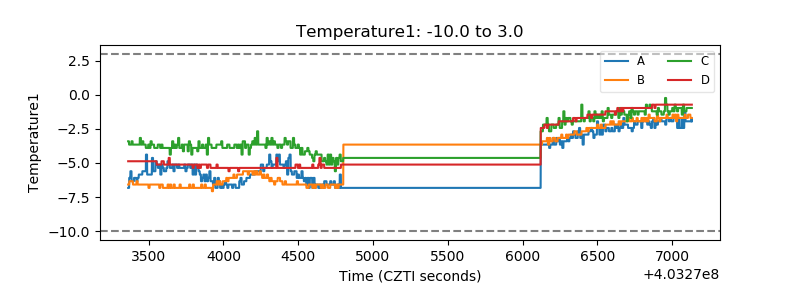 |
| Veto HV Monitor |  |
| Veto LLD | 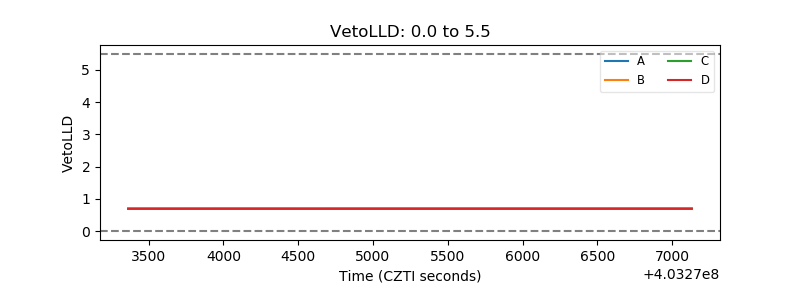 |
| Alpha Counter | 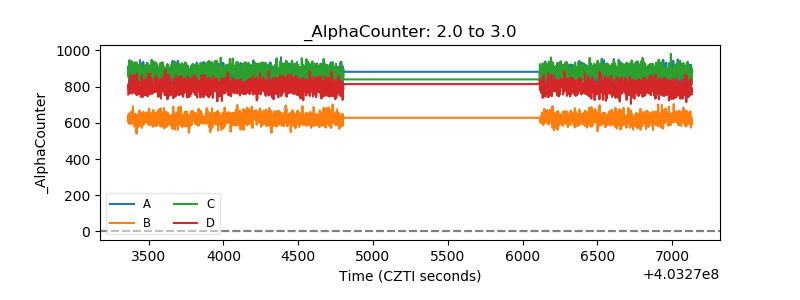 |
| _CPM_Rate | 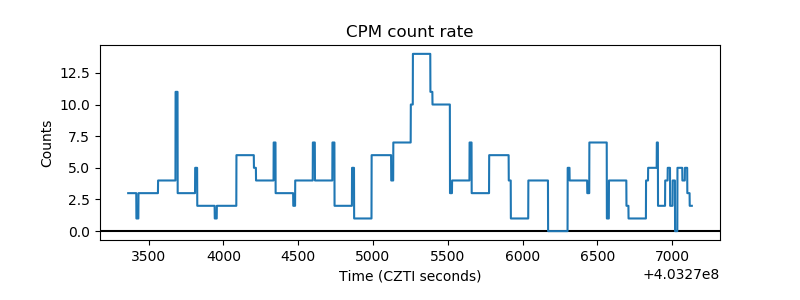 |
| CZT Counter | 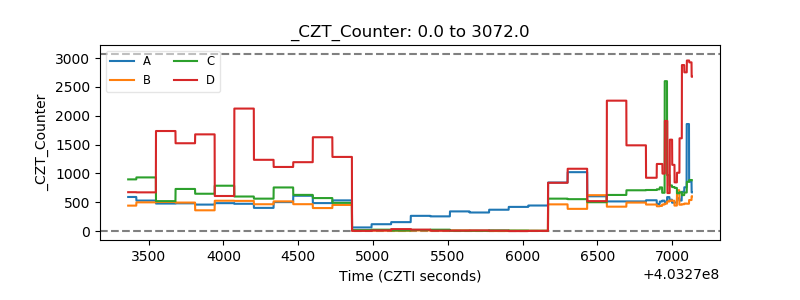 |
| +2.5 Volts monitor | 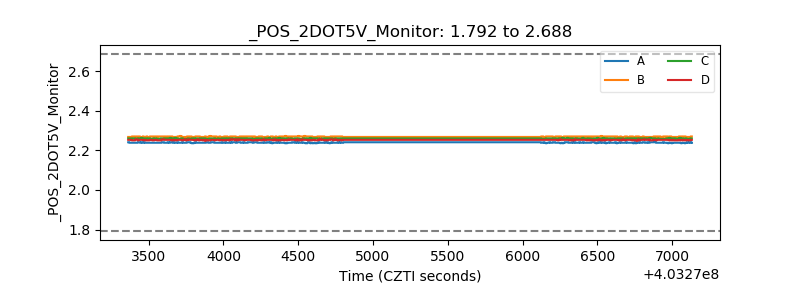 |
| +5 Volts monitor | 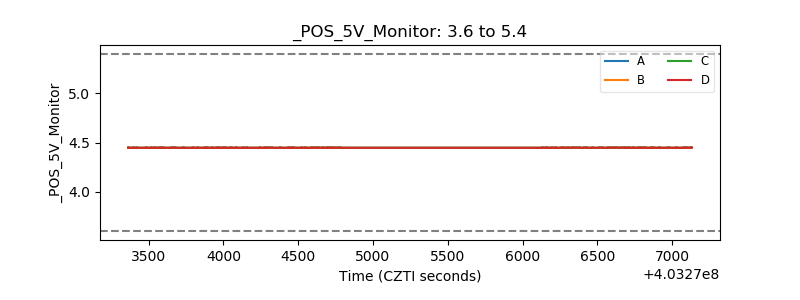 |
| _ROLL_ROT | 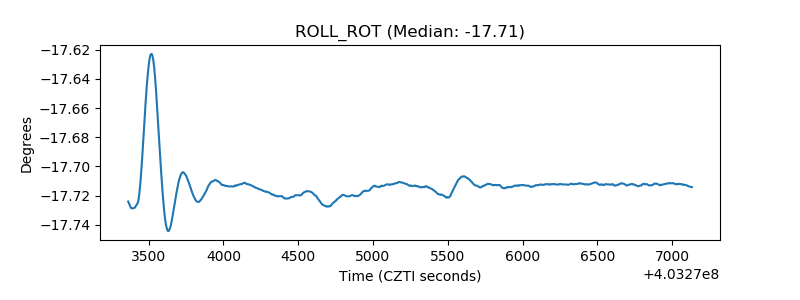 |
| _Roll_DEC | 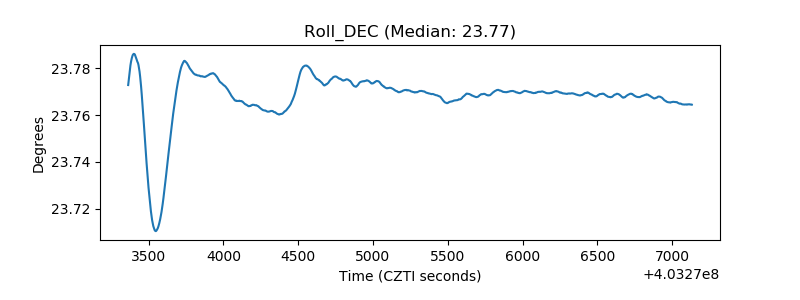 |
| _Roll_RA | 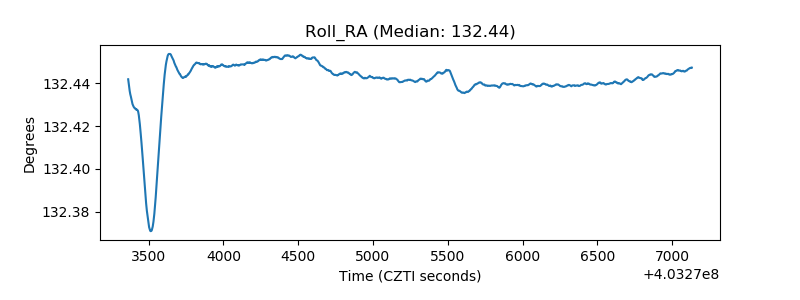 |
| Veto Counter | 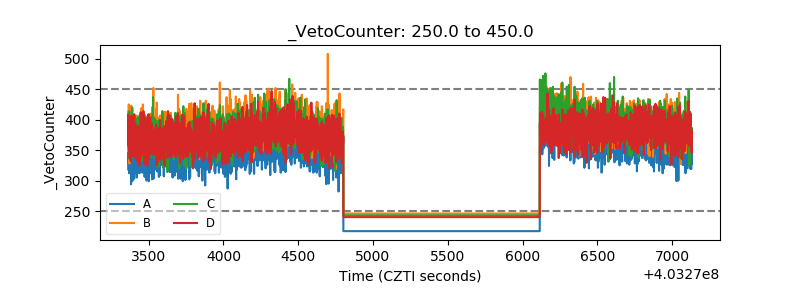 |