| Param | Original file | Final file |
|---|---|---|
| Filename | modeM0/AS1A11_047T09_9000005362_38066cztM0_level2.fits | modeM0/AS1A11_047T09_9000005362_38066cztM0_level2_quad_clean.evt |
| Size (bytes) | 366,626,880 | 93,695,040 |
| Size | 349.6 MB | 89.4 MB |
| Events in quadrant A | 3,025,288 | 644,961 |
| Events in quadrant B | 3,011,971 | 633,349 |
| Events in quadrant C | 3,505,566 | 618,779 |
| Events in quadrant D | 3,606,854 | 560,859 |
| Mode M0 | |||
|---|---|---|---|
| Quadrant | BADHDUFLAG | Total packets | Discarded packets |
| A | 0 | 12462 | 3 |
| B | 0 | 12461 | 2 |
| C | 0 | 13982 | 2 |
| D | 0 | 14403 | 2 |
| Mode SS | |||
|---|---|---|---|
| Quadrant | BADHDUFLAG | Total packets | Discarded packets |
| A | 0 | 110 | 0 |
| B | 0 | 110 | 0 |
| C | 0 | 110 | 0 |
| D | 0 | 110 | 0 |
| Mode M9 | |||
|---|---|---|---|
| Quadrant | BADHDUFLAG | Total packets | Discarded packets |
| A | 0 | 28 | 0 |
| B | 0 | 28 | 0 |
| C | 0 | 28 | 0 |
| D | 0 | 29 | 0 |
| Quadrant | Total seconds | Saturated seconds | Saturation percentage |
|---|---|---|---|
| A | 5415 | 31 | 0.572484% |
| B | 5415 | 165 | 3.047091% |
| C | 5415 | 109 | 2.012927% |
| D | 5415 | 311 | 5.743306% |
Noise dominated data is calculated using 1-second bins in cleaned event files. If a bin has >2000 counts, and if more than 50% of those come from <1% of pixels, then it is considered to be noise-dominated and hence unusable.
| Quadrant | # 1 sec bins | Bins with >0 counts | Bins with >2000 counts | High rate bins dominated by noise | Noise dominated (total time) | Noise dominated (detector-on time) | Marked lightcurve |
|---|---|---|---|---|---|---|---|
| A | 7059 | 5416 | 10 | 10 | 0.14% | 0.18% | 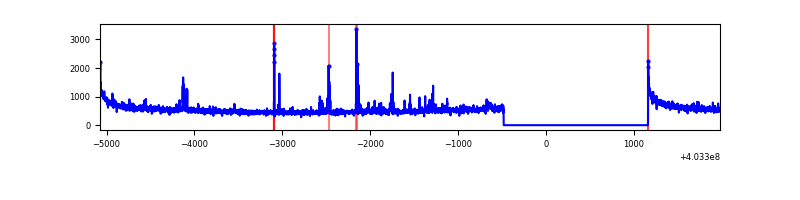 |
| B | 7059 | 5416 | 92 | 92 | 1.30% | 1.70% | 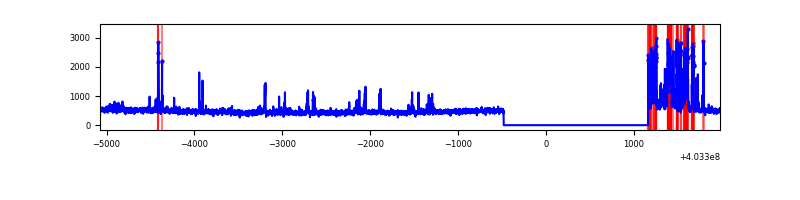 |
| C | 7059 | 5416 | 81 | 81 | 1.15% | 1.50% | 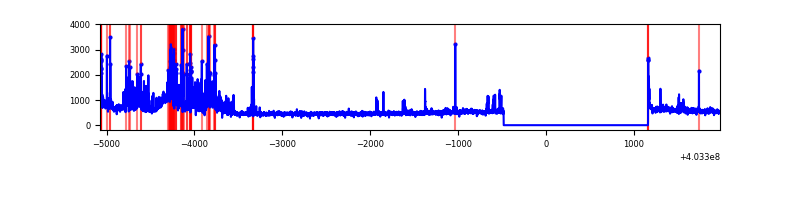 |
| D | 7059 | 5416 | 254 | 254 | 3.60% | 4.69% | 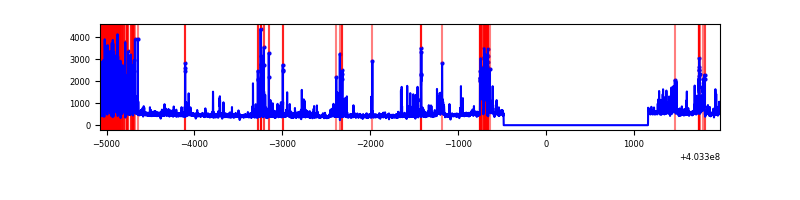 |
Top three noisy pixels from each quadrant. If the there are fewer than three noisy pixels in the level2.evt file, extra rows are filled as -1
| Pixel properties | Quadrant properties | ||||||
|---|---|---|---|---|---|---|---|
| Quadrant | DetID | PixID | Counts | Sigma | Mean | Median | Sigma |
| A | 10 | 83 | 383092 | 2929.32 | 641 | 630 | 130.6 |
| A | 12 | 16 | 44165 | 333.44 | 641 | 630 | 130.6 |
| A | 7 | 3 | 42858 | 323.43 | 641 | 630 | 130.6 |
| B | 5 | 172 | 365299 | 2950.65 | 627 | 609 | 123.6 |
| B | 4 | 232 | 67007 | 537.22 | 627 | 609 | 123.6 |
| B | 15 | 85 | 33216 | 263.82 | 627 | 609 | 123.6 |
| C | 1 | 23 | 520366 | 3546.77 | 622 | 625 | 146.5 |
| C | 3 | 233 | 291876 | 1987.53 | 622 | 625 | 146.5 |
| C | 15 | 214 | 225625 | 1535.43 | 622 | 625 | 146.5 |
| D | 12 | 227 | 735947 | 4890.82 | 611 | 593 | 150.4 |
| D | 12 | 233 | 157798 | 1045.57 | 611 | 593 | 150.4 |
| D | 2 | 250 | 100168 | 662.27 | 611 | 593 | 150.4 |
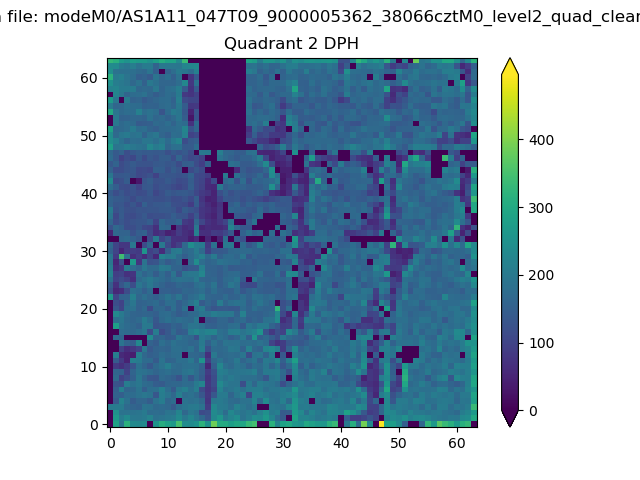
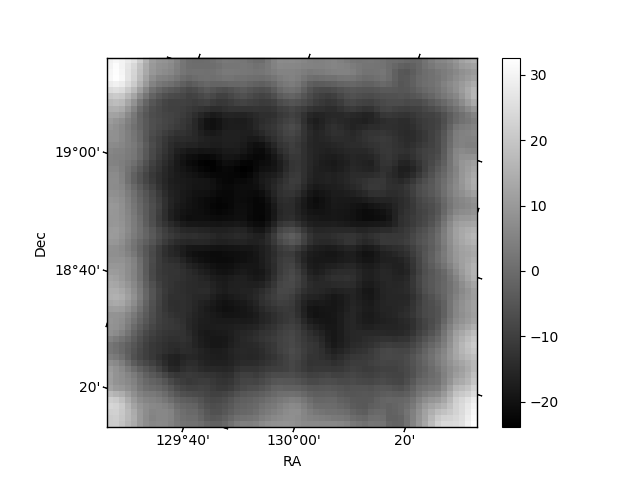
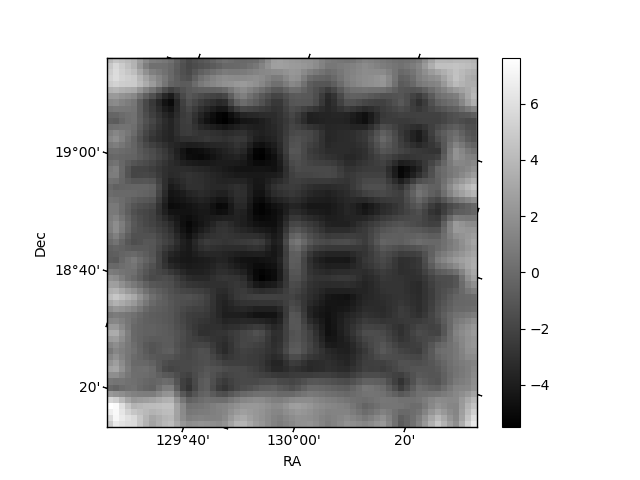
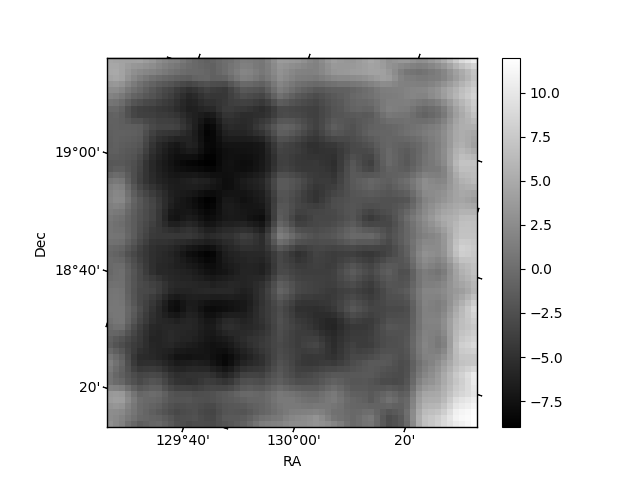
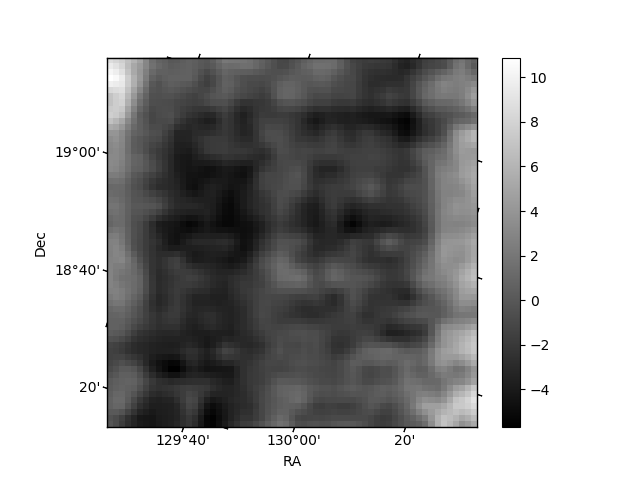
Histogram calculated using DETX and DETY for each event in the final _common_clean file
| Quadrant A | 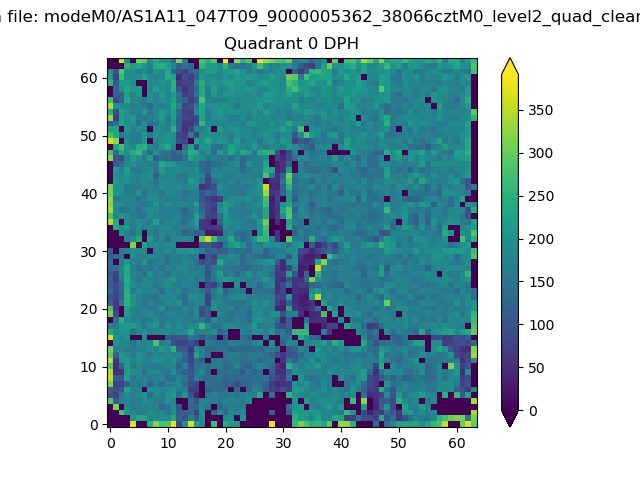 |
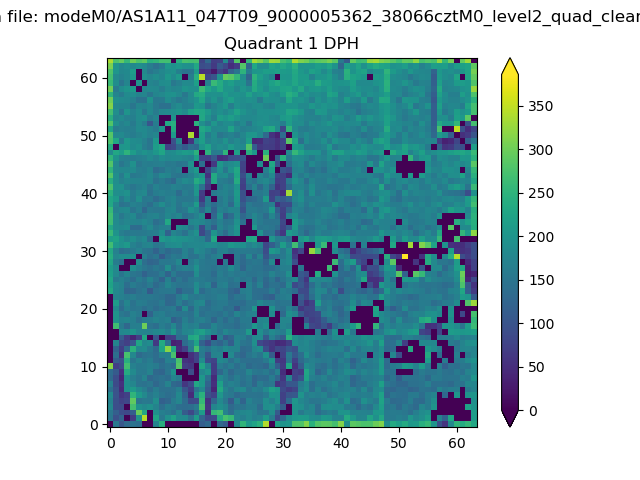 |
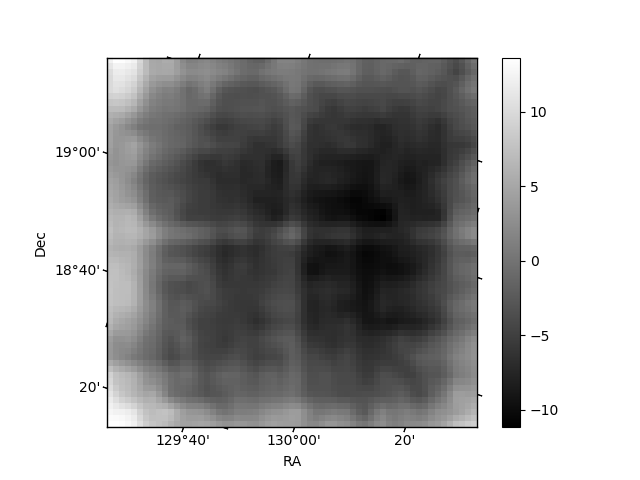
Quadrant B |
|---|---|---|---|
| Quadrant D | 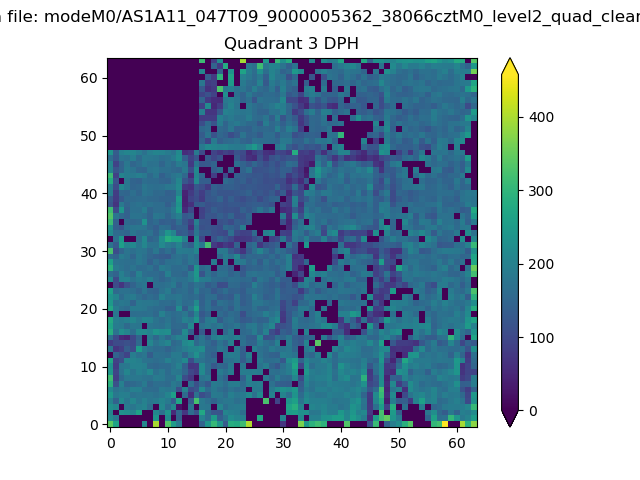 |
 |
Quadrant C |
| Plot type | Count rate plots | Images |
|---|---|---|
| Comparison with Poisson distribution Blue bars denote a histogram of data divided into 1 sec bins. Red curve is a Poisson curve with rate = median count rate of data. |
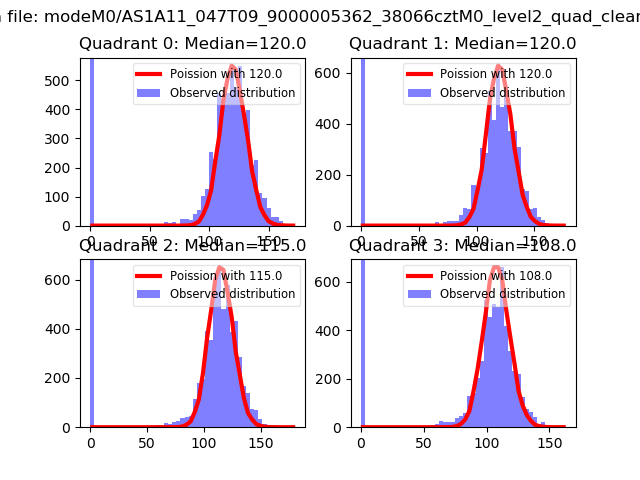 |
 |
| Quadrant-wise count rates Data is divided into 100 sec bins |
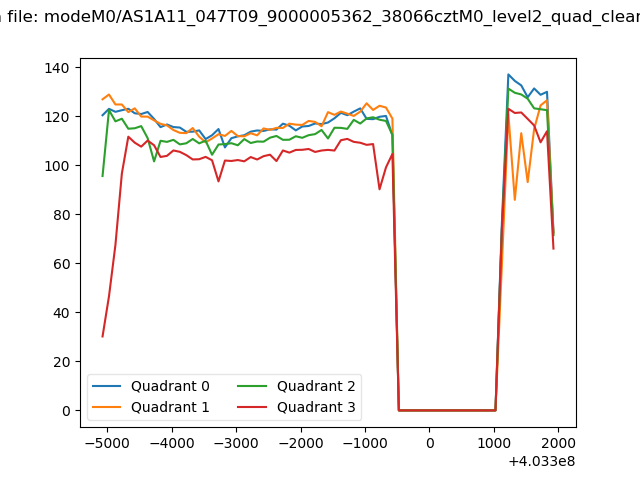 |
|
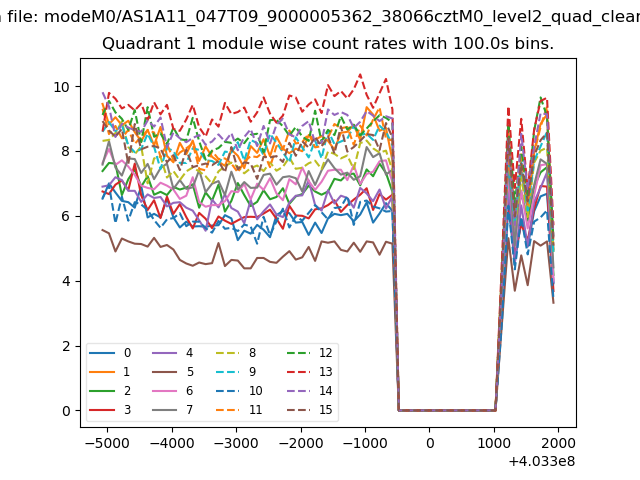
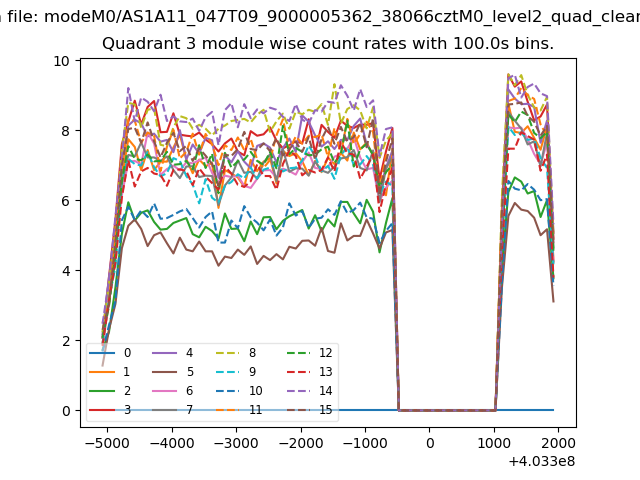
| Module-wise count rates for Quadrant A Data is divided into 100 sec bins |
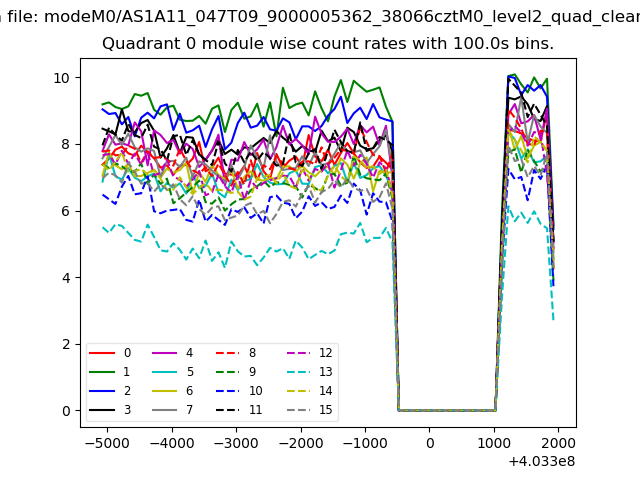 |
 |
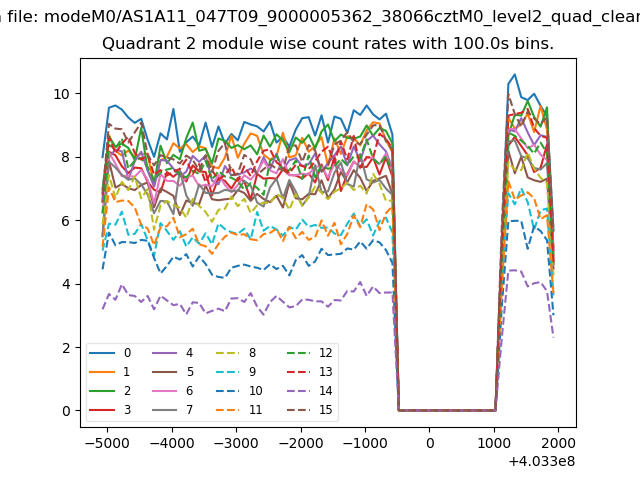
| Module-wise count rates for Quadrant B Data is divided into 100 sec bins |
 |
 |
| Module-wise count rates for Quadrant C Data is divided into 100 sec bins |
 |
 |
| Module-wise count rates for Quadrant D Data is divided into 100 sec bins |
 |
 |
| Parameter | Plot |
|---|---|
| CZT HV Monitor | 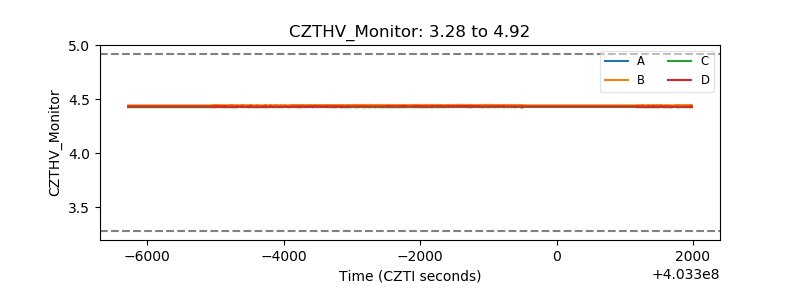 |
| D_VDD | 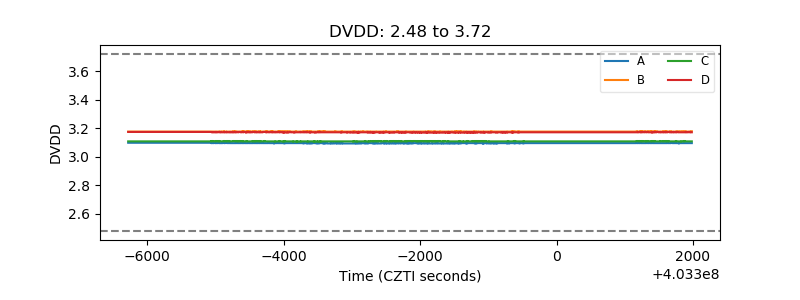 |
| Temperature 1 | 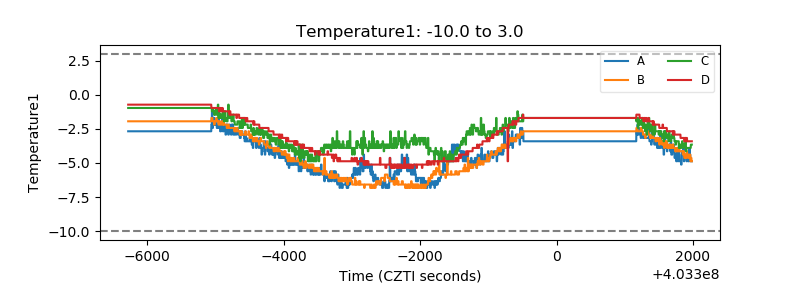 |
| Veto HV Monitor | 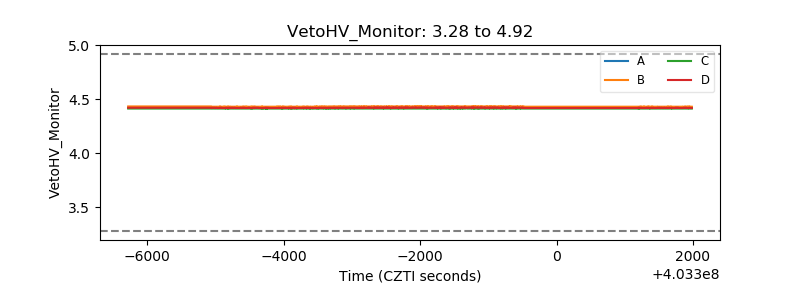 |
| Veto LLD | 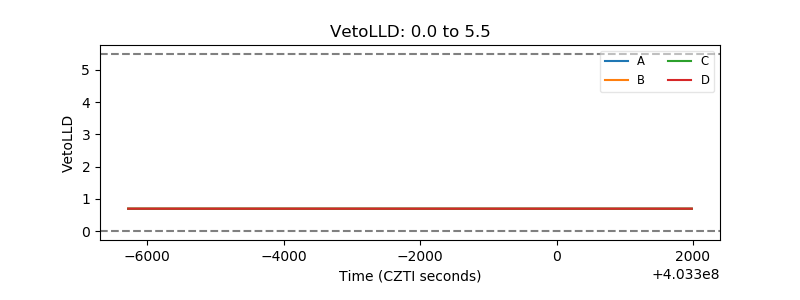 |
| Alpha Counter | 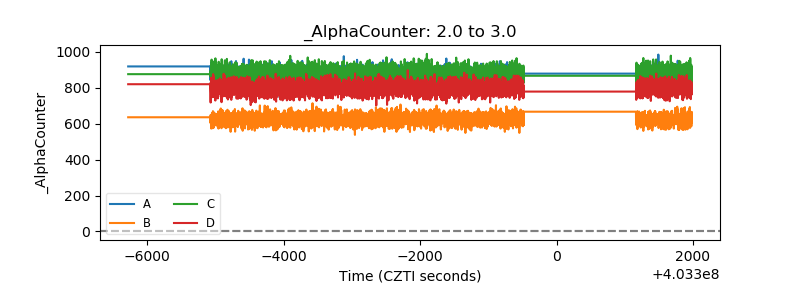 |
| _CPM_Rate | 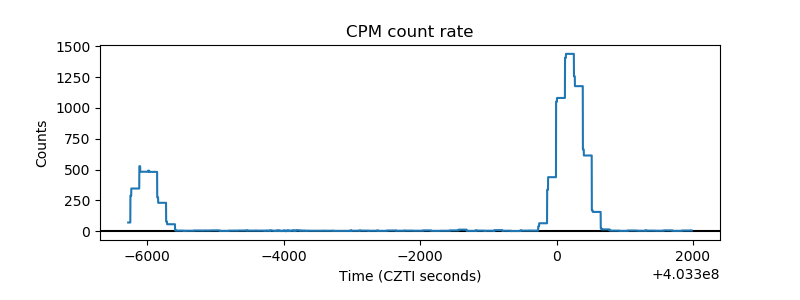 |
| CZT Counter | 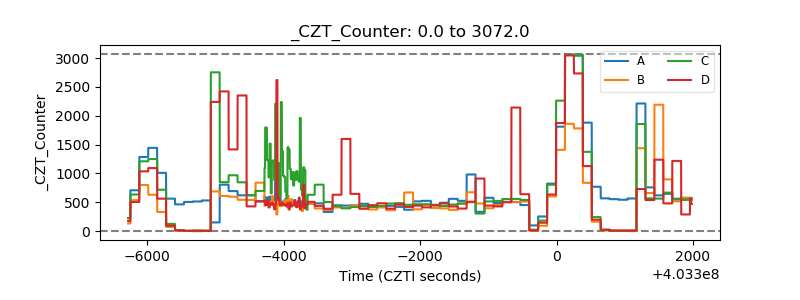 |
| +2.5 Volts monitor | 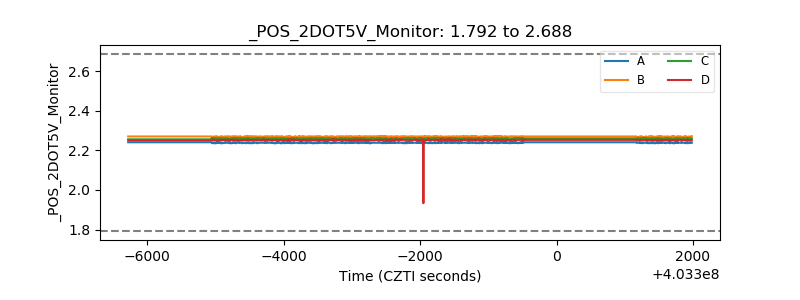 |
| +5 Volts monitor | 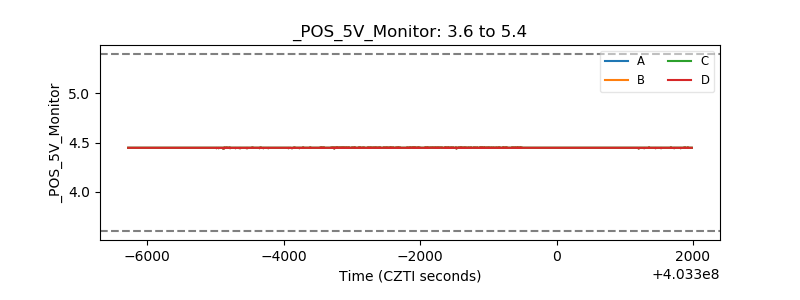 |
| _ROLL_ROT | 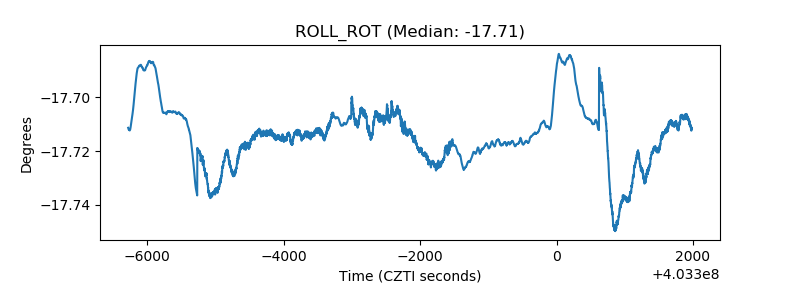 |
| _Roll_DEC | 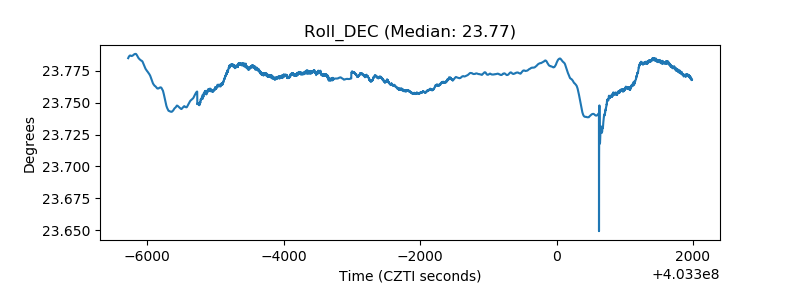 |
| _Roll_RA | 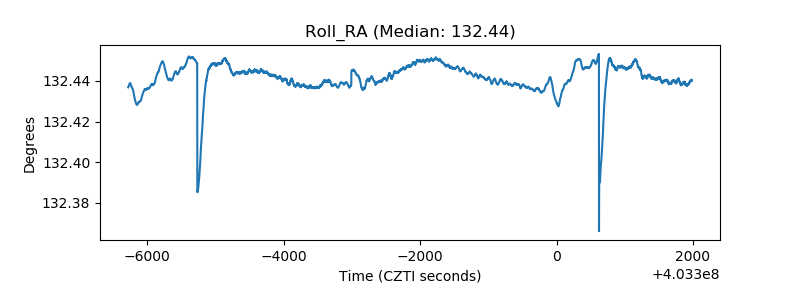 |
| Veto Counter | 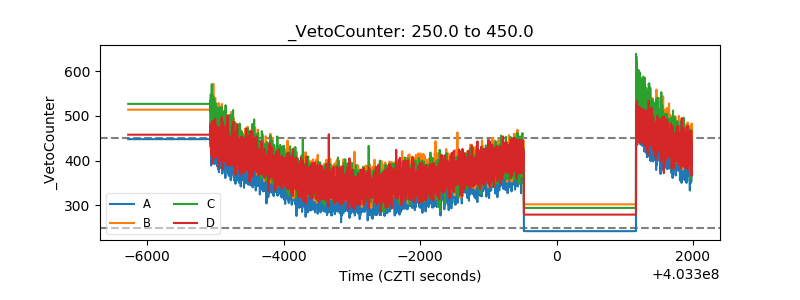 |