| Param | Original file | Final file |
|---|---|---|
| Filename | modeM0/AS1A11_047T09_9000005362_38068cztM0_level2.fits | modeM0/AS1A11_047T09_9000005362_38068cztM0_level2_quad_clean.evt |
| Size (bytes) | 333,797,760 | 95,800,320 |
| Size | 318.3 MB | 91.4 MB |
| Events in quadrant A | 2,907,201 | 657,022 |
| Events in quadrant B | 3,006,004 | 647,379 |
| Events in quadrant C | 2,786,783 | 636,091 |
| Events in quadrant D | 3,243,540 | 589,689 |
| Mode M0 | |||
|---|---|---|---|
| Quadrant | BADHDUFLAG | Total packets | Discarded packets |
| A | 0 | 11974 | 3 |
| B | 0 | 12362 | 2 |
| C | 0 | 11553 | 2 |
| D | 0 | 13177 | 2 |
| Mode SS | |||
|---|---|---|---|
| Quadrant | BADHDUFLAG | Total packets | Discarded packets |
| A | 0 | 108 | 0 |
| B | 0 | 108 | 0 |
| C | 0 | 108 | 0 |
| D | 0 | 108 | 0 |
| Mode M9 | |||
|---|---|---|---|
| Quadrant | BADHDUFLAG | Total packets | Discarded packets |
| A | 0 | 32 | 0 |
| B | 0 | 32 | 0 |
| C | 0 | 32 | 0 |
| D | 0 | 33 | 0 |
| Quadrant | Total seconds | Saturated seconds | Saturation percentage |
|---|---|---|---|
| A | 5295 | 30 | 0.566572% |
| B | 5295 | 168 | 3.172805% |
| C | 5295 | 22 | 0.415486% |
| D | 5295 | 76 | 1.435316% |
Noise dominated data is calculated using 1-second bins in cleaned event files. If a bin has >2000 counts, and if more than 50% of those come from <1% of pixels, then it is considered to be noise-dominated and hence unusable.
| Quadrant | # 1 sec bins | Bins with >0 counts | Bins with >2000 counts | High rate bins dominated by noise | Noise dominated (total time) | Noise dominated (detector-on time) | Marked lightcurve |
|---|---|---|---|---|---|---|---|
| A | 7088 | 5296 | 11 | 11 | 0.16% | 0.21% | 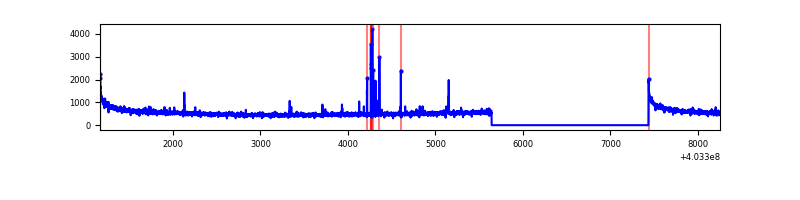 |
| B | 7088 | 5296 | 95 | 95 | 1.34% | 1.79% |  |
| C | 7088 | 5296 | 7 | 7 | 0.10% | 0.13% | 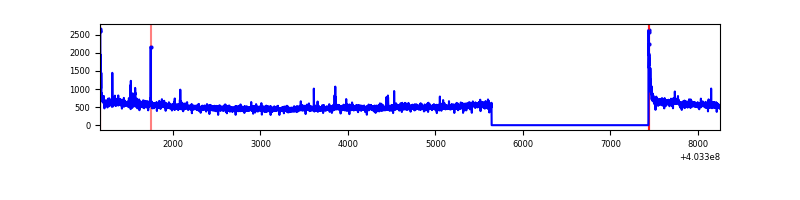 |
| D | 7088 | 5296 | 64 | 64 | 0.90% | 1.21% | 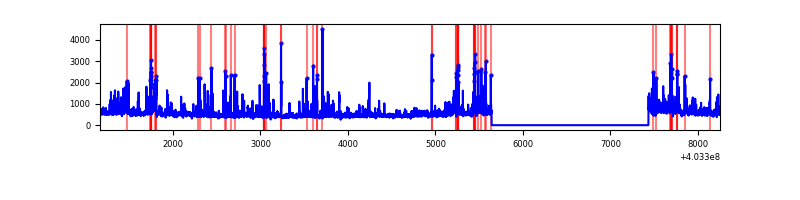 |
Top three noisy pixels from each quadrant. If the there are fewer than three noisy pixels in the level2.evt file, extra rows are filled as -1
| Pixel properties | Quadrant properties | ||||||
|---|---|---|---|---|---|---|---|
| Quadrant | DetID | PixID | Counts | Sigma | Mean | Median | Sigma |
| A | 10 | 83 | 371786 | 2887.89 | 633 | 621 | 128.5 |
| A | 9 | 143 | 41279 | 316.34 | 633 | 621 | 128.5 |
| A | 12 | 189 | 15986 | 119.55 | 633 | 621 | 128.5 |
| B | 5 | 172 | 385604 | 3177.45 | 624 | 607 | 121.2 |
| B | 4 | 171 | 63014 | 515.06 | 624 | 607 | 121.2 |
| B | 0 | 229 | 40466 | 328.96 | 624 | 607 | 121.2 |
| C | 15 | 214 | 218916 | 1508.13 | 620 | 625 | 144.7 |
| C | 3 | 233 | 69327 | 474.65 | 620 | 625 | 144.7 |
| C | 0 | 10 | 41521 | 282.54 | 620 | 625 | 144.7 |
| D | 12 | 233 | 193868 | 1276.43 | 617 | 602 | 151.4 |
| D | 1 | 52 | 161775 | 1064.47 | 617 | 602 | 151.4 |
| D | 13 | 200 | 120934 | 794.74 | 617 | 602 | 151.4 |
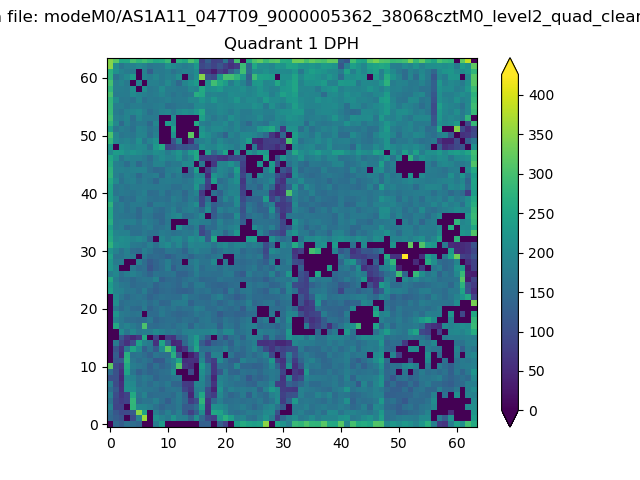
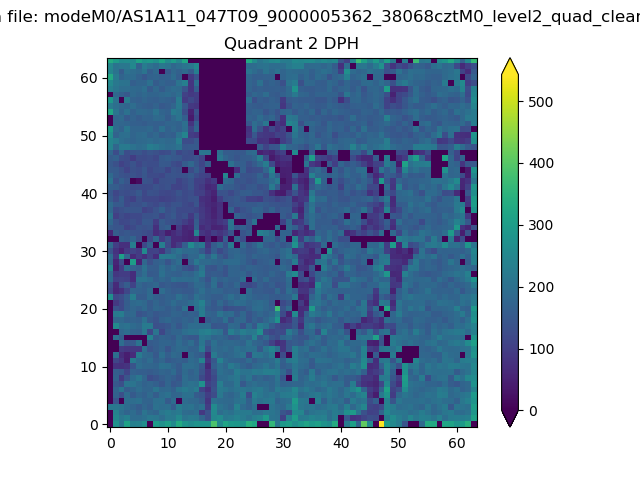
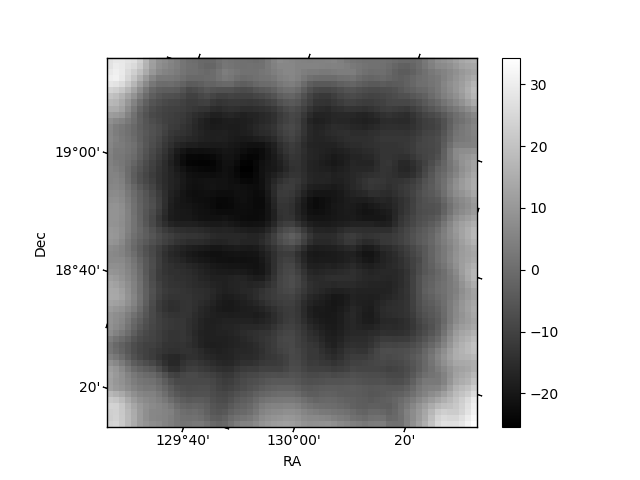
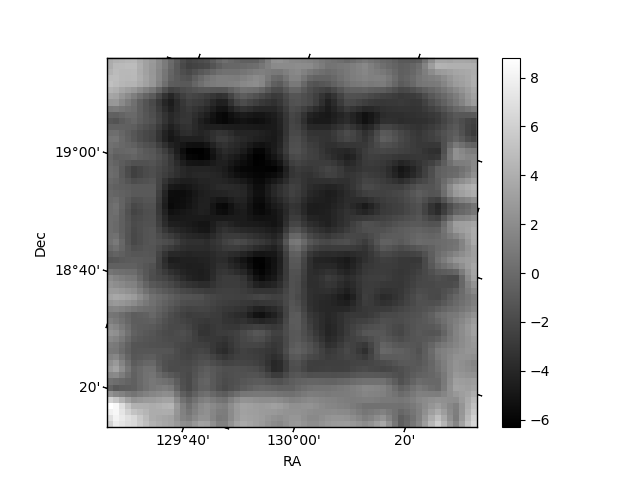
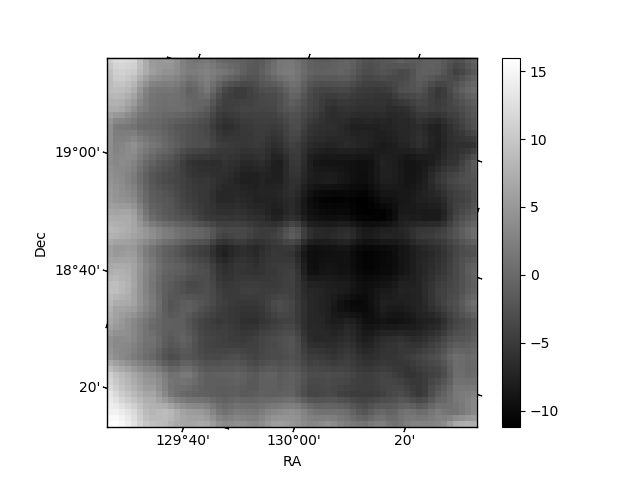
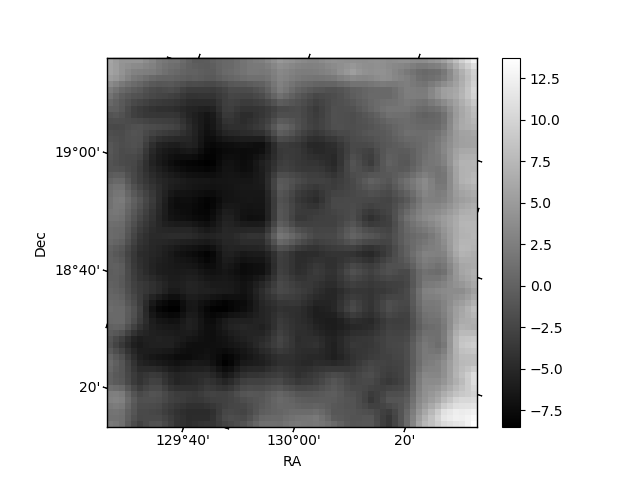
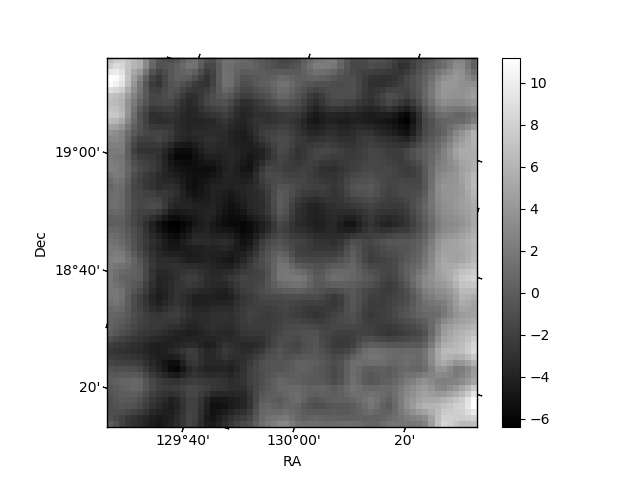
Histogram calculated using DETX and DETY for each event in the final _common_clean file
| Quadrant A | 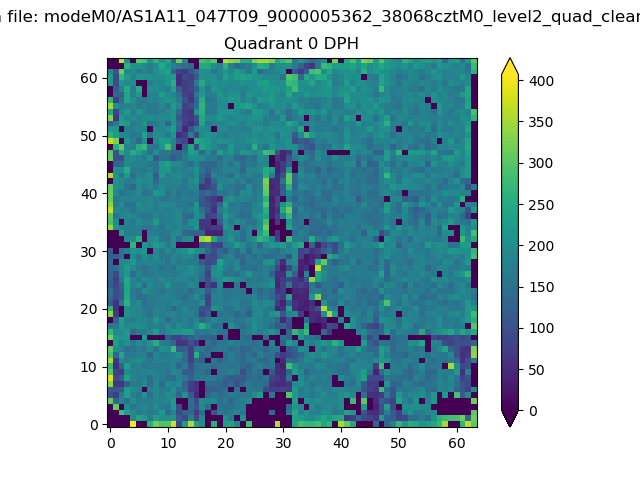 |
 |
Quadrant B |
|---|---|---|---|
| Quadrant D | 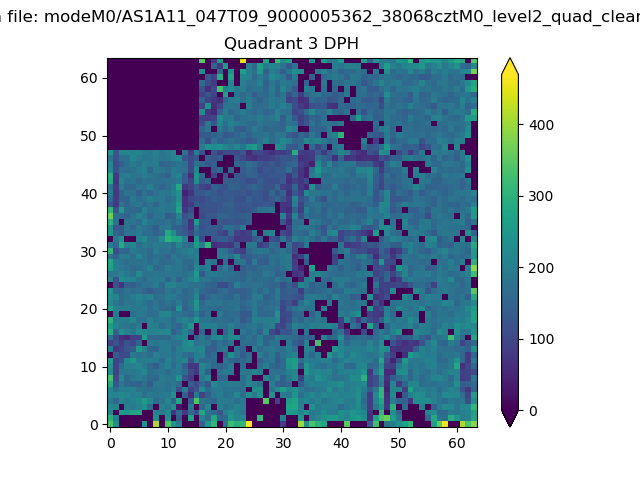 |
 |
Quadrant C |
| Plot type | Count rate plots | Images |
|---|---|---|
| Comparison with Poisson distribution Blue bars denote a histogram of data divided into 1 sec bins. Red curve is a Poisson curve with rate = median count rate of data. |
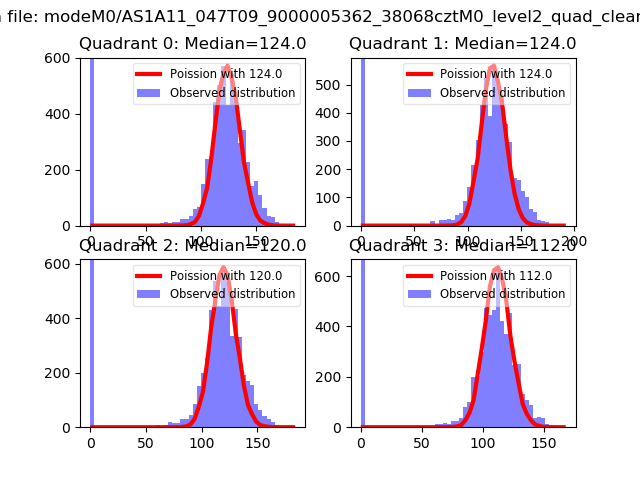 |
 |
| Quadrant-wise count rates Data is divided into 100 sec bins |
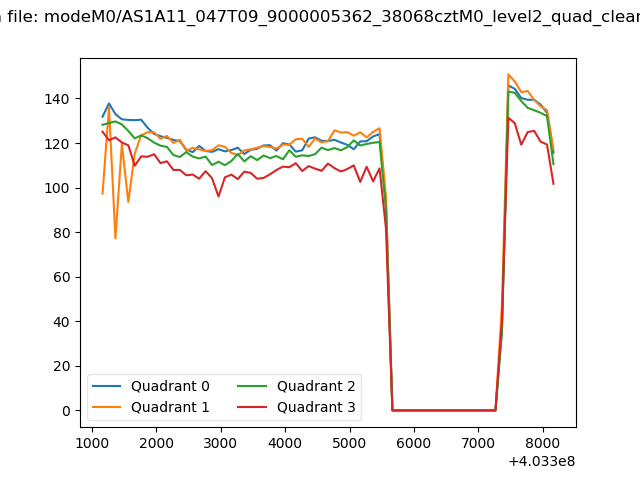 |
|
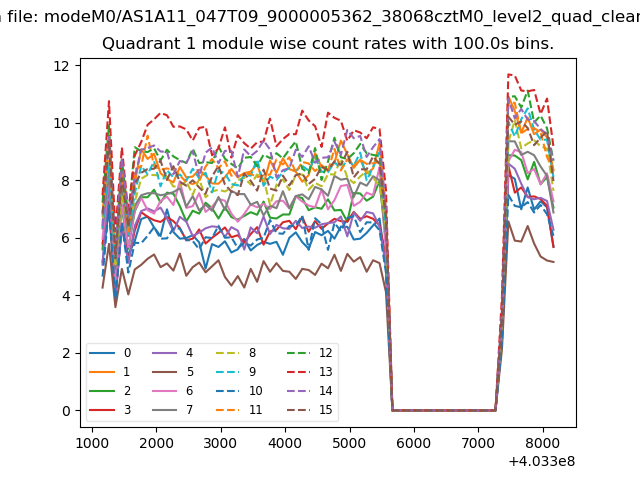
| Module-wise count rates for Quadrant A Data is divided into 100 sec bins |
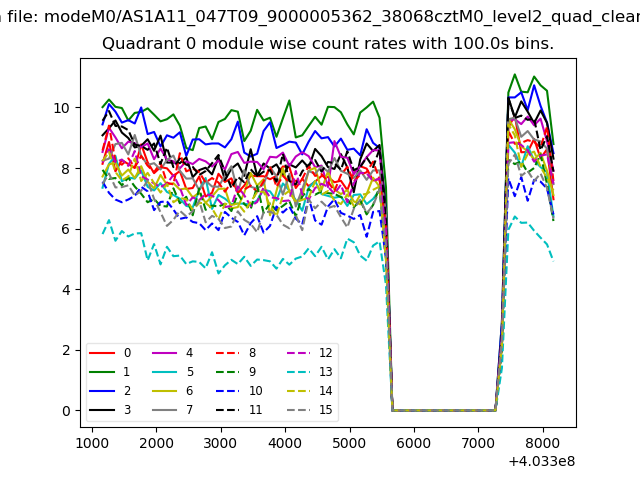 |
 |
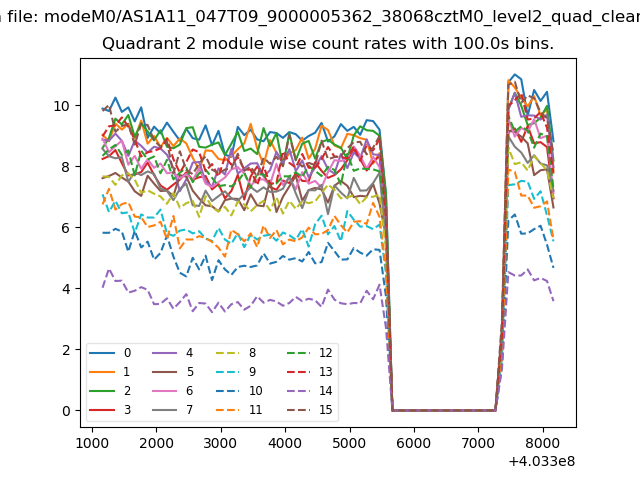
| Module-wise count rates for Quadrant B Data is divided into 100 sec bins |
 |
 |
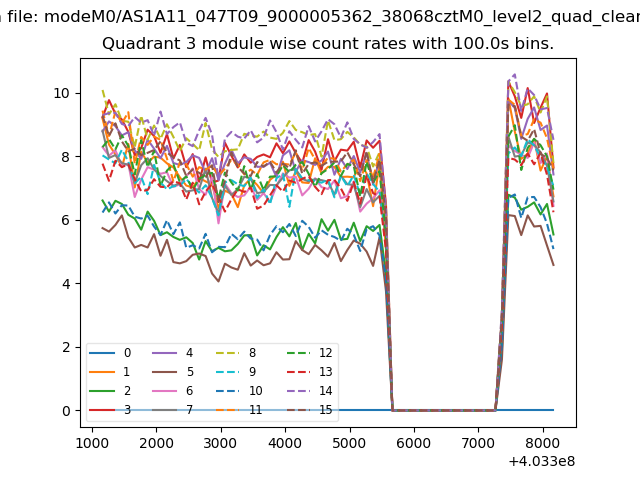
| Module-wise count rates for Quadrant C Data is divided into 100 sec bins |
 |
 |
| Module-wise count rates for Quadrant D Data is divided into 100 sec bins |
 |
 |
| Parameter | Plot |
|---|---|
| CZT HV Monitor | 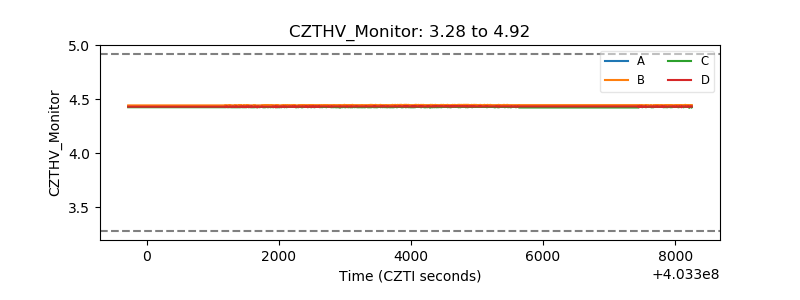 |
| D_VDD | 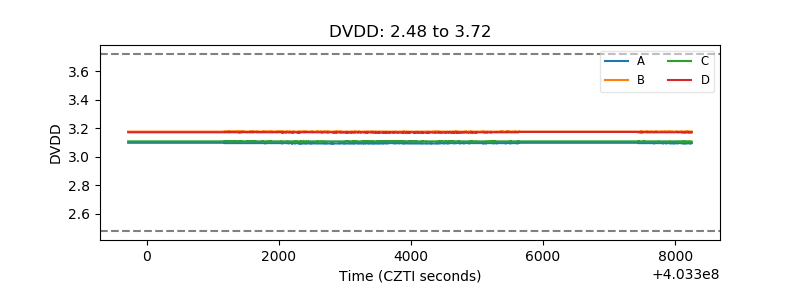 |
| Temperature 1 | 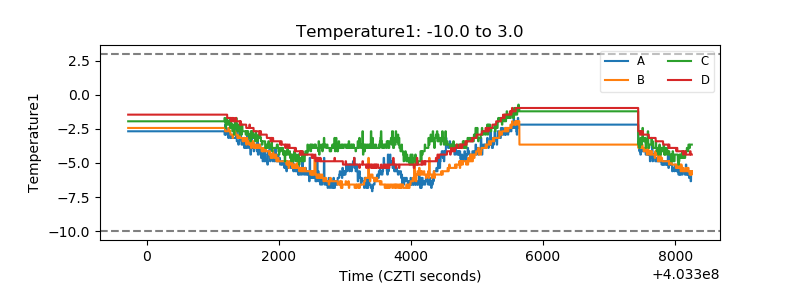 |
| Veto HV Monitor | 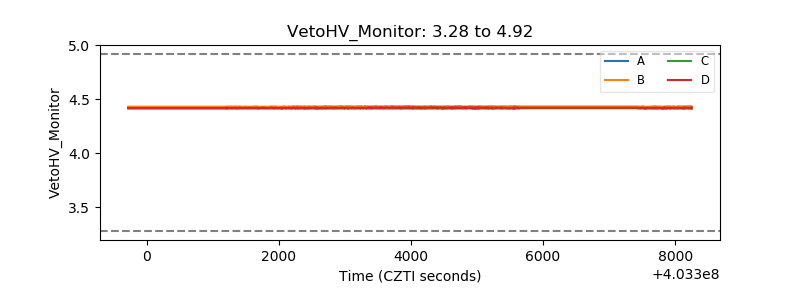 |
| Veto LLD | 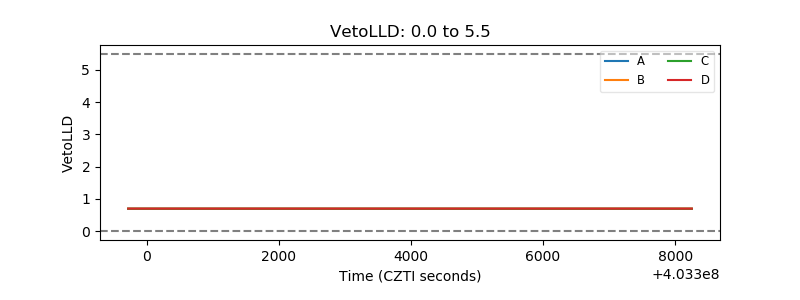 |
| Alpha Counter | 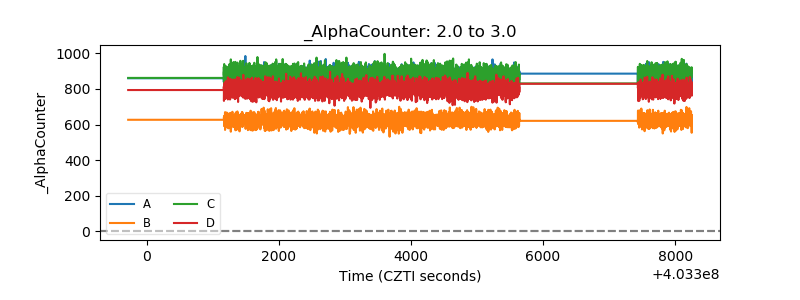 |
| _CPM_Rate | 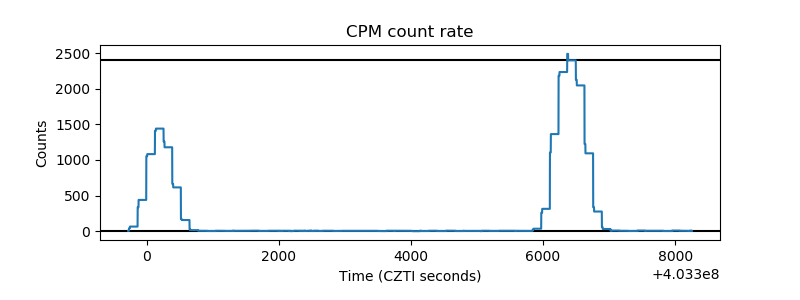 |
| CZT Counter | 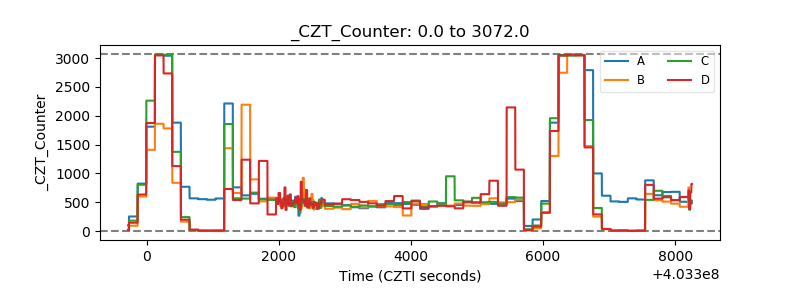 |
| +2.5 Volts monitor | 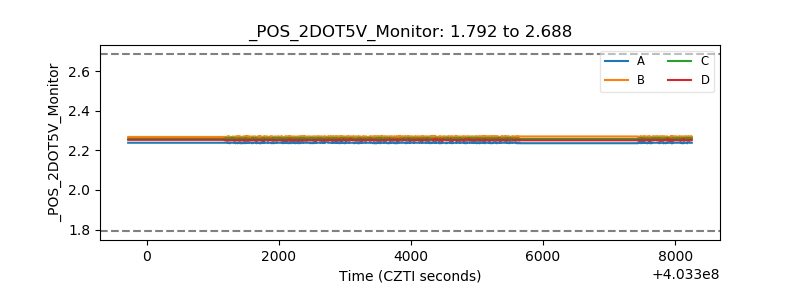 |
| +5 Volts monitor | 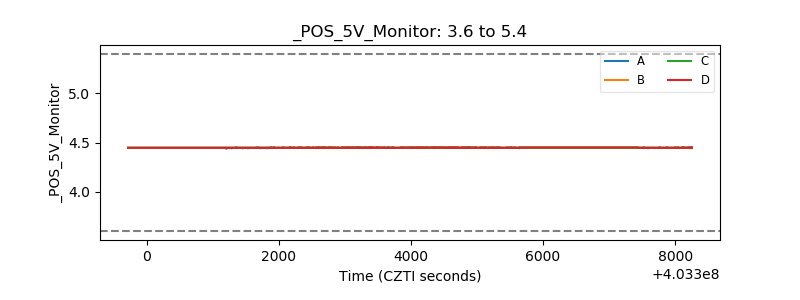 |
| _ROLL_ROT | 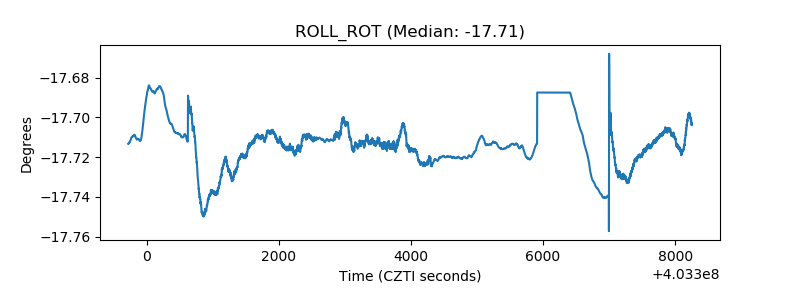 |
| _Roll_DEC | 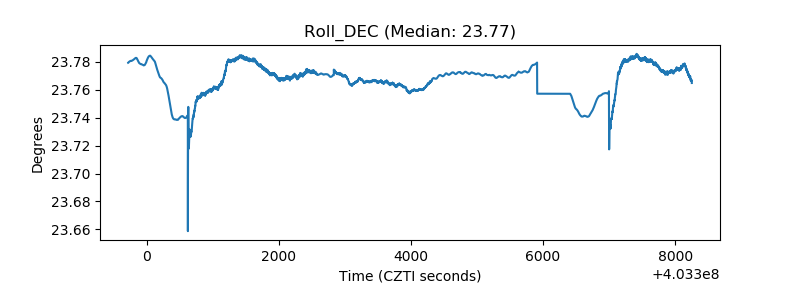 |
| _Roll_RA | 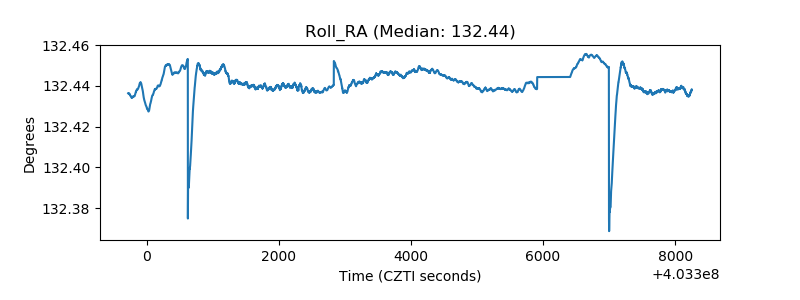 |
| Veto Counter | 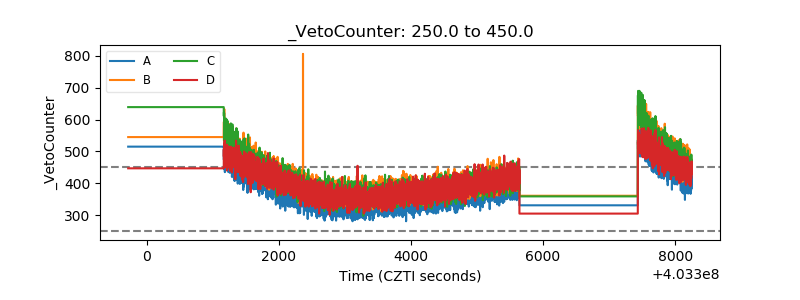 |