| Param | Original file | Final file |
|---|---|---|
| Filename | modeM0/AS1A11_047T09_9000005362_38069cztM0_level2.fits | modeM0/AS1A11_047T09_9000005362_38069cztM0_level2_quad_clean.evt |
| Size (bytes) | 334,471,680 | 97,917,120 |
| Size | 319.0 MB | 93.4 MB |
| Events in quadrant A | 2,869,524 | 671,238 |
| Events in quadrant B | 2,875,146 | 683,259 |
| Events in quadrant C | 2,760,141 | 651,713 |
| Events in quadrant D | 3,470,987 | 594,399 |
| Mode M0 | |||
|---|---|---|---|
| Quadrant | BADHDUFLAG | Total packets | Discarded packets |
| A | 0 | 11690 | 3 |
| B | 0 | 11822 | 2 |
| C | 0 | 11314 | 2 |
| D | 0 | 13857 | 2 |
| Mode SS | |||
|---|---|---|---|
| Quadrant | BADHDUFLAG | Total packets | Discarded packets |
| A | 0 | 106 | 0 |
| B | 0 | 106 | 0 |
| C | 0 | 106 | 0 |
| D | 0 | 106 | 0 |
| Mode M9 | |||
|---|---|---|---|
| Quadrant | BADHDUFLAG | Total packets | Discarded packets |
| A | 0 | 29 | 0 |
| B | 0 | 29 | 0 |
| C | 0 | 29 | 0 |
| D | 0 | 30 | 0 |
| Quadrant | Total seconds | Saturated seconds | Saturation percentage |
|---|---|---|---|
| A | 5206 | 17 | 0.326546% |
| B | 5206 | 60 | 1.152516% |
| C | 5206 | 20 | 0.384172% |
| D | 5206 | 90 | 1.728774% |
Noise dominated data is calculated using 1-second bins in cleaned event files. If a bin has >2000 counts, and if more than 50% of those come from <1% of pixels, then it is considered to be noise-dominated and hence unusable.
| Quadrant | # 1 sec bins | Bins with >0 counts | Bins with >2000 counts | High rate bins dominated by noise | Noise dominated (total time) | Noise dominated (detector-on time) | Marked lightcurve |
|---|---|---|---|---|---|---|---|
| A | 7119 | 5207 | 3 | 3 | 0.04% | 0.06% | 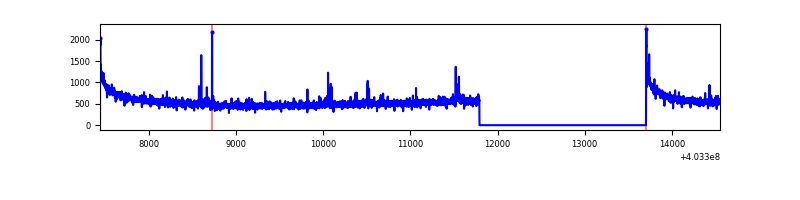 |
| B | 7119 | 5207 | 42 | 42 | 0.59% | 0.81% | 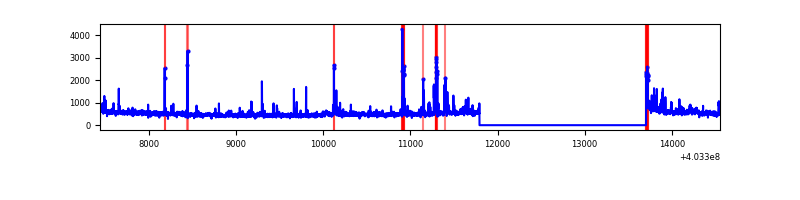 |
| C | 7119 | 5207 | 8 | 8 | 0.11% | 0.15% | 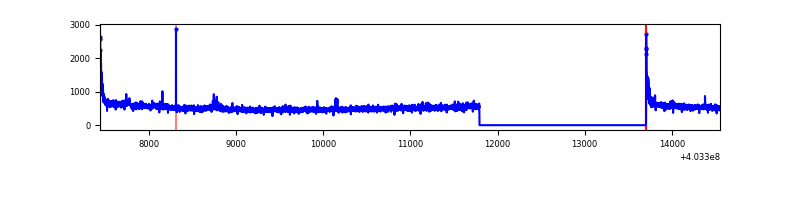 |
| D | 7119 | 5207 | 86 | 86 | 1.21% | 1.65% | 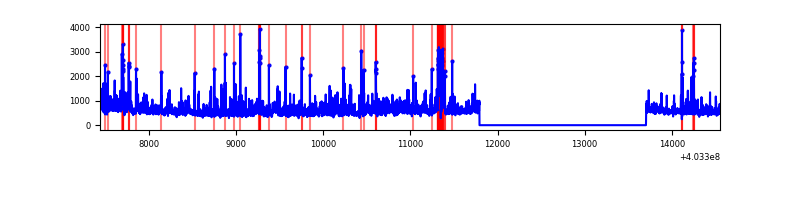 |
Top three noisy pixels from each quadrant. If the there are fewer than three noisy pixels in the level2.evt file, extra rows are filled as -1
| Pixel properties | Quadrant properties | ||||||
|---|---|---|---|---|---|---|---|
| Quadrant | DetID | PixID | Counts | Sigma | Mean | Median | Sigma |
| A | 10 | 83 | 355816 | 2782.82 | 633 | 621 | 127.6 |
| A | 7 | 3 | 25919 | 198.2 | 633 | 621 | 127.6 |
| A | 10 | 248 | 13630 | 101.92 | 633 | 621 | 127.6 |
| B | 4 | 171 | 183623 | 1504.89 | 633 | 616 | 121.6 |
| B | 5 | 172 | 53237 | 432.71 | 633 | 616 | 121.6 |
| B | 5 | 184 | 44113 | 357.68 | 633 | 616 | 121.6 |
| C | 15 | 214 | 215845 | 1484.77 | 620 | 626 | 145.0 |
| C | 3 | 233 | 57446 | 392.0 | 620 | 626 | 145.0 |
| C | 0 | 10 | 50857 | 346.54 | 620 | 626 | 145.0 |
| D | 1 | 52 | 482063 | 3219.79 | 611 | 594 | 149.5 |
| D | 7 | 55 | 120629 | 802.73 | 611 | 594 | 149.5 |
| D | 13 | 200 | 116391 | 774.39 | 611 | 594 | 149.5 |
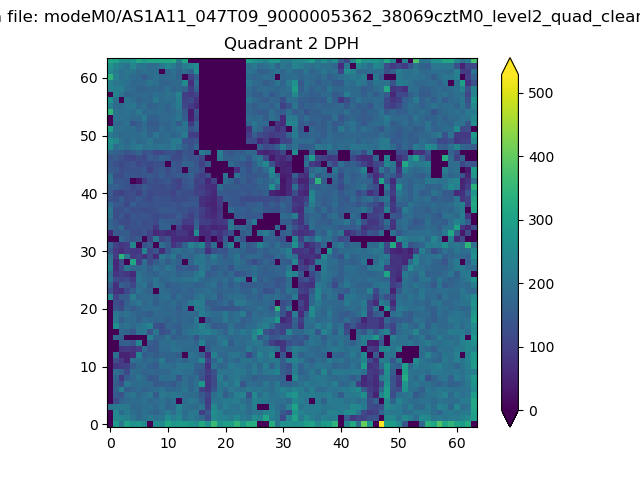
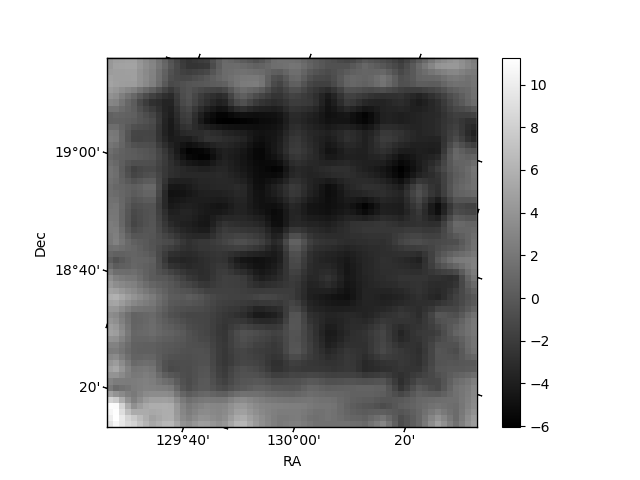
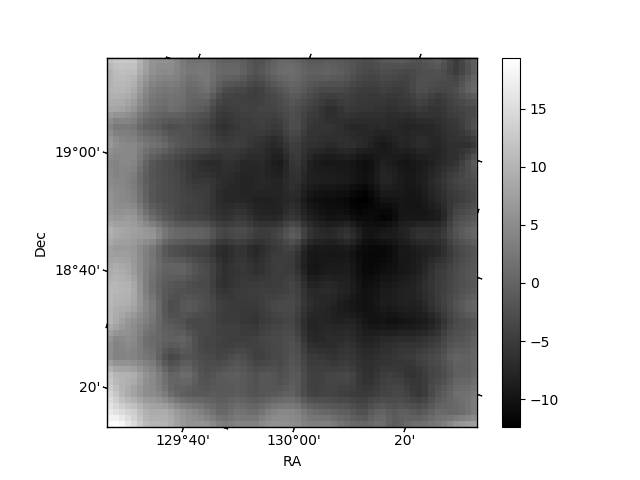
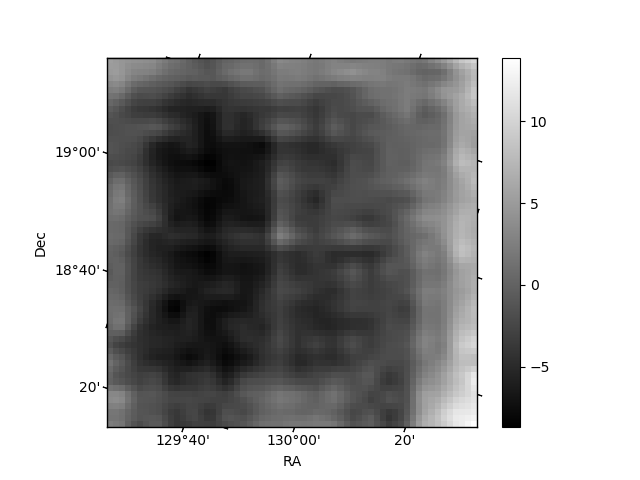
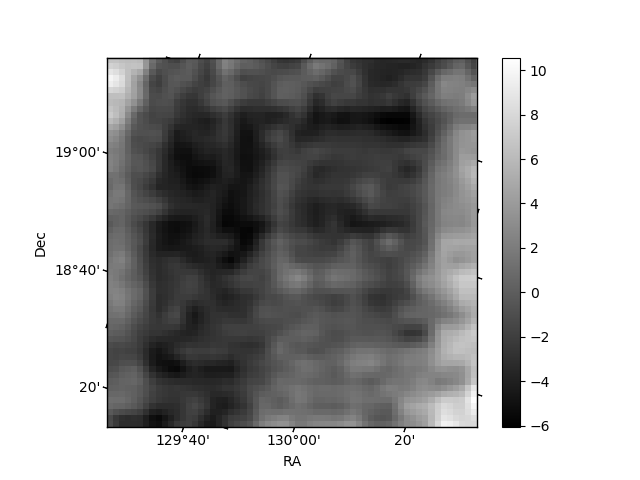
Histogram calculated using DETX and DETY for each event in the final _common_clean file
| Quadrant A | 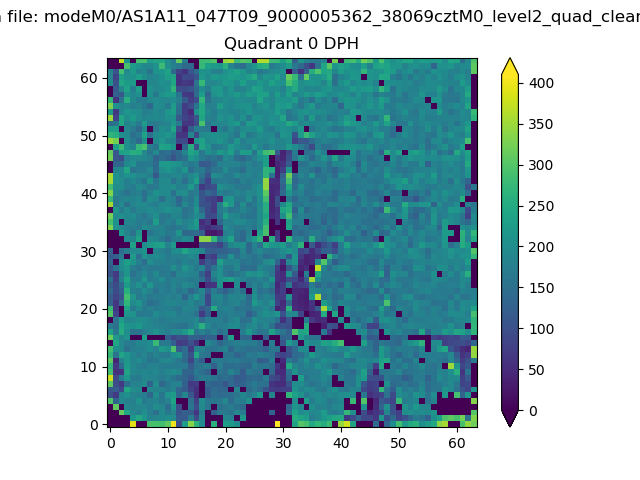 |
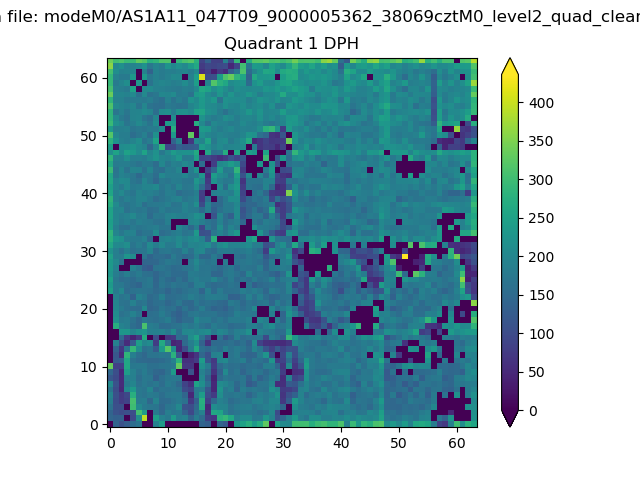 |
Quadrant B |
|---|---|---|---|
| Quadrant D | 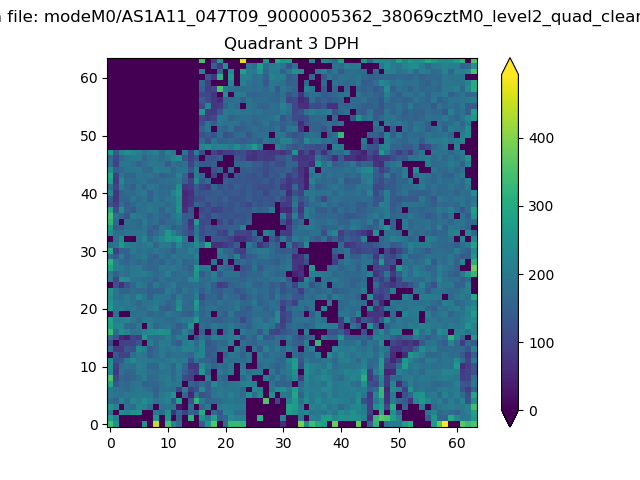 |
 |
Quadrant C |
| Plot type | Count rate plots | Images |
|---|---|---|
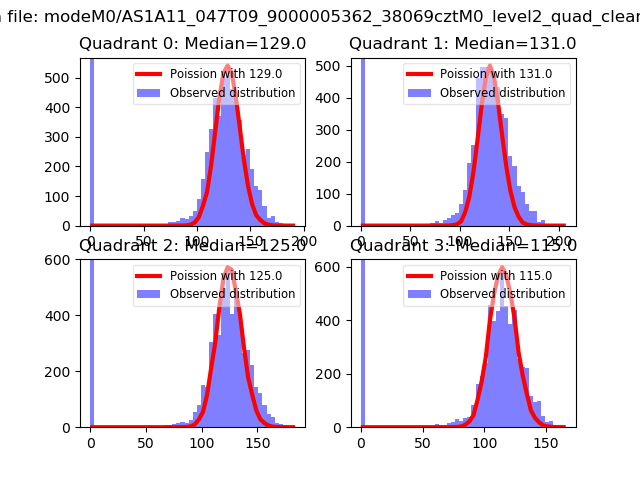
| Comparison with Poisson distribution Blue bars denote a histogram of data divided into 1 sec bins. Red curve is a Poisson curve with rate = median count rate of data. |
 |
 |
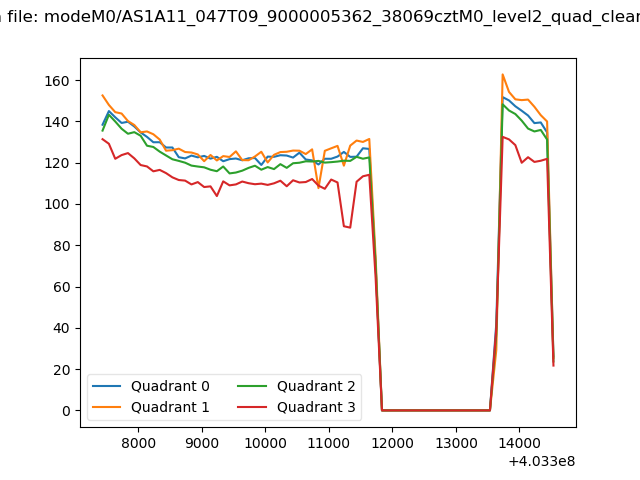
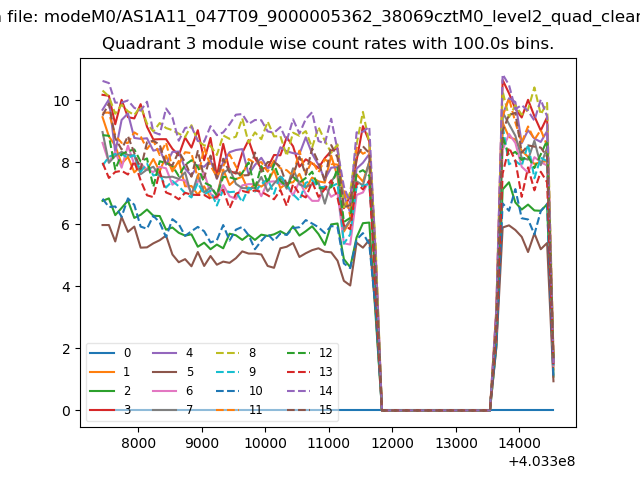
| Quadrant-wise count rates Data is divided into 100 sec bins |
 |
|
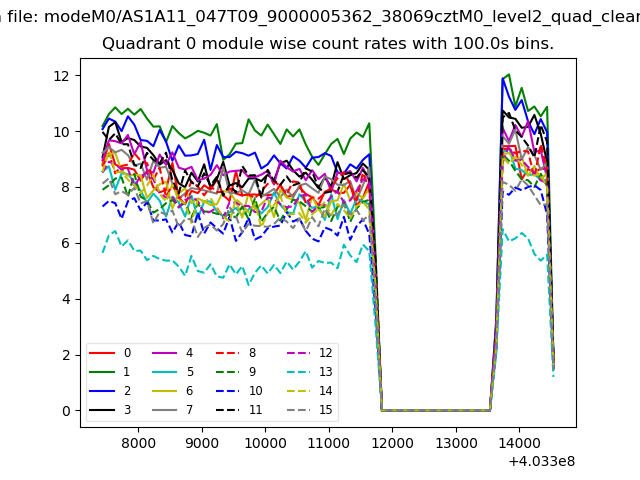
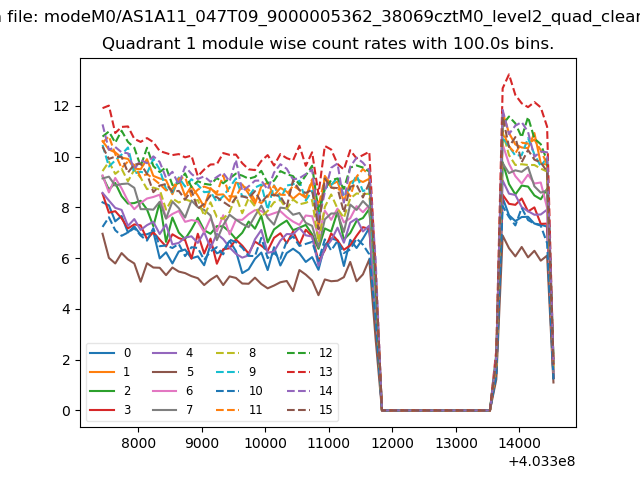
| Module-wise count rates for Quadrant A Data is divided into 100 sec bins |
 |
 |
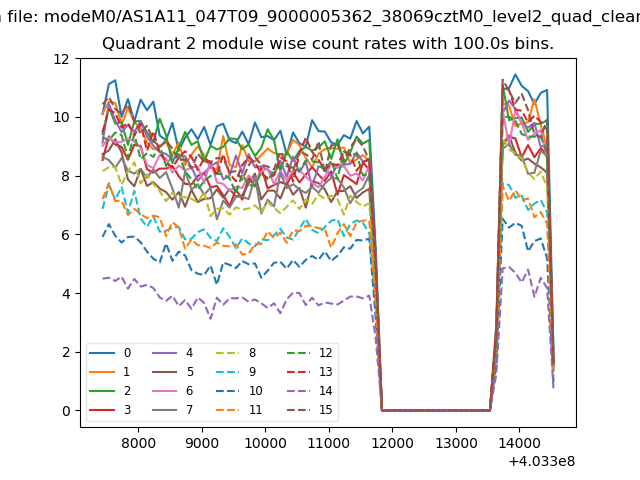
| Module-wise count rates for Quadrant B Data is divided into 100 sec bins |
 |
 |
| Module-wise count rates for Quadrant C Data is divided into 100 sec bins |
 |
 |
| Module-wise count rates for Quadrant D Data is divided into 100 sec bins |
 |
 |
| Parameter | Plot |
|---|---|
| CZT HV Monitor | 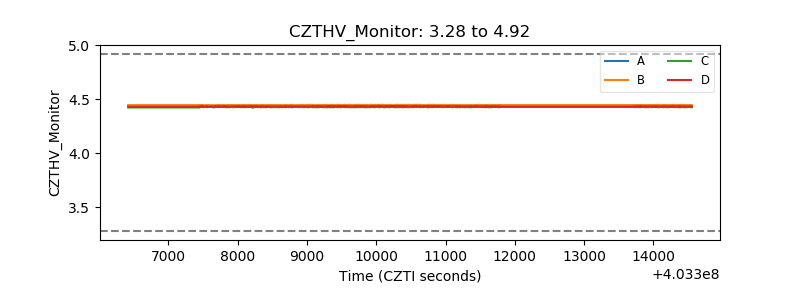 |
| D_VDD | 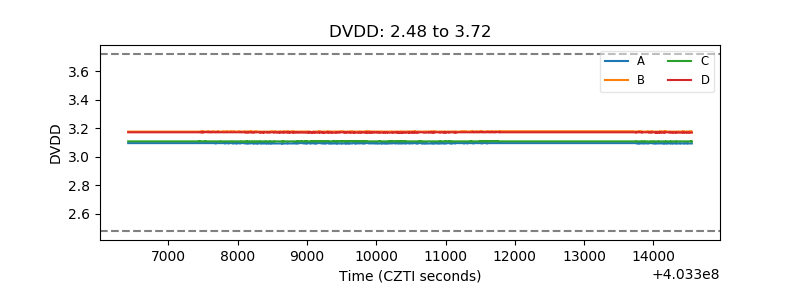 |
| Temperature 1 | 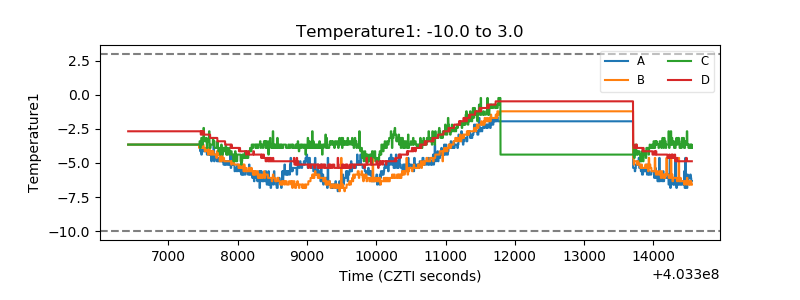 |
| Veto HV Monitor | 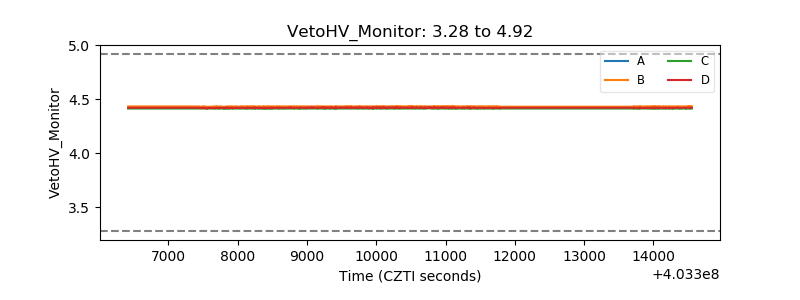 |
| Veto LLD | 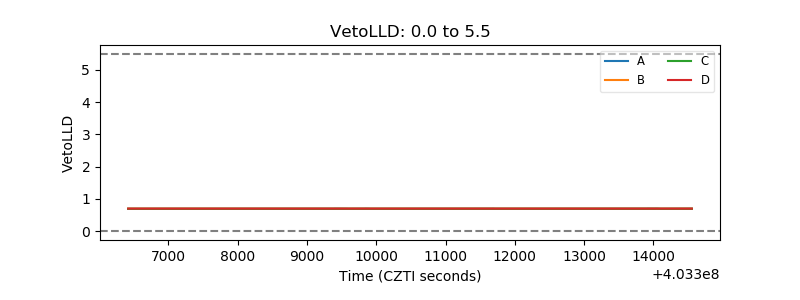 |
| Alpha Counter | 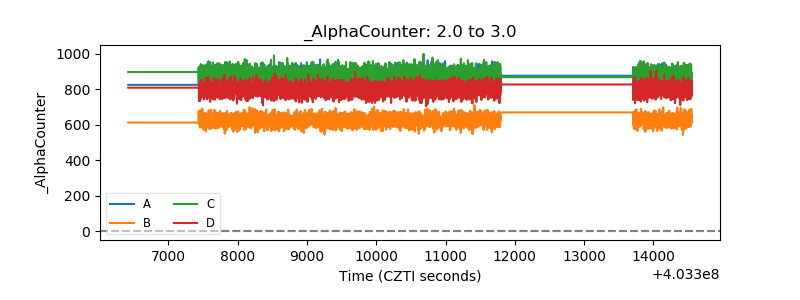 |
| _CPM_Rate | 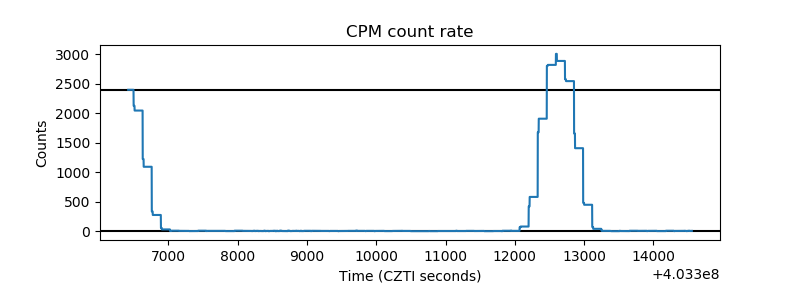 |
| CZT Counter | 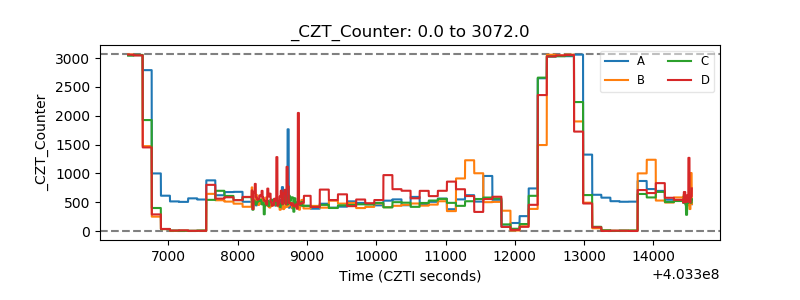 |
| +2.5 Volts monitor |  |
| +5 Volts monitor | 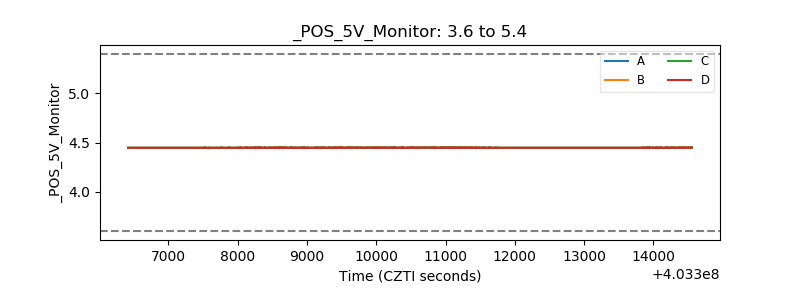 |
| _ROLL_ROT | 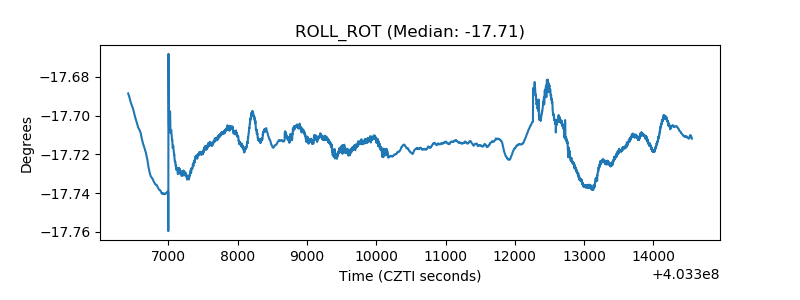 |
| _Roll_DEC | 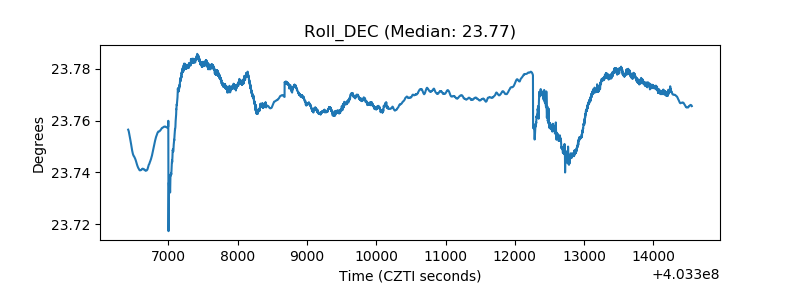 |
| _Roll_RA | 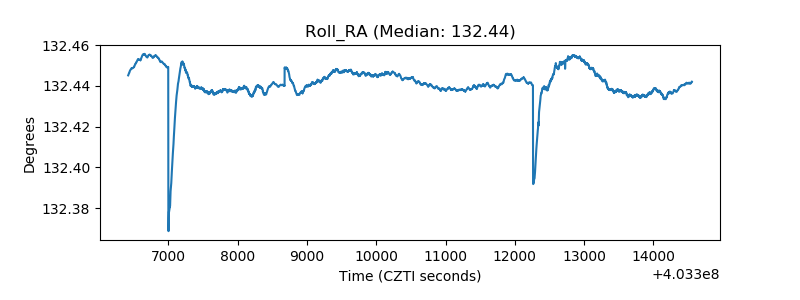 |
| Veto Counter | 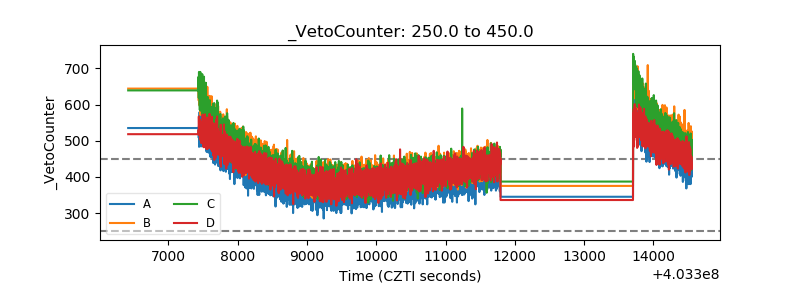 |