| Param | Original file | Final file |
|---|---|---|
| Filename | modeM0/AS1A11_047T09_9000005362_38070cztM0_level2.fits | modeM0/AS1A11_047T09_9000005362_38070cztM0_level2_quad_clean.evt |
| Size (bytes) | 325,177,920 | 97,732,800 |
| Size | 310.1 MB | 93.2 MB |
| Events in quadrant A | 2,852,776 | 673,685 |
| Events in quadrant B | 2,758,151 | 691,607 |
| Events in quadrant C | 2,676,007 | 651,454 |
| Events in quadrant D | 3,353,480 | 585,666 |
| Mode M0 | |||
|---|---|---|---|
| Quadrant | BADHDUFLAG | Total packets | Discarded packets |
| A | 0 | 11532 | 3 |
| B | 0 | 11365 | 2 |
| C | 0 | 10898 | 2 |
| D | 0 | 13397 | 2 |
| Mode SS | |||
|---|---|---|---|
| Quadrant | BADHDUFLAG | Total packets | Discarded packets |
| A | 0 | 106 | 0 |
| B | 0 | 106 | 0 |
| C | 0 | 106 | 0 |
| D | 0 | 106 | 0 |
| Mode M9 | |||
|---|---|---|---|
| Quadrant | BADHDUFLAG | Total packets | Discarded packets |
| A | 0 | 29 | 0 |
| B | 0 | 29 | 0 |
| C | 0 | 29 | 0 |
| D | 0 | 30 | 0 |
| Quadrant | Total seconds | Saturated seconds | Saturation percentage |
|---|---|---|---|
| A | 5093 | 18 | 0.353426% |
| B | 5093 | 36 | 0.706853% |
| C | 5093 | 14 | 0.274887% |
| D | 5093 | 145 | 2.847045% |
Noise dominated data is calculated using 1-second bins in cleaned event files. If a bin has >2000 counts, and if more than 50% of those come from <1% of pixels, then it is considered to be noise-dominated and hence unusable.
| Quadrant | # 1 sec bins | Bins with >0 counts | Bins with >2000 counts | High rate bins dominated by noise | Noise dominated (total time) | Noise dominated (detector-on time) | Marked lightcurve |
|---|---|---|---|---|---|---|---|
| A | 7127 | 5094 | 4 | 4 | 0.06% | 0.08% | 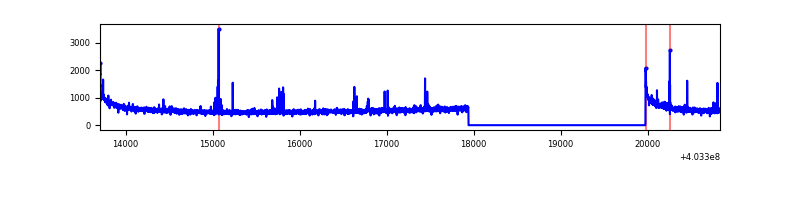 |
| B | 7127 | 5094 | 23 | 23 | 0.32% | 0.45% | 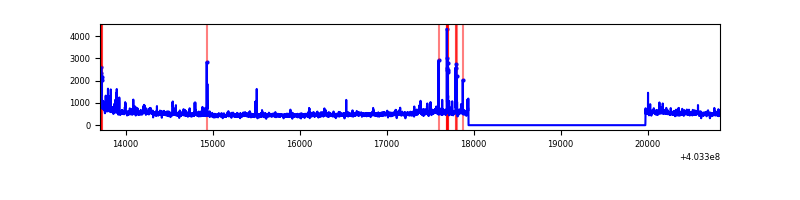 |
| C | 7127 | 5094 | 9 | 9 | 0.13% | 0.18% | 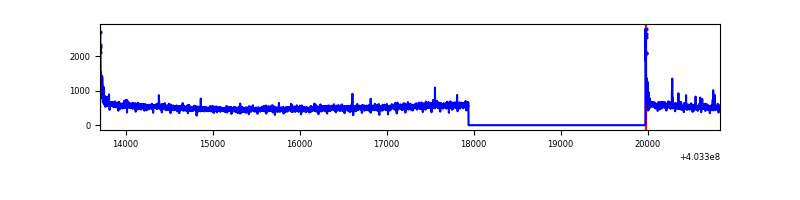 |
| D | 7127 | 5094 | 106 | 106 | 1.49% | 2.08% | 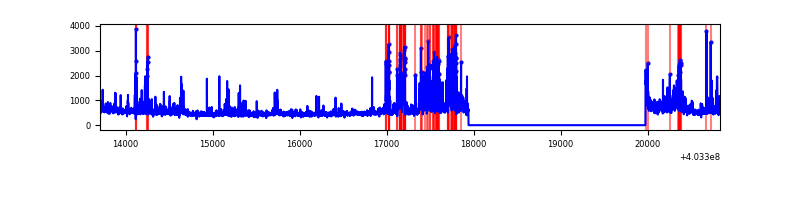 |
Top three noisy pixels from each quadrant. If the there are fewer than three noisy pixels in the level2.evt file, extra rows are filled as -1
| Pixel properties | Quadrant properties | ||||||
|---|---|---|---|---|---|---|---|
| Quadrant | DetID | PixID | Counts | Sigma | Mean | Median | Sigma |
| A | 10 | 83 | 344962 | 2747.59 | 624 | 614 | 125.3 |
| A | 7 | 3 | 59107 | 466.72 | 624 | 614 | 125.3 |
| A | 13 | 6 | 11201 | 84.47 | 624 | 614 | 125.3 |
| B | 4 | 171 | 58328 | 480.78 | 627 | 613 | 120.0 |
| B | 0 | 189 | 52634 | 433.34 | 627 | 613 | 120.0 |
| B | 5 | 184 | 44352 | 364.35 | 627 | 613 | 120.0 |
| C | 15 | 214 | 212625 | 1494.16 | 609 | 615 | 141.9 |
| C | 0 | 10 | 50256 | 349.85 | 609 | 615 | 141.9 |
| C | 1 | 23 | 15345 | 103.81 | 609 | 615 | 141.9 |
| D | 5 | 222 | 192201 | 1322.8 | 595 | 580 | 144.9 |
| D | 12 | 227 | 188685 | 1298.52 | 595 | 580 | 144.9 |
| D | 13 | 249 | 138233 | 950.24 | 595 | 580 | 144.9 |
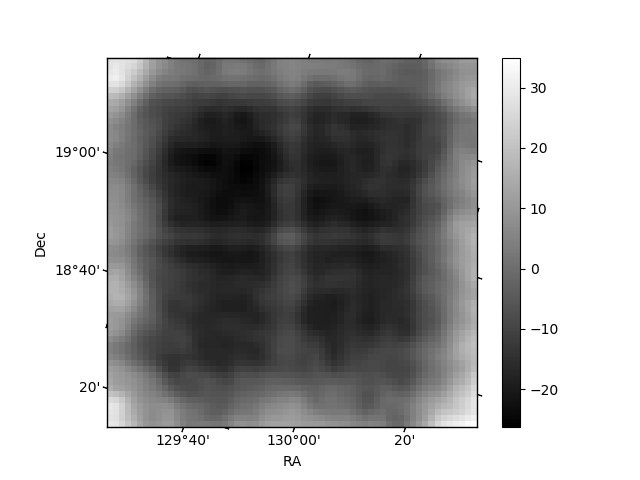
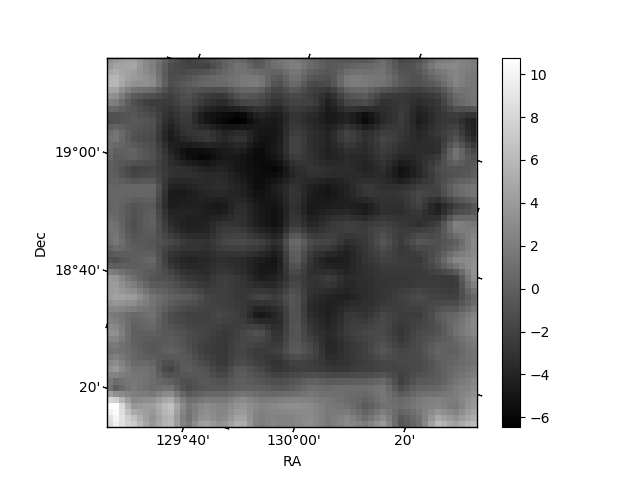
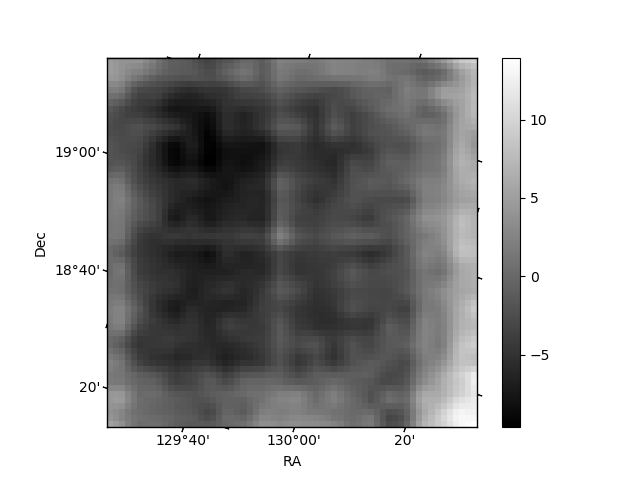
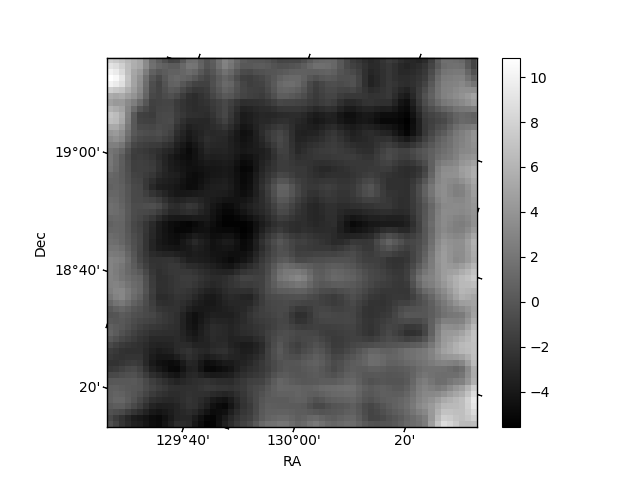
Histogram calculated using DETX and DETY for each event in the final _common_clean file
| Quadrant A | 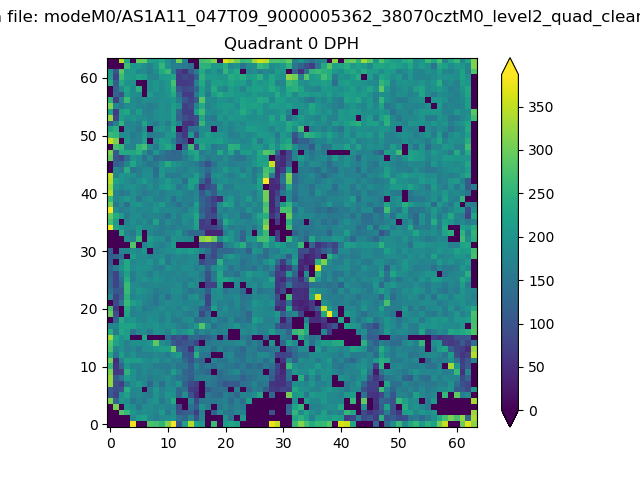 |
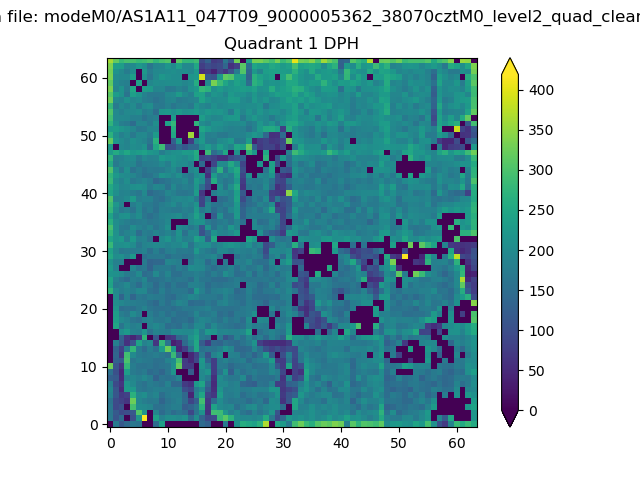 |
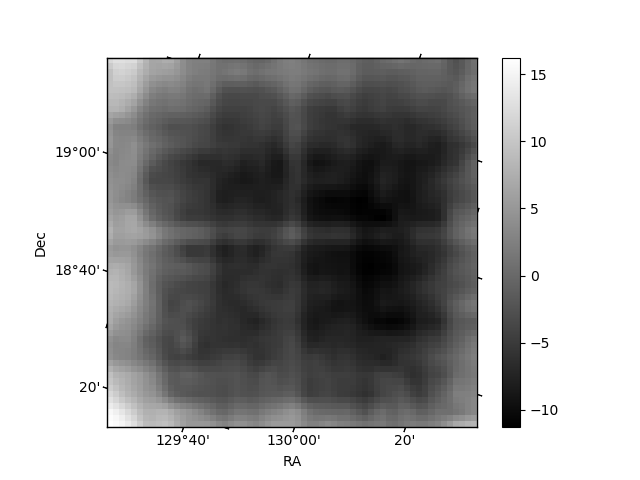
Quadrant B |
|---|---|---|---|
| Quadrant D | 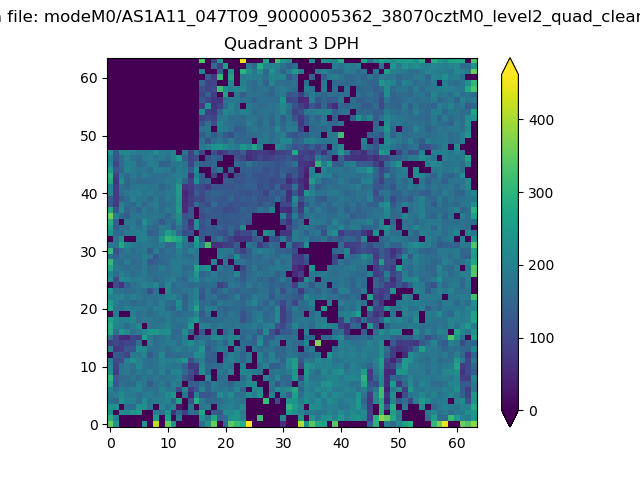 |
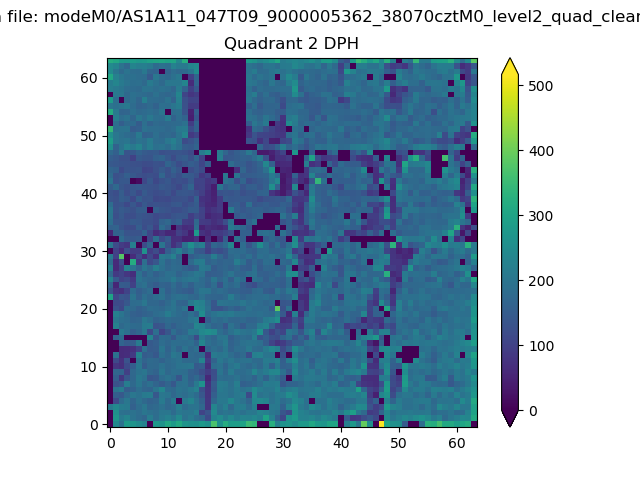 |
Quadrant C |
| Plot type | Count rate plots | Images |
|---|---|---|
| Comparison with Poisson distribution Blue bars denote a histogram of data divided into 1 sec bins. Red curve is a Poisson curve with rate = median count rate of data. |
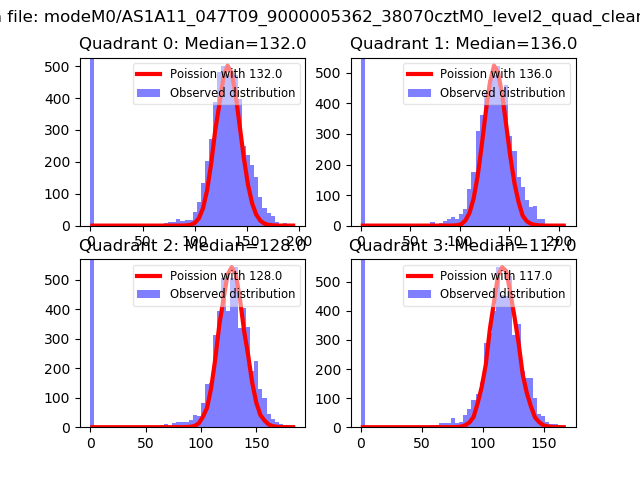 |
 |
| Quadrant-wise count rates Data is divided into 100 sec bins |
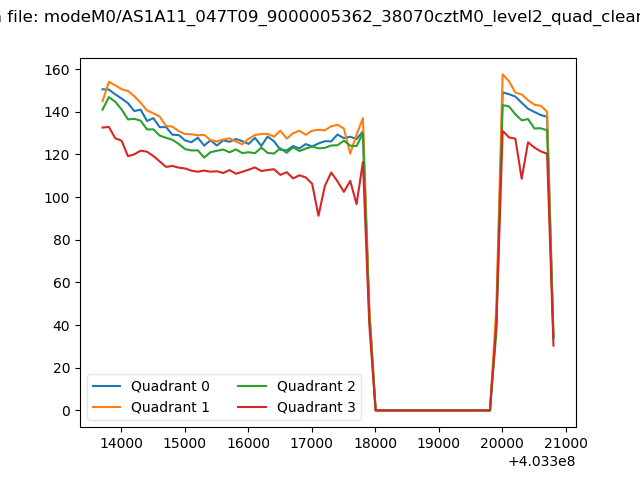 |
|
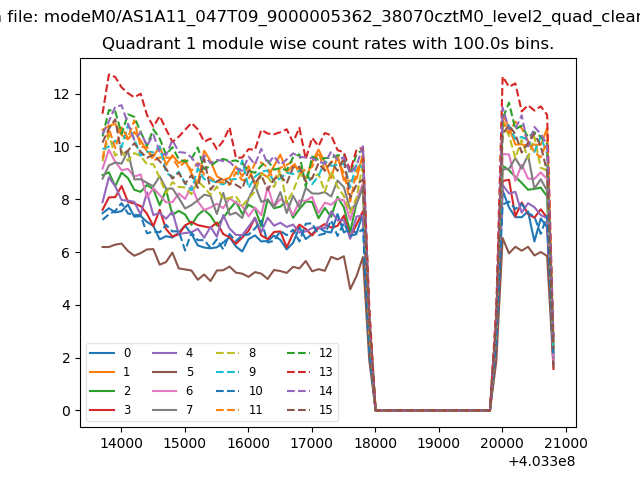
| Module-wise count rates for Quadrant A Data is divided into 100 sec bins |
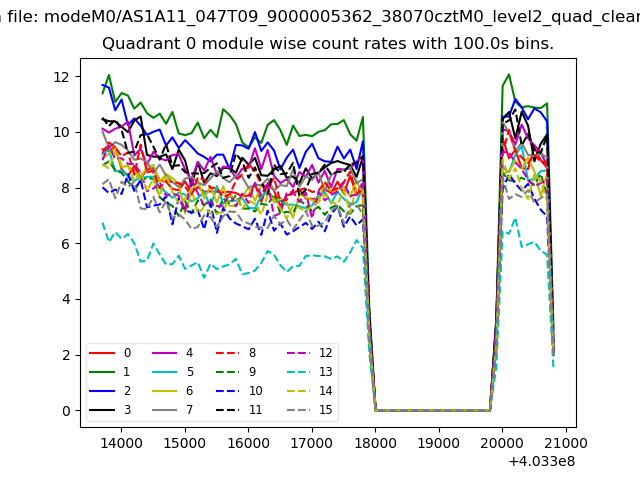 |
 |
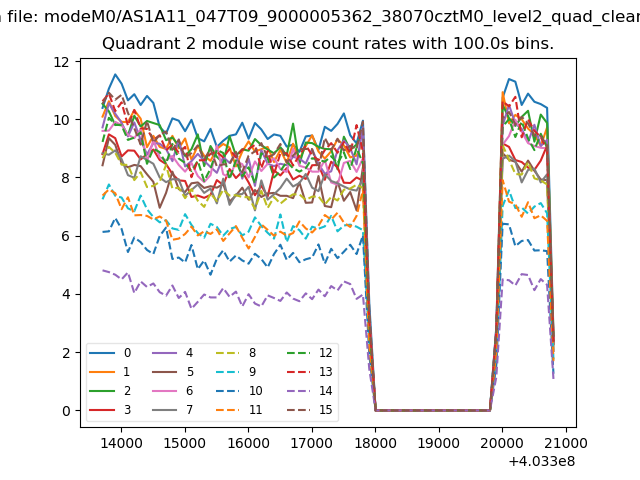
| Module-wise count rates for Quadrant B Data is divided into 100 sec bins |
 |
 |
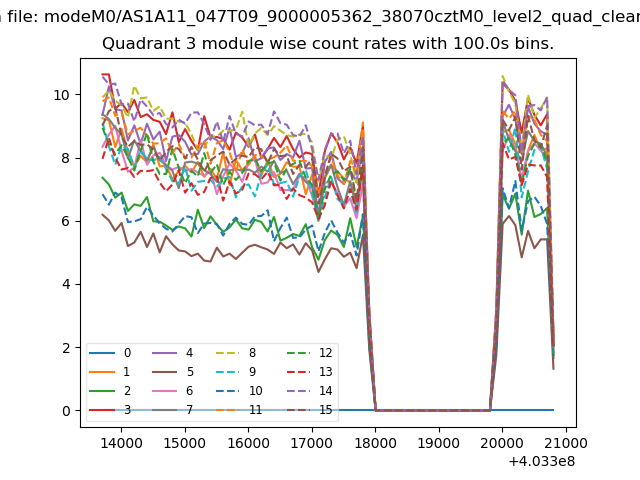
| Module-wise count rates for Quadrant C Data is divided into 100 sec bins |
 |
 |
| Module-wise count rates for Quadrant D Data is divided into 100 sec bins |
 |
 |
| Parameter | Plot |
|---|---|
| CZT HV Monitor | 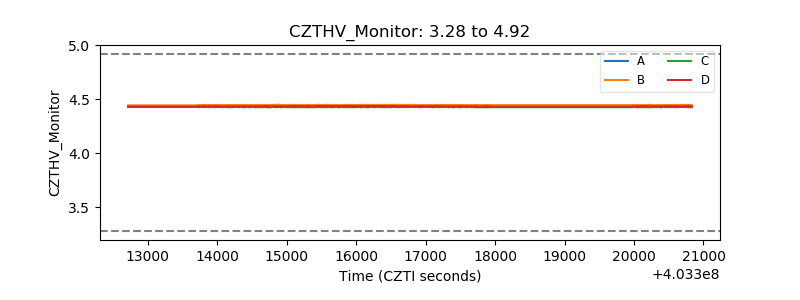 |
| D_VDD | 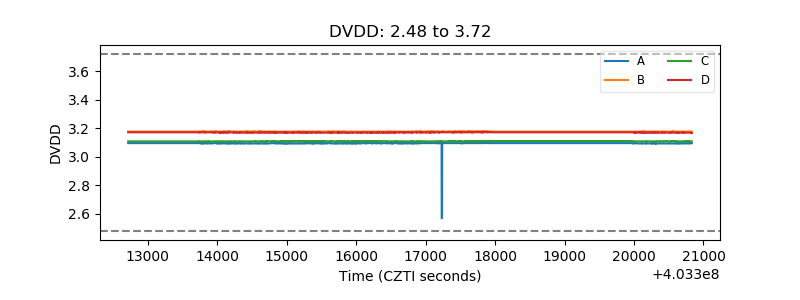 |
| Temperature 1 | 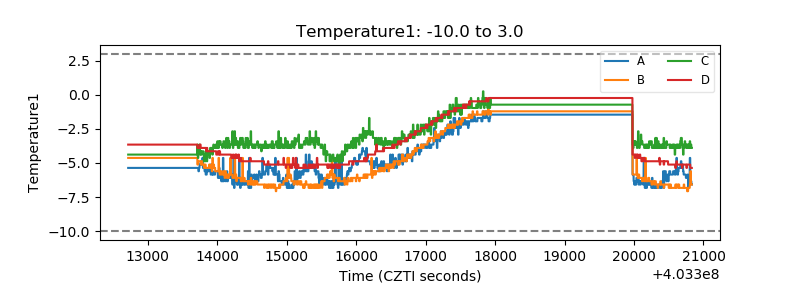 |
| Veto HV Monitor | 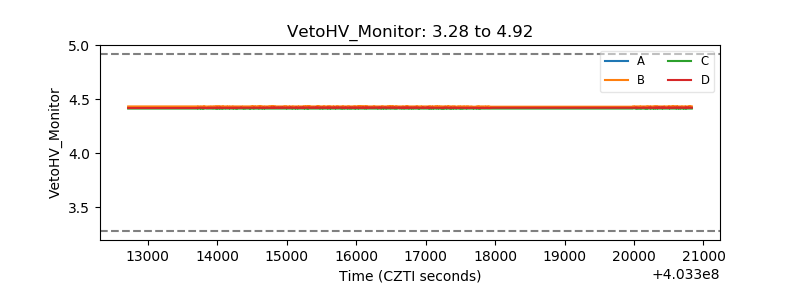 |
| Veto LLD | 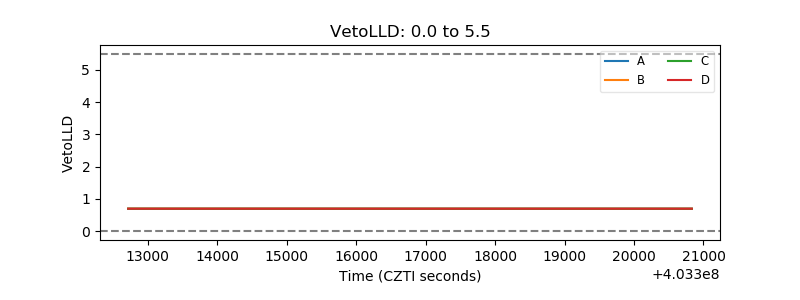 |
| Alpha Counter | 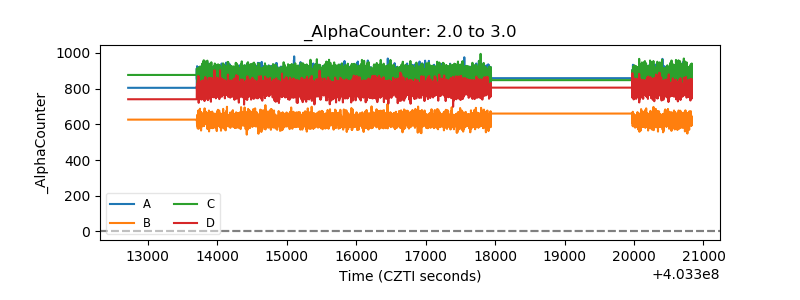 |
| _CPM_Rate | 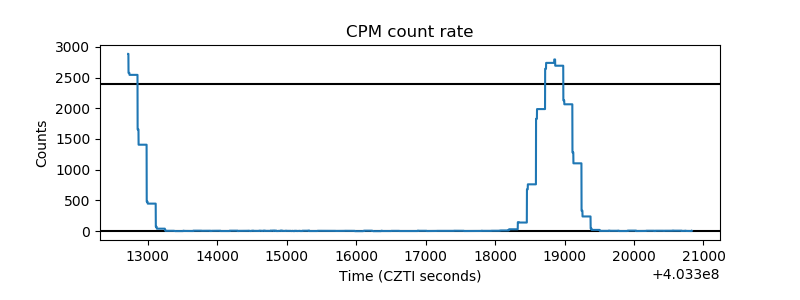 |
| CZT Counter | 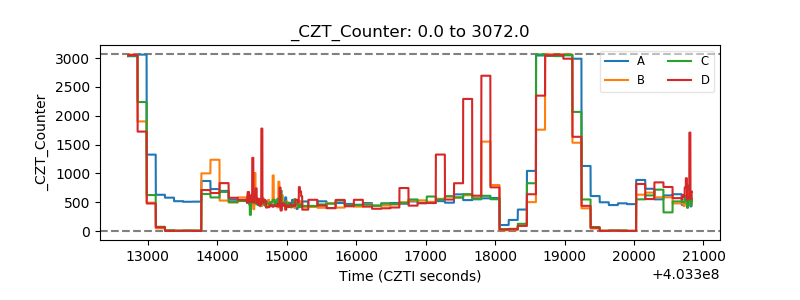 |
| +2.5 Volts monitor | 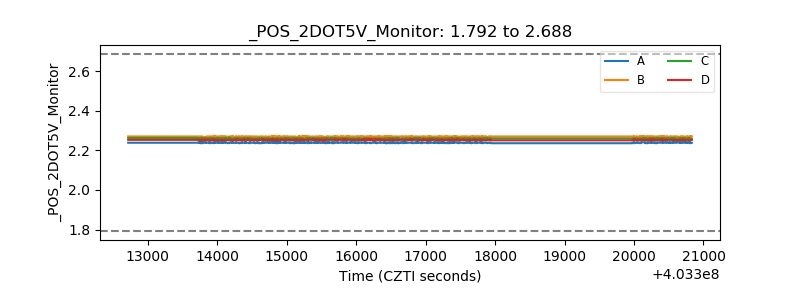 |
| +5 Volts monitor | 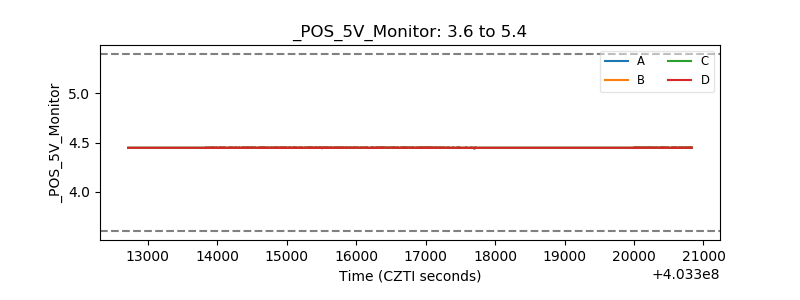 |
| _ROLL_ROT | 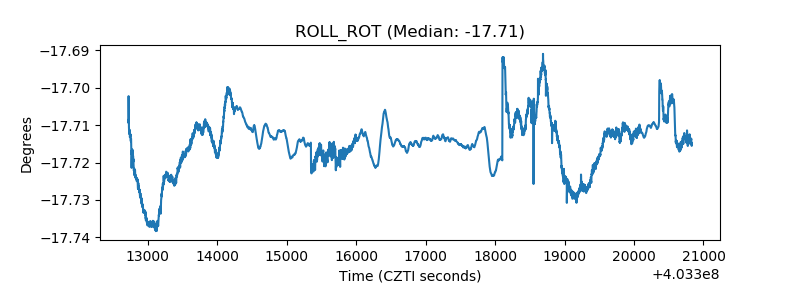 |
| _Roll_DEC | 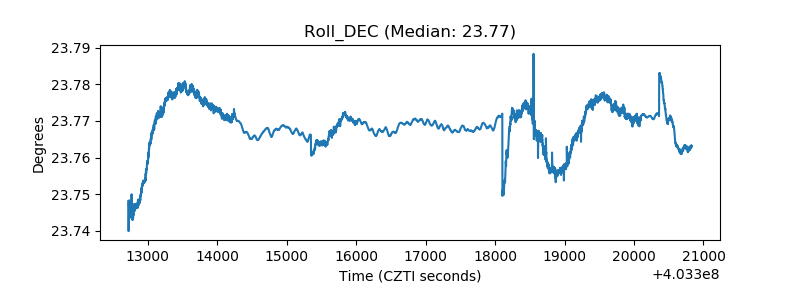 |
| _Roll_RA | 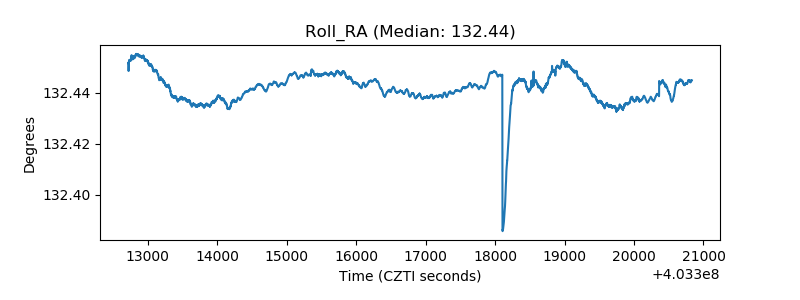 |
| Veto Counter | 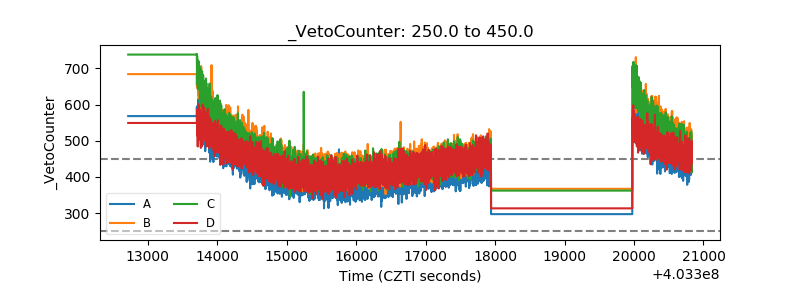 |