| Param | Original file | Final file |
|---|---|---|
| Filename | modeM0/AS1A11_047T09_9000005362_38071cztM0_level2.fits | modeM0/AS1A11_047T09_9000005362_38071cztM0_level2_quad_clean.evt |
| Size (bytes) | 389,810,880 | 99,089,280 |
| Size | 371.8 MB | 94.5 MB |
| Events in quadrant A | 2,953,987 | 690,791 |
| Events in quadrant B | 2,702,882 | 712,830 |
| Events in quadrant C | 2,780,045 | 665,888 |
| Events in quadrant D | 5,581,992 | 561,400 |
| Mode M0 | |||
|---|---|---|---|
| Quadrant | BADHDUFLAG | Total packets | Discarded packets |
| A | 0 | 11988 | 3 |
| B | 0 | 11267 | 2 |
| C | 0 | 11284 | 2 |
| D | 0 | 20190 | 2 |
| Mode SS | |||
|---|---|---|---|
| Quadrant | BADHDUFLAG | Total packets | Discarded packets |
| A | 0 | 108 | 0 |
| B | 0 | 108 | 0 |
| C | 0 | 108 | 0 |
| D | 0 | 108 | 0 |
| Mode M9 | |||
|---|---|---|---|
| Quadrant | BADHDUFLAG | Total packets | Discarded packets |
| A | 0 | 34 | 0 |
| B | 0 | 34 | 0 |
| C | 0 | 34 | 0 |
| D | 0 | 35 | 0 |
| Quadrant | Total seconds | Saturated seconds | Saturation percentage |
|---|---|---|---|
| A | 5282 | 16 | 0.302916% |
| B | 5282 | 17 | 0.321848% |
| C | 5282 | 18 | 0.340780% |
| D | 5282 | 627 | 11.870504% |
Noise dominated data is calculated using 1-second bins in cleaned event files. If a bin has >2000 counts, and if more than 50% of those come from <1% of pixels, then it is considered to be noise-dominated and hence unusable.
| Quadrant | # 1 sec bins | Bins with >0 counts | Bins with >2000 counts | High rate bins dominated by noise | Noise dominated (total time) | Noise dominated (detector-on time) | Marked lightcurve |
|---|---|---|---|---|---|---|---|
| A | 7405 | 5283 | 7 | 7 | 0.09% | 0.13% | 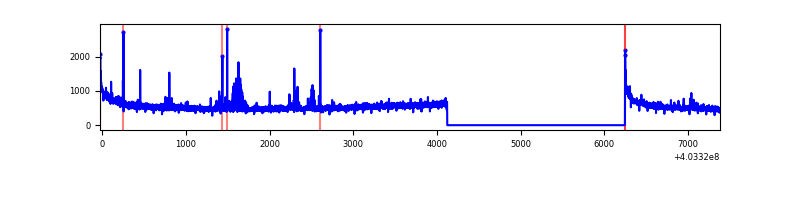 |
| B | 7405 | 5283 | 5 | 5 | 0.07% | 0.09% | 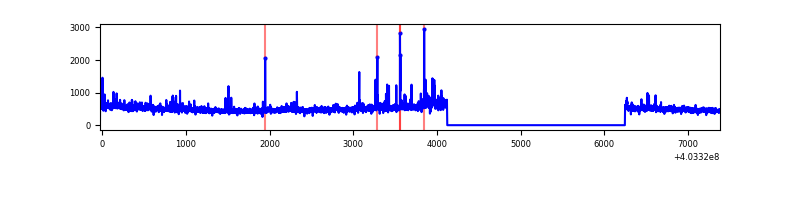 |
| C | 7405 | 5283 | 11 | 11 | 0.15% | 0.21% | 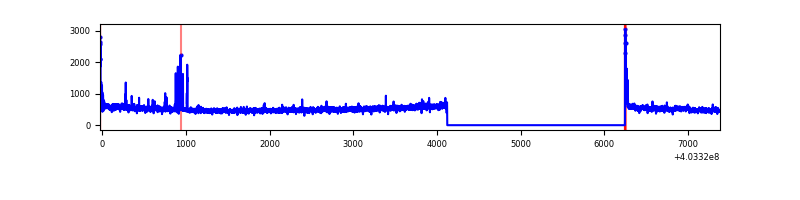 |
| D | 7405 | 5283 | 657 | 657 | 8.87% | 12.44% | 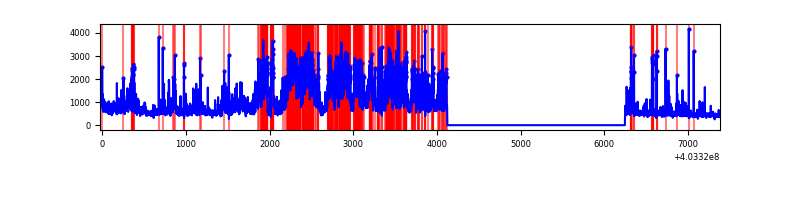 |
Top three noisy pixels from each quadrant. If the there are fewer than three noisy pixels in the level2.evt file, extra rows are filled as -1
| Pixel properties | Quadrant properties | ||||||
|---|---|---|---|---|---|---|---|
| Quadrant | DetID | PixID | Counts | Sigma | Mean | Median | Sigma |
| A | 10 | 83 | 353988 | 2757.97 | 639 | 629 | 128.1 |
| A | 7 | 3 | 81933 | 634.58 | 639 | 629 | 128.1 |
| A | 12 | 227 | 17670 | 133.01 | 639 | 629 | 128.1 |
| B | 0 | 229 | 56530 | 459.0 | 643 | 629 | 121.8 |
| B | 4 | 171 | 34762 | 280.27 | 643 | 629 | 121.8 |
| B | 0 | 189 | 25927 | 207.72 | 643 | 629 | 121.8 |
| C | 15 | 214 | 219612 | 1491.63 | 623 | 628 | 146.8 |
| C | 0 | 10 | 54928 | 369.87 | 623 | 628 | 146.8 |
| C | 1 | 23 | 49352 | 331.89 | 623 | 628 | 146.8 |
| D | 12 | 227 | 2589497 | 17915.42 | 592 | 577 | 144.5 |
| D | 13 | 249 | 327649 | 2263.35 | 592 | 577 | 144.5 |
| D | 5 | 222 | 156283 | 1077.49 | 592 | 577 | 144.5 |
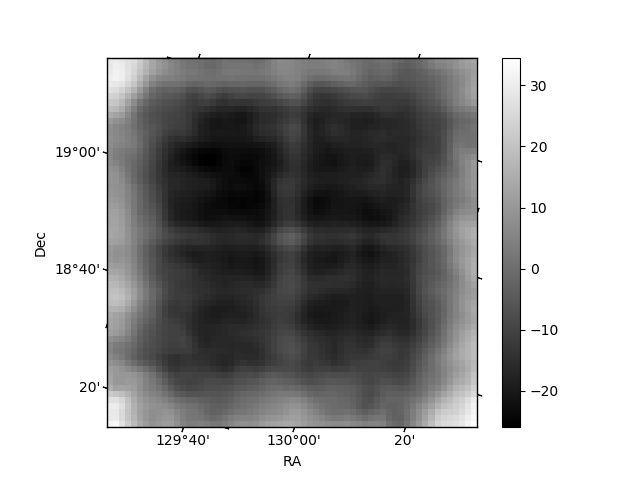
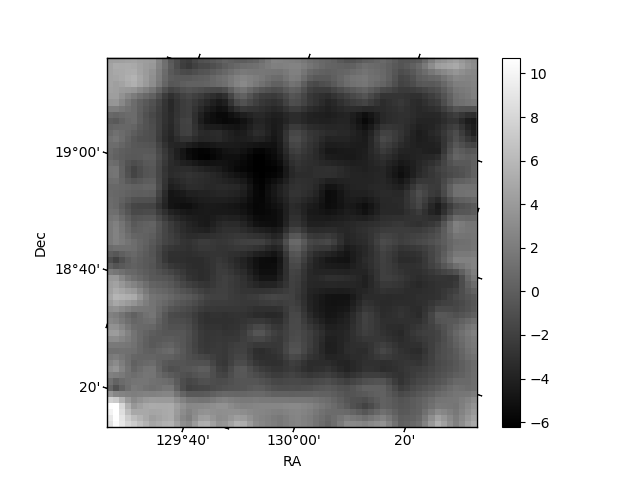
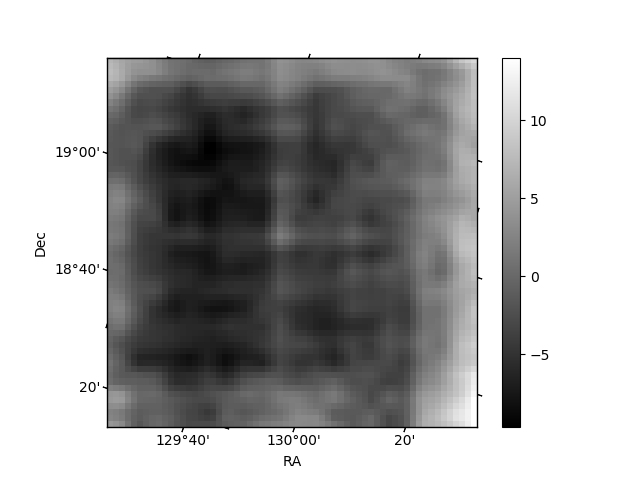
Histogram calculated using DETX and DETY for each event in the final _common_clean file
| Quadrant A | 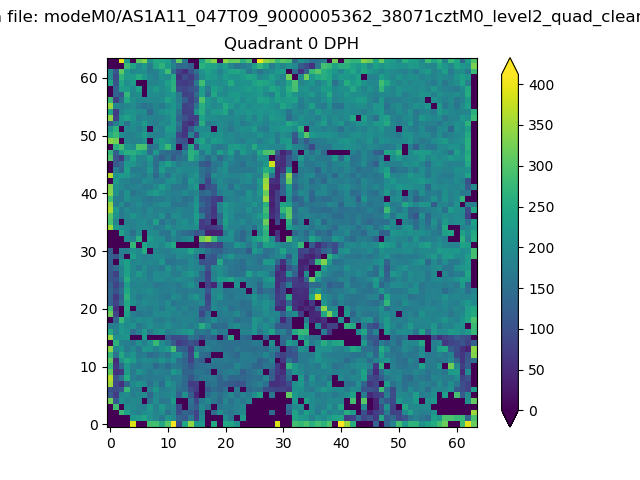 |
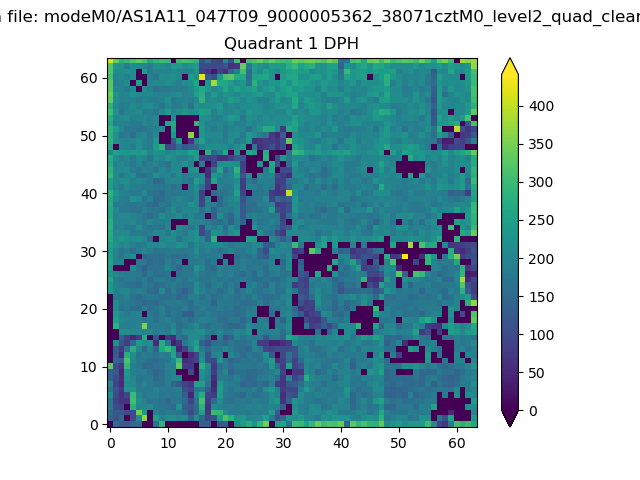 |
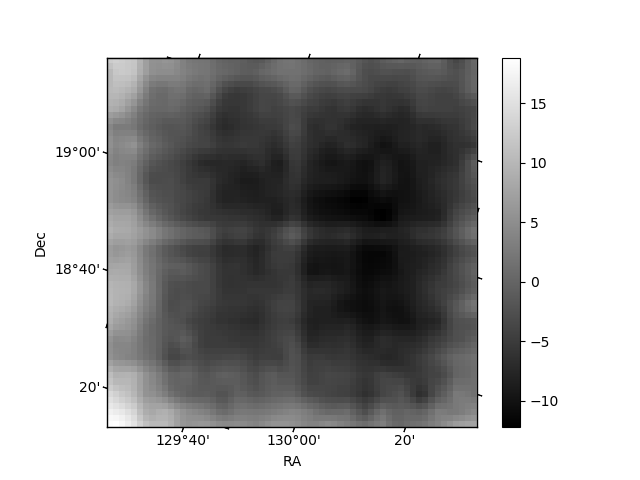
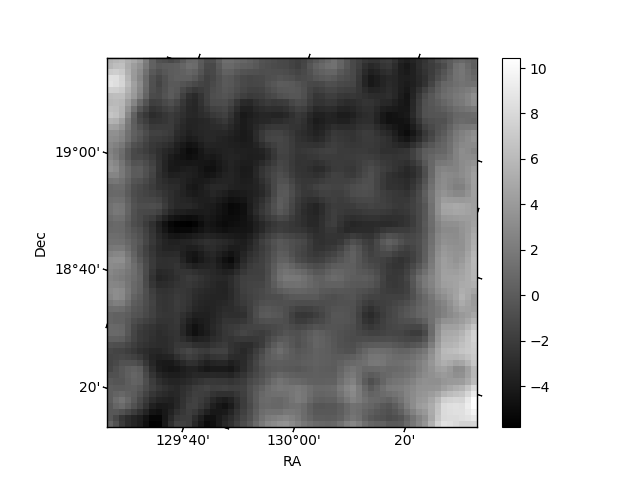
Quadrant B |
|---|---|---|---|
| Quadrant D | 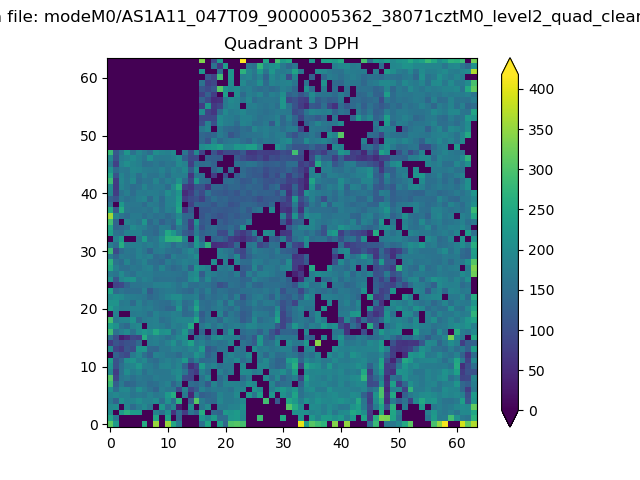 |
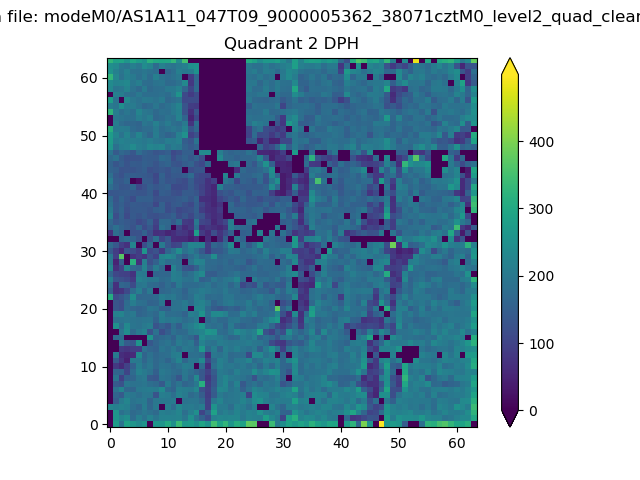 |
Quadrant C |
| Plot type | Count rate plots | Images |
|---|---|---|
| Comparison with Poisson distribution Blue bars denote a histogram of data divided into 1 sec bins. Red curve is a Poisson curve with rate = median count rate of data. |
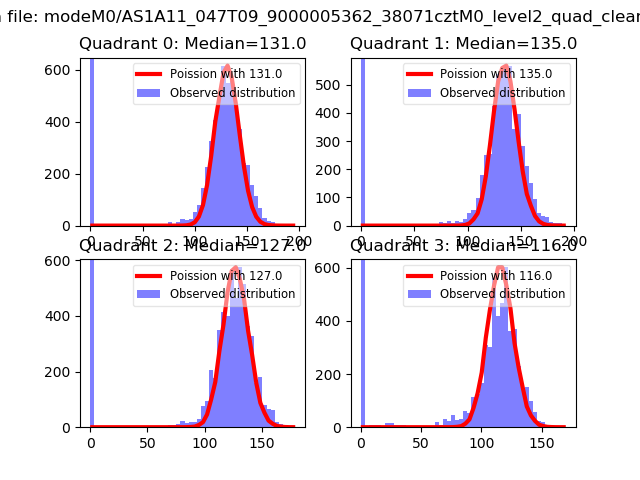 |
 |
| Quadrant-wise count rates Data is divided into 100 sec bins |
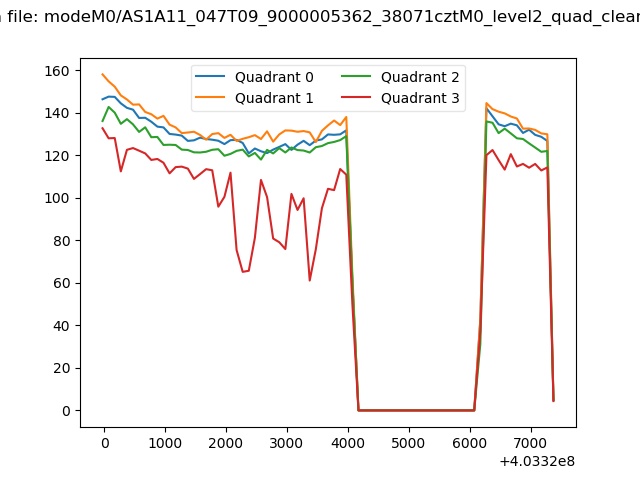 |
|
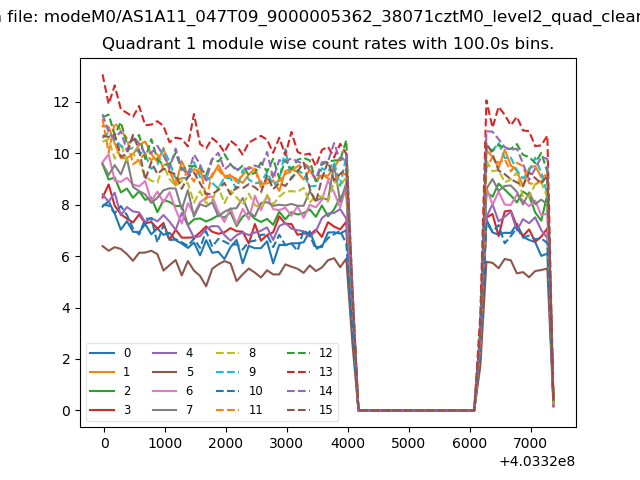
| Module-wise count rates for Quadrant A Data is divided into 100 sec bins |
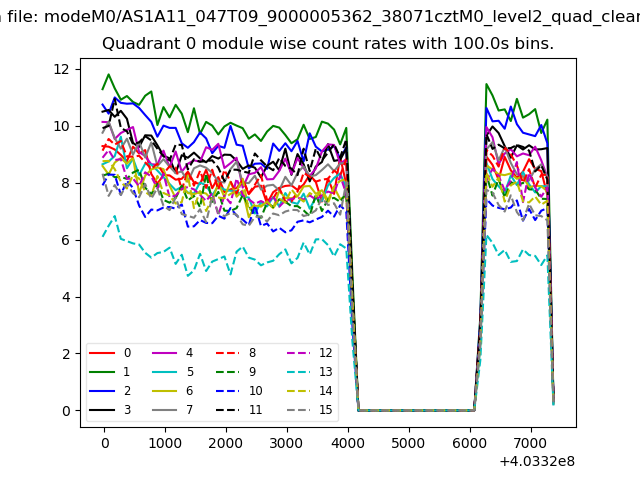 |
 |
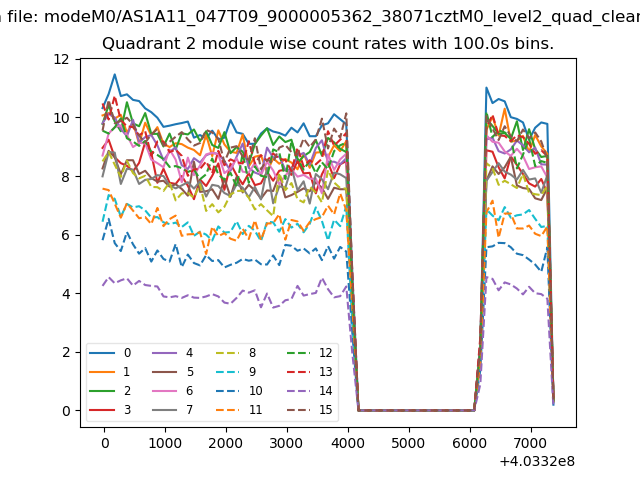
| Module-wise count rates for Quadrant B Data is divided into 100 sec bins |
 |
 |
| Module-wise count rates for Quadrant C Data is divided into 100 sec bins |
 |
 |
| Module-wise count rates for Quadrant D Data is divided into 100 sec bins |
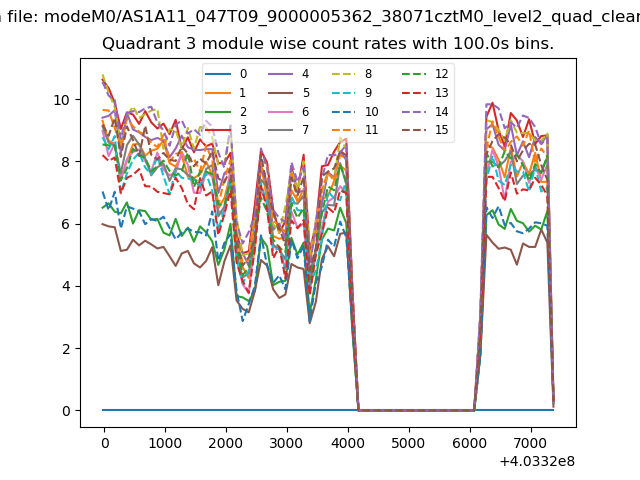 |
 |
| Parameter | Plot |
|---|---|
| CZT HV Monitor | 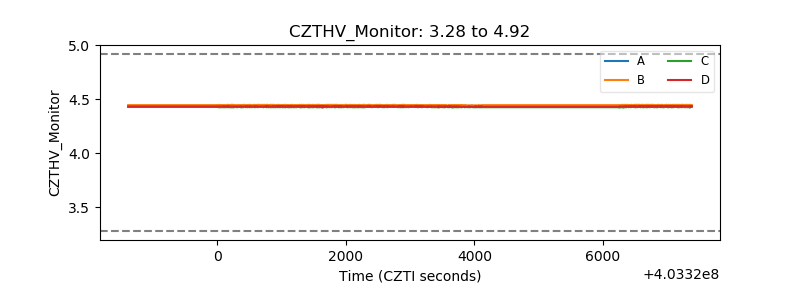 |
| D_VDD | 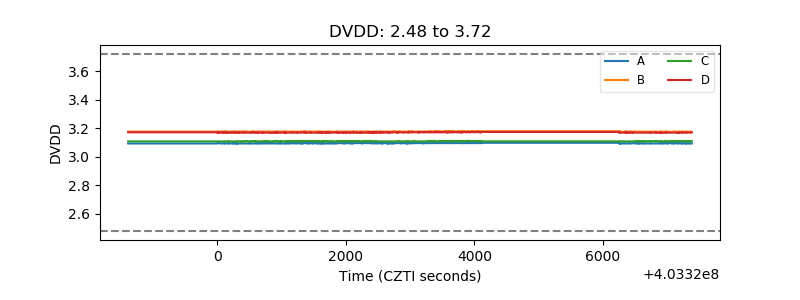 |
| Temperature 1 | 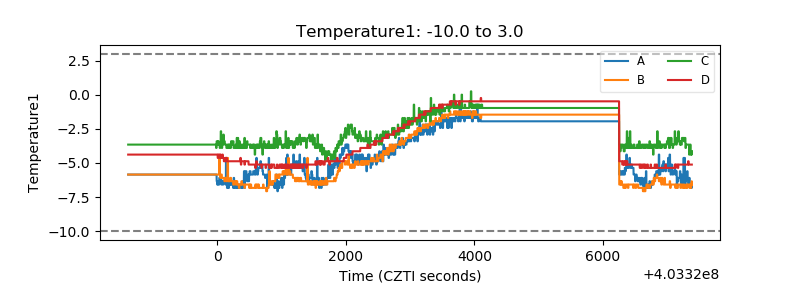 |
| Veto HV Monitor | 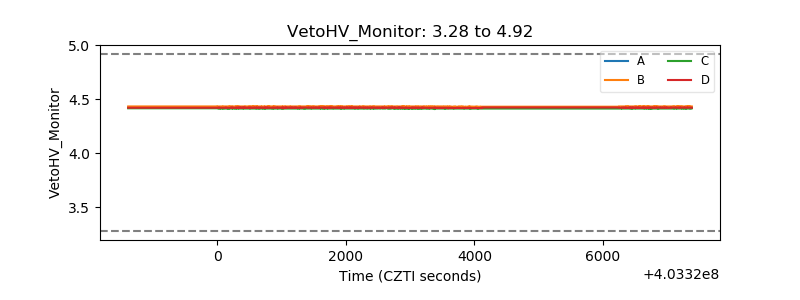 |
| Veto LLD | 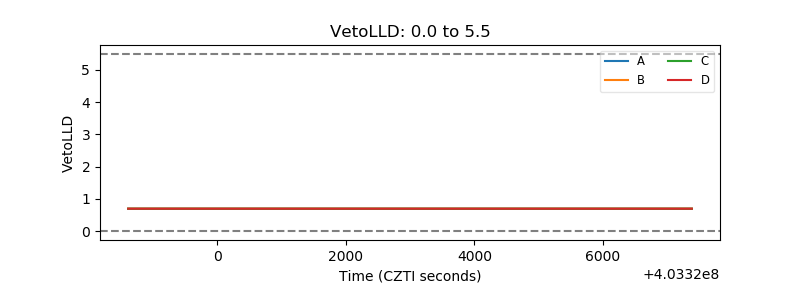 |
| Alpha Counter | 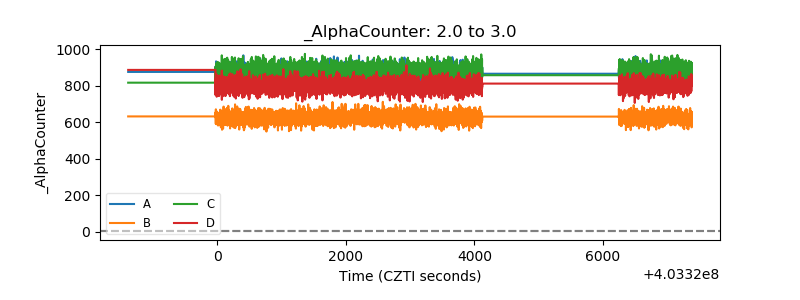 |
| _CPM_Rate | 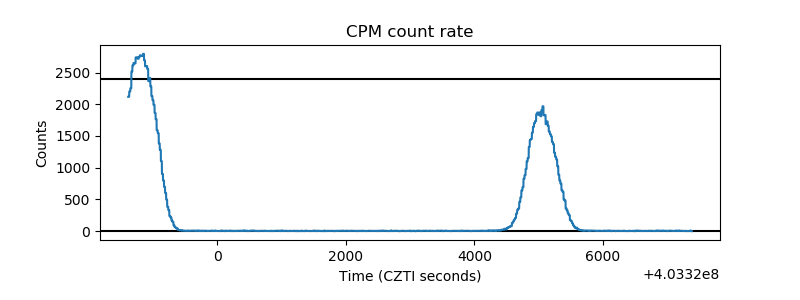 |
| CZT Counter | 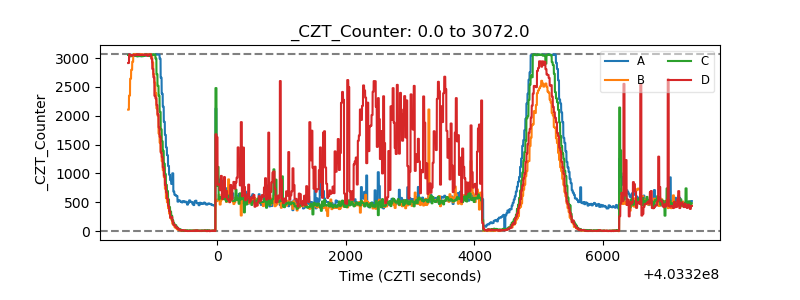 |
| +2.5 Volts monitor | 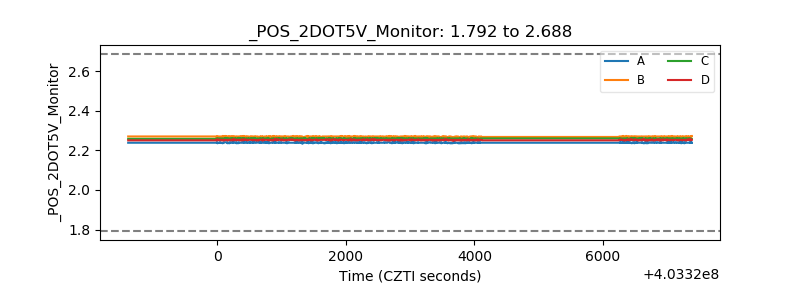 |
| +5 Volts monitor | 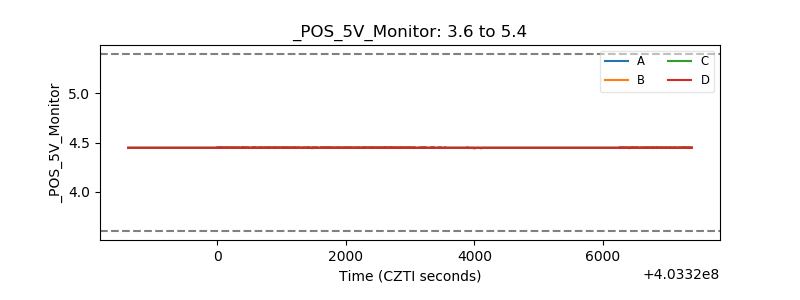 |
| _ROLL_ROT | 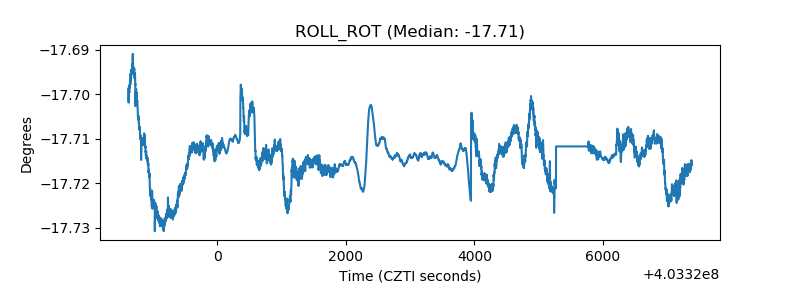 |
| _Roll_DEC | 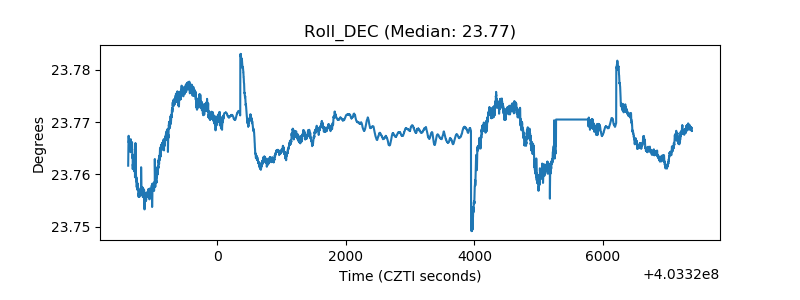 |
| _Roll_RA | 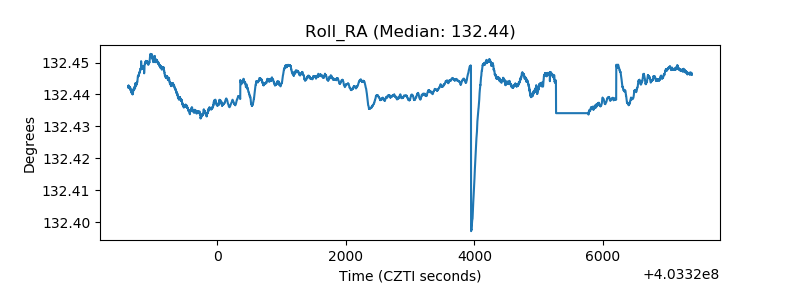 |
| Veto Counter | 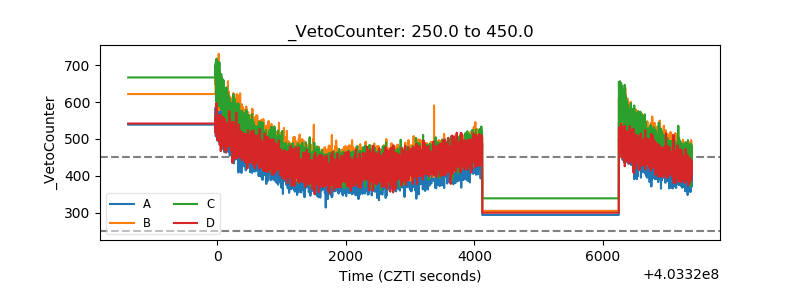 |