| Param | Original file | Final file |
|---|---|---|
| Filename | modeM0/AS1A11_047T09_9000005362_38072cztM0_level2.fits | modeM0/AS1A11_047T09_9000005362_38072cztM0_level2_quad_clean.evt |
| Size (bytes) | 317,001,600 | 96,845,760 |
| Size | 302.3 MB | 92.4 MB |
| Events in quadrant A | 2,800,756 | 661,418 |
| Events in quadrant B | 2,677,920 | 680,448 |
| Events in quadrant C | 2,706,926 | 640,001 |
| Events in quadrant D | 3,139,229 | 582,647 |
| Mode M0 | |||
|---|---|---|---|
| Quadrant | BADHDUFLAG | Total packets | Discarded packets |
| A | 0 | 11475 | 3 |
| B | 0 | 11314 | 2 |
| C | 0 | 11070 | 2 |
| D | 0 | 12902 | 2 |
| Mode SS | |||
|---|---|---|---|
| Quadrant | BADHDUFLAG | Total packets | Discarded packets |
| A | 0 | 108 | 0 |
| B | 0 | 108 | 0 |
| C | 0 | 108 | 0 |
| D | 0 | 108 | 0 |
| Mode M9 | |||
|---|---|---|---|
| Quadrant | BADHDUFLAG | Total packets | Discarded packets |
| A | 0 | 25 | 0 |
| B | 0 | 25 | 0 |
| C | 0 | 25 | 0 |
| D | 0 | 26 | 0 |
| Quadrant | Total seconds | Saturated seconds | Saturation percentage |
|---|---|---|---|
| A | 5255 | 7 | 0.133206% |
| B | 5255 | 24 | 0.456708% |
| C | 5255 | 15 | 0.285442% |
| D | 5255 | 98 | 1.864891% |
Noise dominated data is calculated using 1-second bins in cleaned event files. If a bin has >2000 counts, and if more than 50% of those come from <1% of pixels, then it is considered to be noise-dominated and hence unusable.
| Quadrant | # 1 sec bins | Bins with >0 counts | Bins with >2000 counts | High rate bins dominated by noise | Noise dominated (total time) | Noise dominated (detector-on time) | Marked lightcurve |
|---|---|---|---|---|---|---|---|
| A | 7378 | 5256 | 3 | 3 | 0.04% | 0.06% | 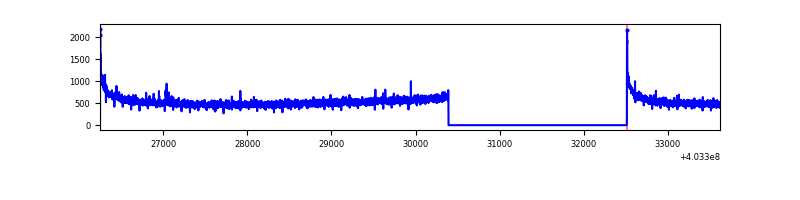 |
| B | 7378 | 5256 | 16 | 16 | 0.22% | 0.30% | 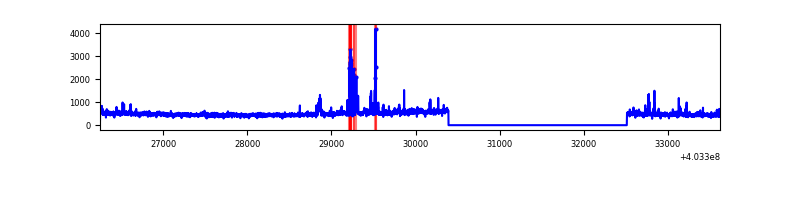 |
| C | 7378 | 5256 | 8 | 8 | 0.11% | 0.15% | 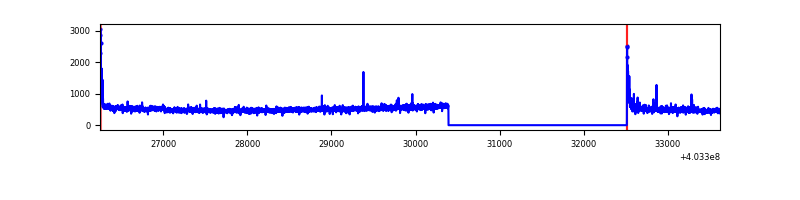 |
| D | 7378 | 5256 | 75 | 75 | 1.02% | 1.43% | 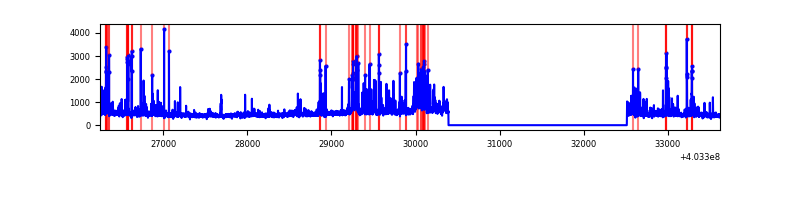 |
Top three noisy pixels from each quadrant. If the there are fewer than three noisy pixels in the level2.evt file, extra rows are filled as -1
| Pixel properties | Quadrant properties | ||||||
|---|---|---|---|---|---|---|---|
| Quadrant | DetID | PixID | Counts | Sigma | Mean | Median | Sigma |
| A | 10 | 83 | 353816 | 2818.56 | 625 | 614 | 125.3 |
| A | 10 | 248 | 7344 | 53.71 | 625 | 614 | 125.3 |
| A | 13 | 6 | 7250 | 52.96 | 625 | 614 | 125.3 |
| B | 5 | 172 | 72597 | 607.23 | 624 | 610 | 118.5 |
| B | 4 | 171 | 46063 | 383.41 | 624 | 610 | 118.5 |
| B | 0 | 229 | 23265 | 191.1 | 624 | 610 | 118.5 |
| C | 15 | 214 | 218156 | 1533.34 | 607 | 613 | 141.9 |
| C | 0 | 10 | 62359 | 435.21 | 607 | 613 | 141.9 |
| C | 14 | 67 | 28582 | 197.14 | 607 | 613 | 141.9 |
| D | 13 | 249 | 227646 | 1553.58 | 600 | 585 | 146.2 |
| D | 1 | 52 | 195305 | 1332.3 | 600 | 585 | 146.2 |
| D | 12 | 233 | 120274 | 818.93 | 600 | 585 | 146.2 |
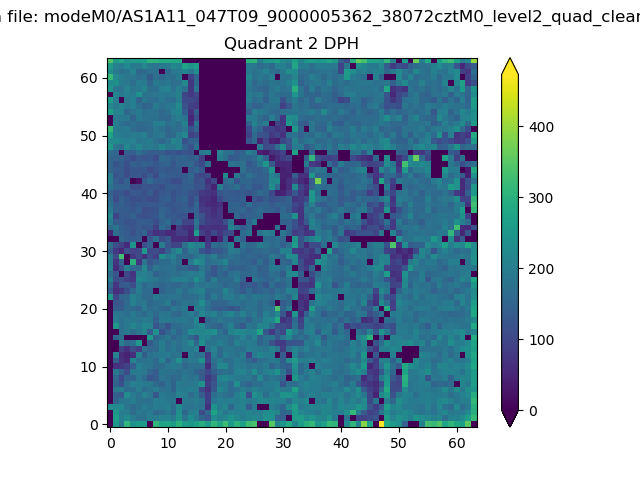
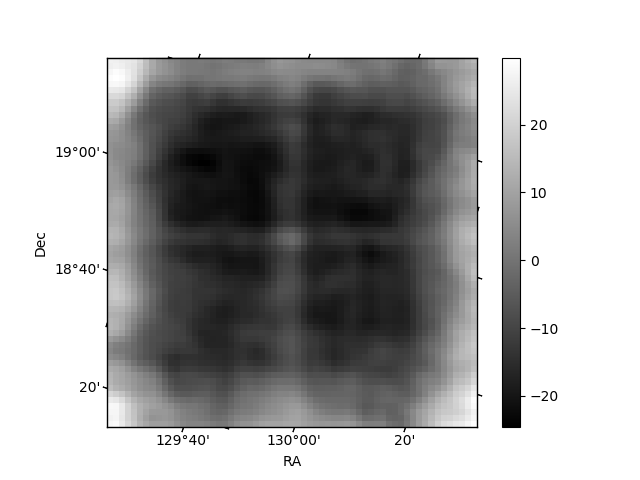
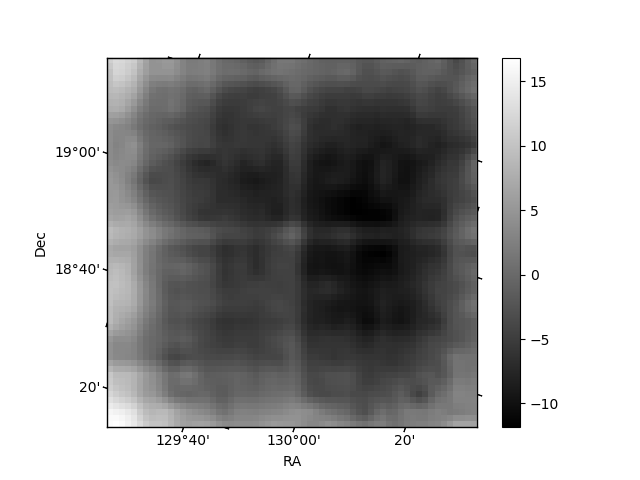
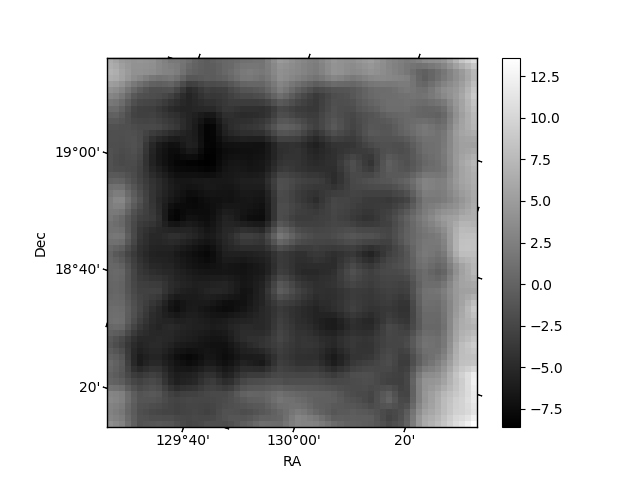
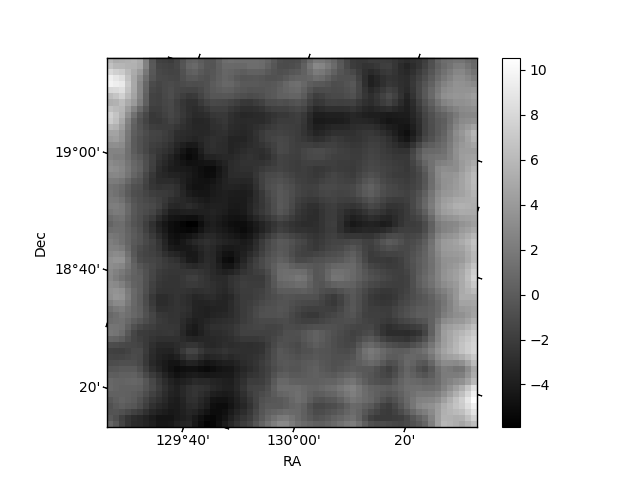
Histogram calculated using DETX and DETY for each event in the final _common_clean file
| Quadrant A | 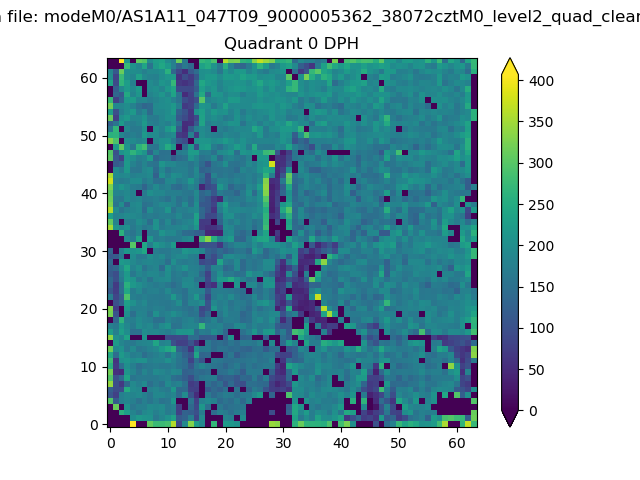 |
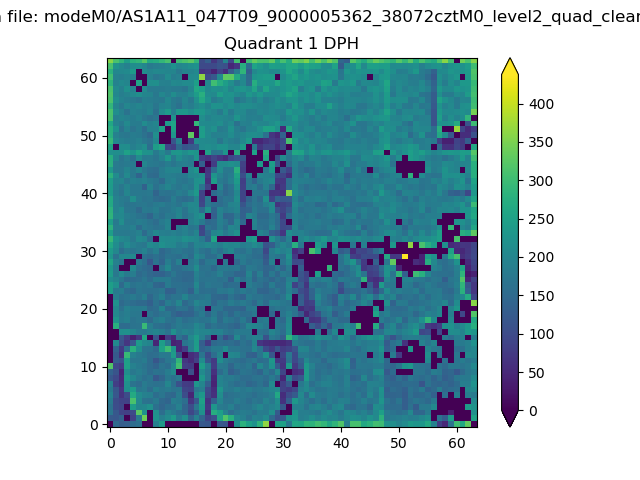 |
Quadrant B |
|---|---|---|---|
| Quadrant D | 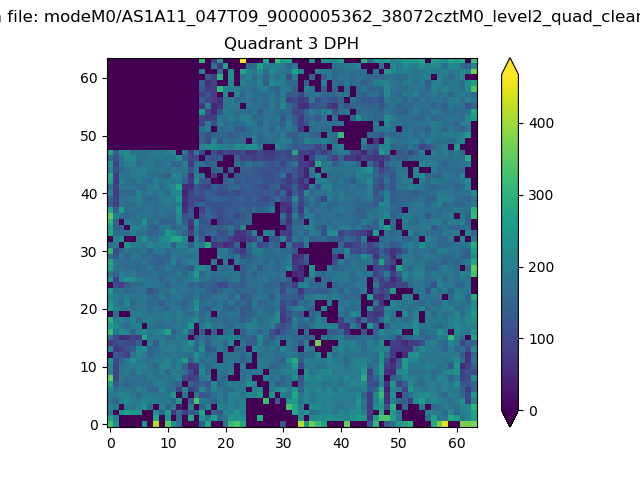 |
 |
Quadrant C |
| Plot type | Count rate plots | Images |
|---|---|---|
| Comparison with Poisson distribution Blue bars denote a histogram of data divided into 1 sec bins. Red curve is a Poisson curve with rate = median count rate of data. |
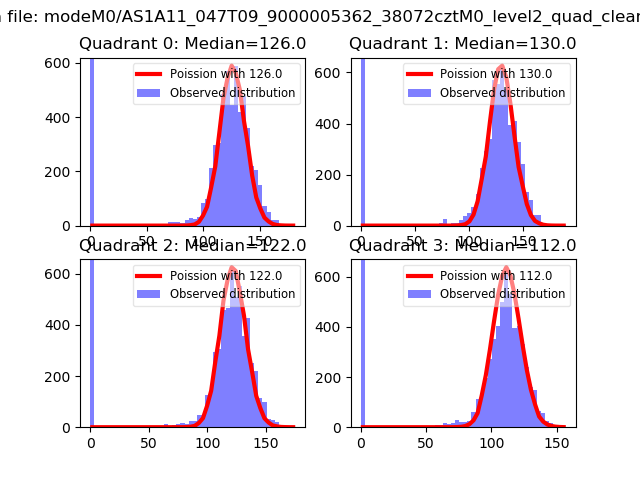 |
 |
| Quadrant-wise count rates Data is divided into 100 sec bins |
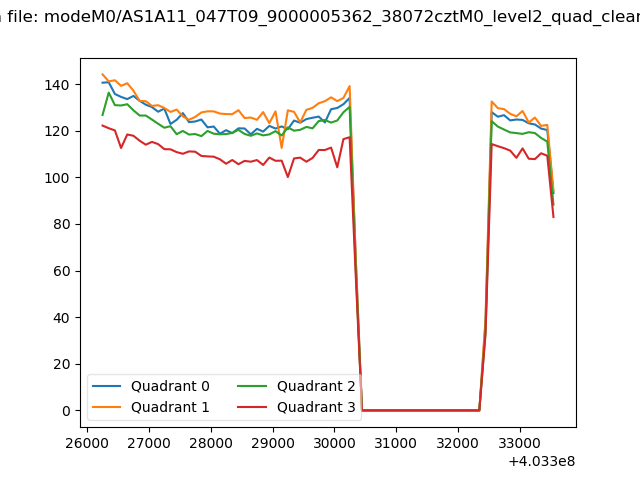 |
|
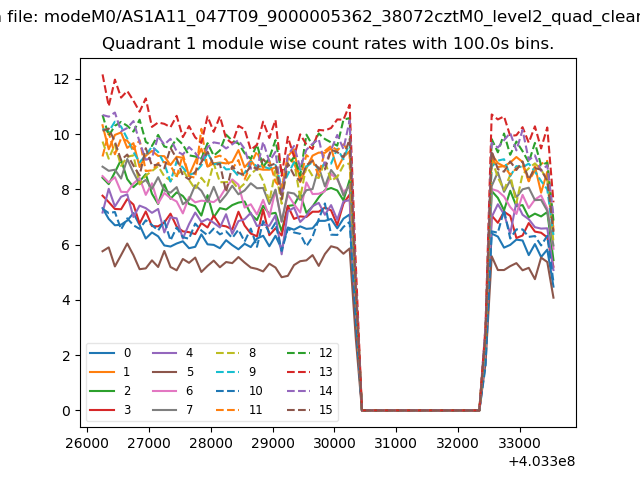
| Module-wise count rates for Quadrant A Data is divided into 100 sec bins |
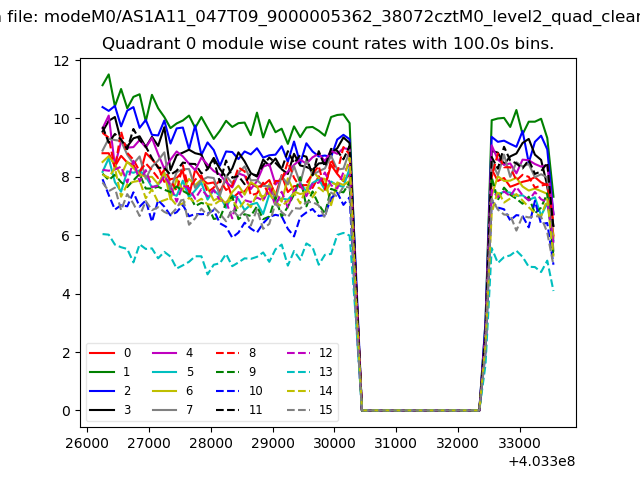 |
 |
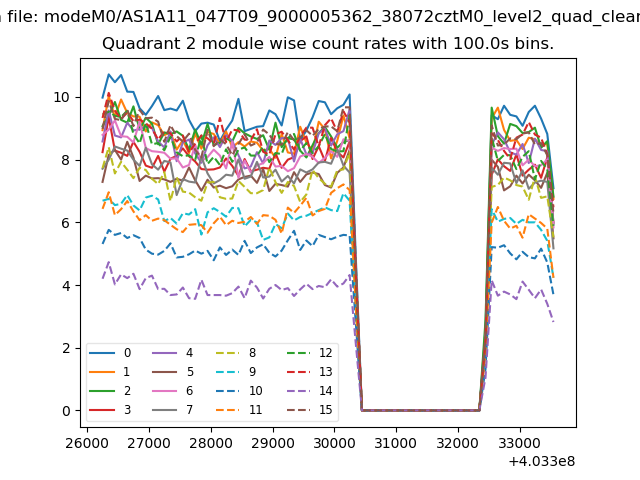
| Module-wise count rates for Quadrant B Data is divided into 100 sec bins |
 |
 |
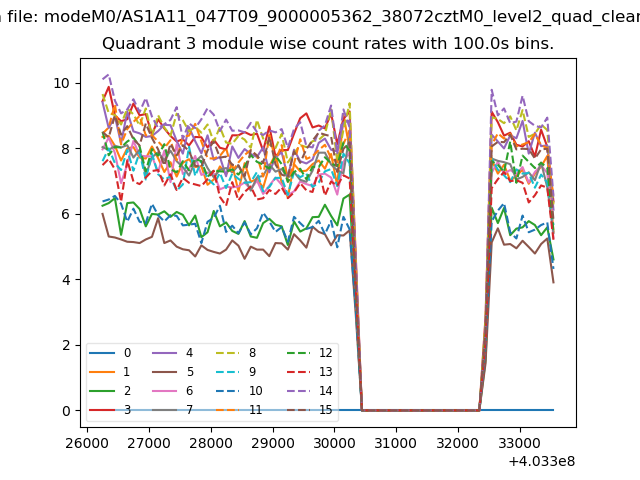
| Module-wise count rates for Quadrant C Data is divided into 100 sec bins |
 |
 |
| Module-wise count rates for Quadrant D Data is divided into 100 sec bins |
 |
 |
| Parameter | Plot |
|---|---|
| CZT HV Monitor | 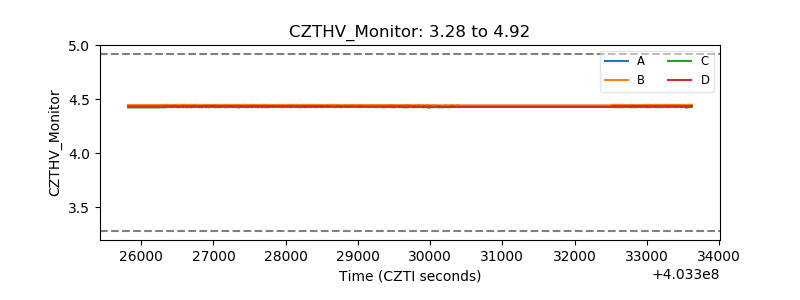 |
| D_VDD | 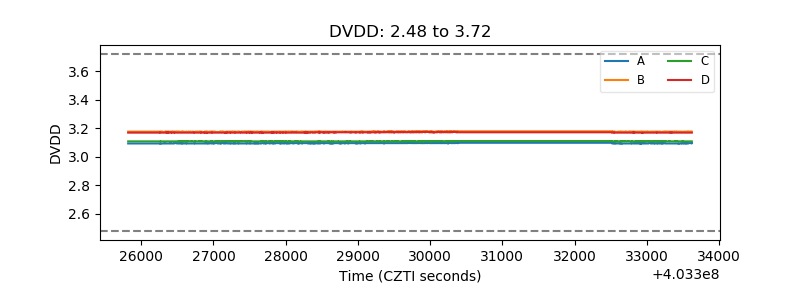 |
| Temperature 1 | 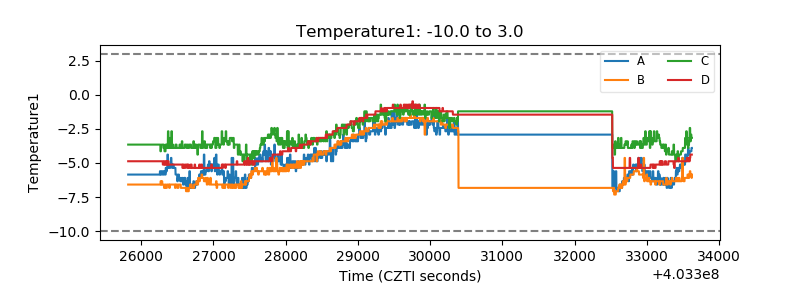 |
| Veto HV Monitor | 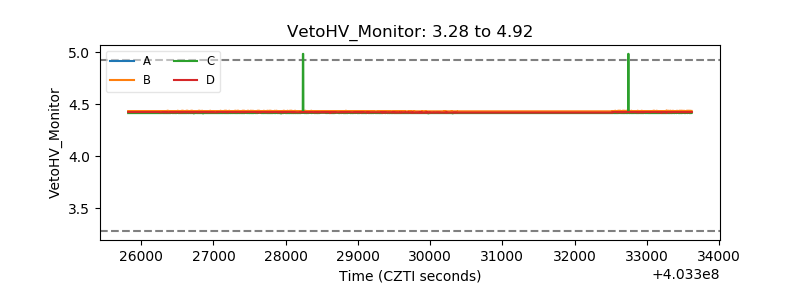 |
| Veto LLD | 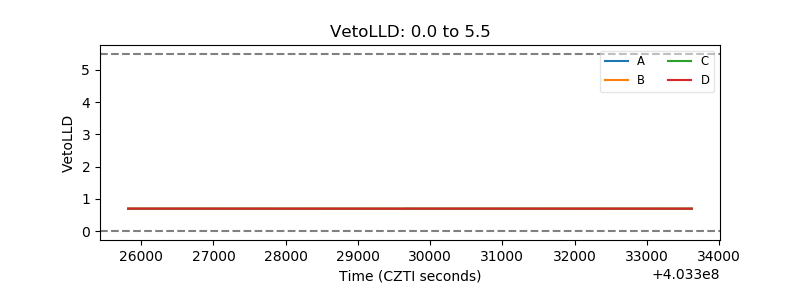 |
| Alpha Counter | 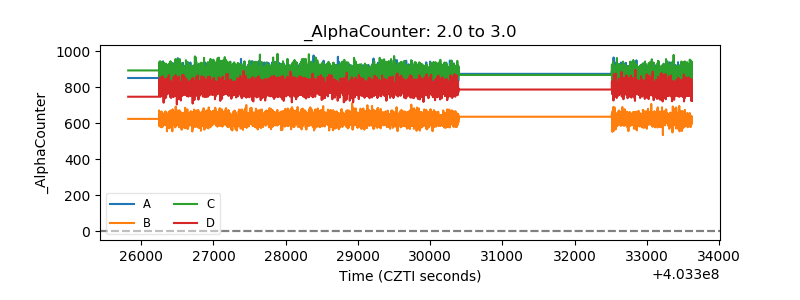 |
| _CPM_Rate | 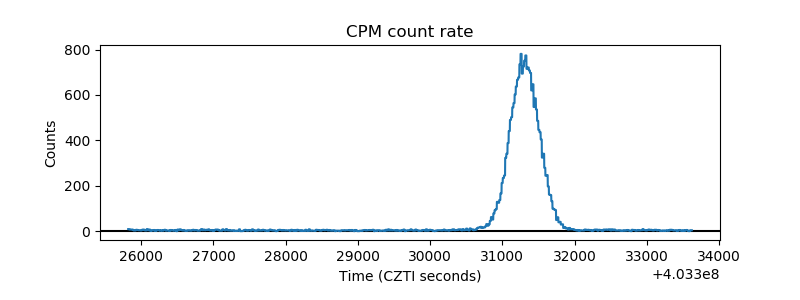 |
| CZT Counter | 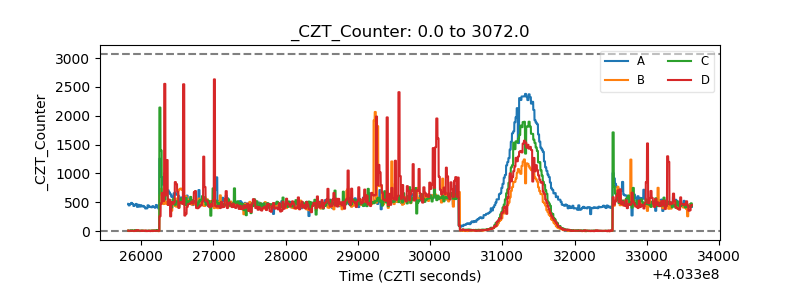 |
| +2.5 Volts monitor | 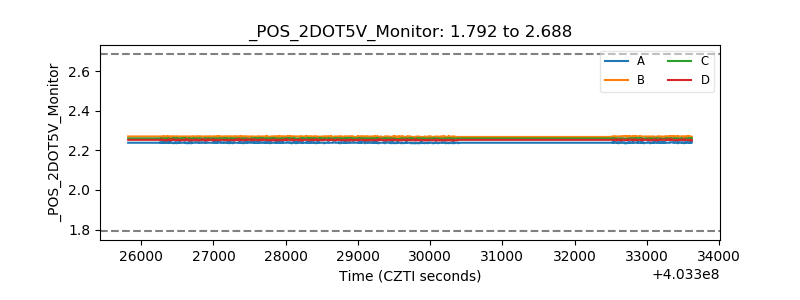 |
| +5 Volts monitor | 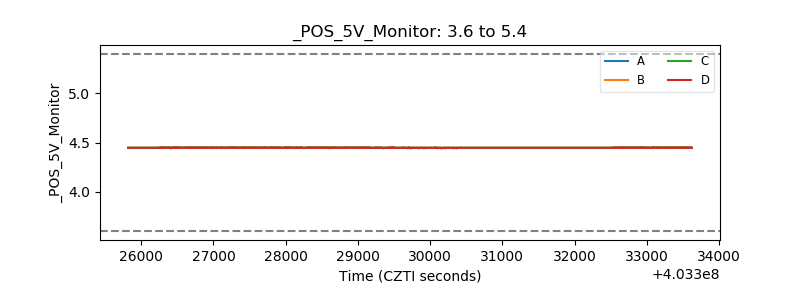 |
| _ROLL_ROT | 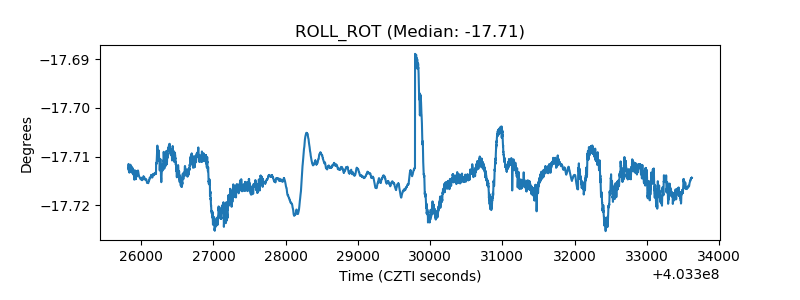 |
| _Roll_DEC | 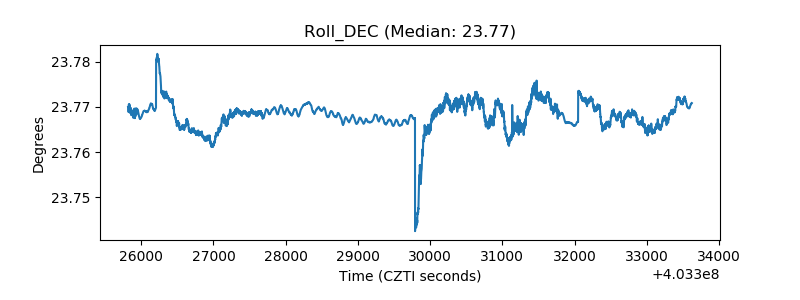 |
| _Roll_RA | 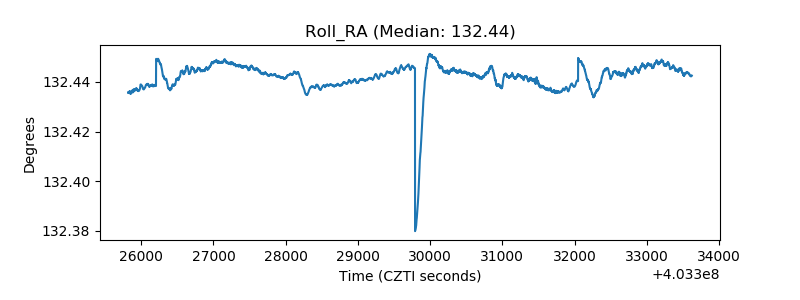 |
| Veto Counter | 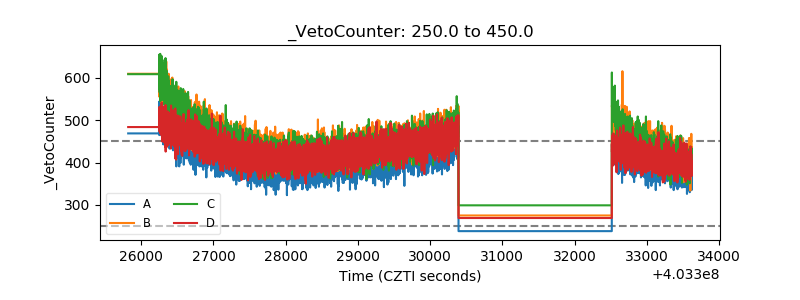 |