| Param | Original file | Final file |
|---|---|---|
| Filename | modeM0/AS1A11_047T09_9000005362_38073cztM0_level2.fits | modeM0/AS1A11_047T09_9000005362_38073cztM0_level2_quad_clean.evt |
| Size (bytes) | 310,610,880 | 92,678,400 |
| Size | 296.2 MB | 88.4 MB |
| Events in quadrant A | 2,763,133 | 627,263 |
| Events in quadrant B | 2,703,438 | 644,843 |
| Events in quadrant C | 2,628,312 | 608,486 |
| Events in quadrant D | 2,995,657 | 559,356 |
| Mode M0 | |||
|---|---|---|---|
| Quadrant | BADHDUFLAG | Total packets | Discarded packets |
| A | 0 | 11308 | 3 |
| B | 0 | 11438 | 2 |
| C | 0 | 10924 | 2 |
| D | 0 | 12465 | 2 |
| Mode SS | |||
|---|---|---|---|
| Quadrant | BADHDUFLAG | Total packets | Discarded packets |
| A | 0 | 108 | 0 |
| B | 0 | 108 | 0 |
| C | 0 | 108 | 0 |
| D | 0 | 108 | 0 |
| Mode M9 | |||
|---|---|---|---|
| Quadrant | BADHDUFLAG | Total packets | Discarded packets |
| A | 0 | 22 | 0 |
| B | 0 | 22 | 0 |
| C | 0 | 22 | 0 |
| D | 0 | 23 | 0 |
| Quadrant | Total seconds | Saturated seconds | Saturation percentage |
|---|---|---|---|
| A | 5226 | 11 | 0.210486% |
| B | 5226 | 28 | 0.535783% |
| C | 5226 | 14 | 0.267891% |
| D | 5226 | 83 | 1.588213% |
Noise dominated data is calculated using 1-second bins in cleaned event files. If a bin has >2000 counts, and if more than 50% of those come from <1% of pixels, then it is considered to be noise-dominated and hence unusable.
| Quadrant | # 1 sec bins | Bins with >0 counts | Bins with >2000 counts | High rate bins dominated by noise | Noise dominated (total time) | Noise dominated (detector-on time) | Marked lightcurve |
|---|---|---|---|---|---|---|---|
| A | 7289 | 5227 | 2 | 2 | 0.03% | 0.04% | 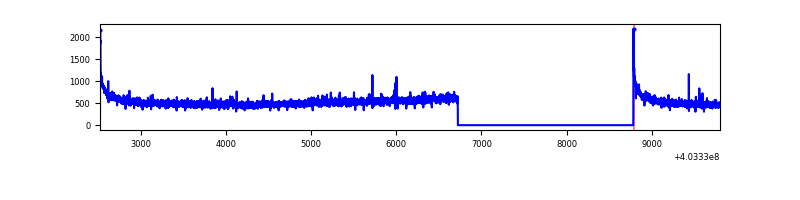 |
| B | 7289 | 5227 | 11 | 11 | 0.15% | 0.21% | 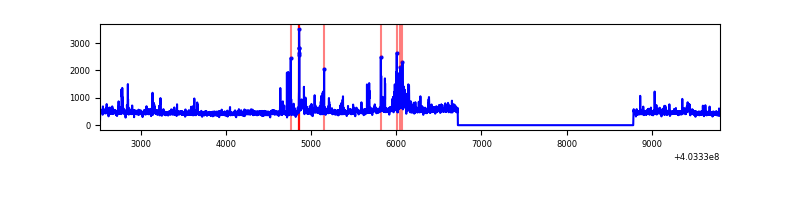 |
| C | 7289 | 5227 | 10 | 10 | 0.14% | 0.19% | 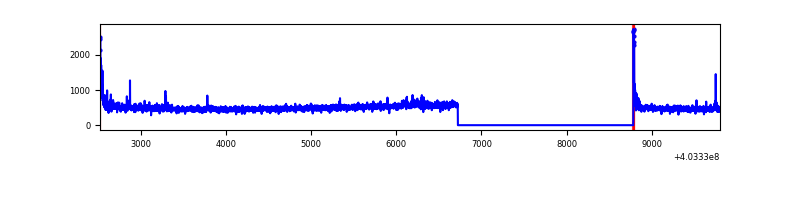 |
| D | 7289 | 5227 | 68 | 68 | 0.93% | 1.30% | 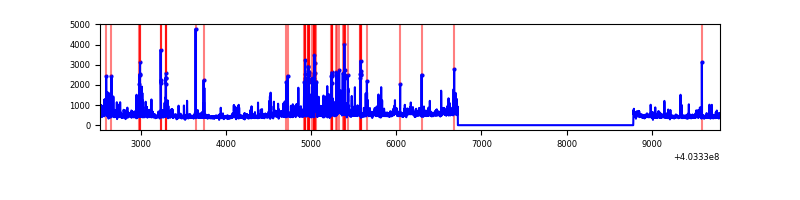 |
Top three noisy pixels from each quadrant. If the there are fewer than three noisy pixels in the level2.evt file, extra rows are filled as -1
| Pixel properties | Quadrant properties | ||||||
|---|---|---|---|---|---|---|---|
| Quadrant | DetID | PixID | Counts | Sigma | Mean | Median | Sigma |
| A | 10 | 83 | 360090 | 2892.76 | 612 | 601 | 124.3 |
| A | 12 | 189 | 9792 | 73.96 | 612 | 601 | 124.3 |
| A | 13 | 6 | 8231 | 61.4 | 612 | 601 | 124.3 |
| B | 0 | 229 | 80069 | 684.42 | 606 | 591 | 116.1 |
| B | 0 | 186 | 72728 | 621.21 | 606 | 591 | 116.1 |
| B | 4 | 171 | 49817 | 423.91 | 606 | 591 | 116.1 |
| C | 15 | 214 | 217743 | 1568.28 | 593 | 598 | 138.5 |
| C | 0 | 10 | 61730 | 441.51 | 593 | 598 | 138.5 |
| C | 1 | 23 | 20486 | 143.64 | 593 | 598 | 138.5 |
| D | 2 | 250 | 151742 | 1044.71 | 591 | 575 | 144.7 |
| D | 5 | 222 | 143923 | 990.67 | 591 | 575 | 144.7 |
| D | 13 | 249 | 121566 | 836.16 | 591 | 575 | 144.7 |
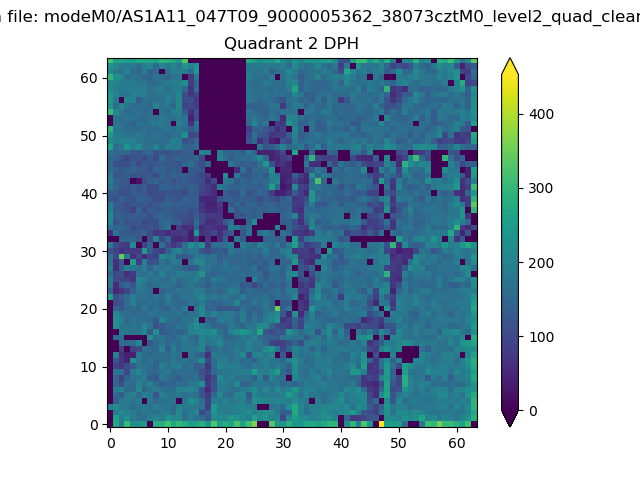
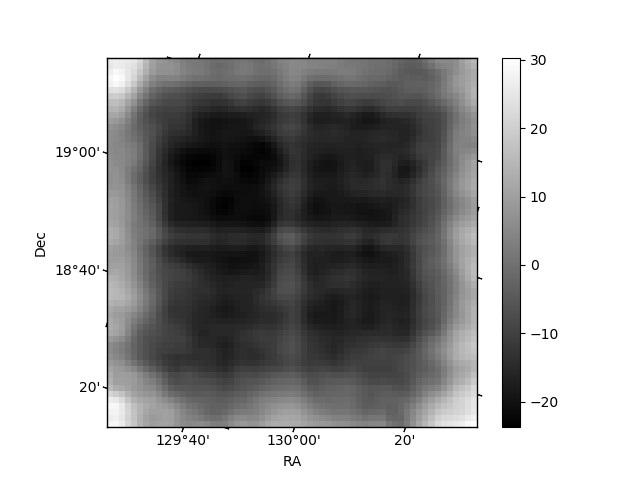
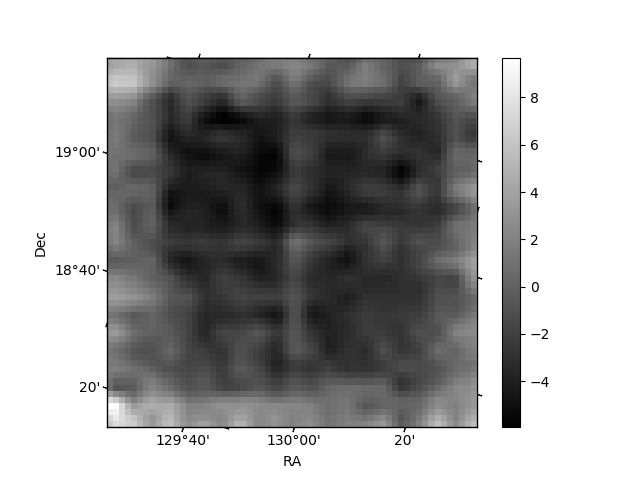
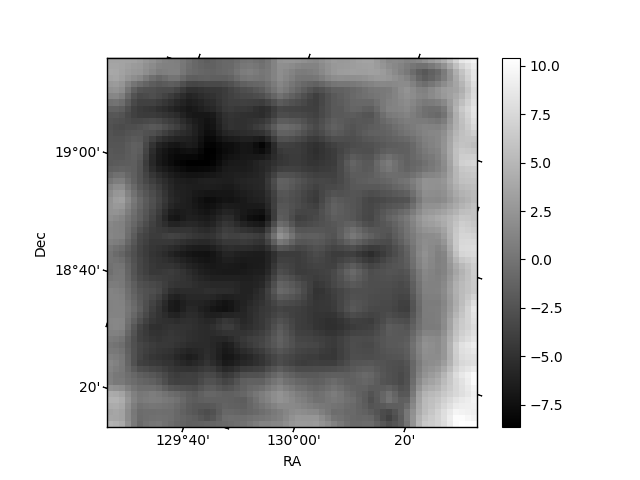
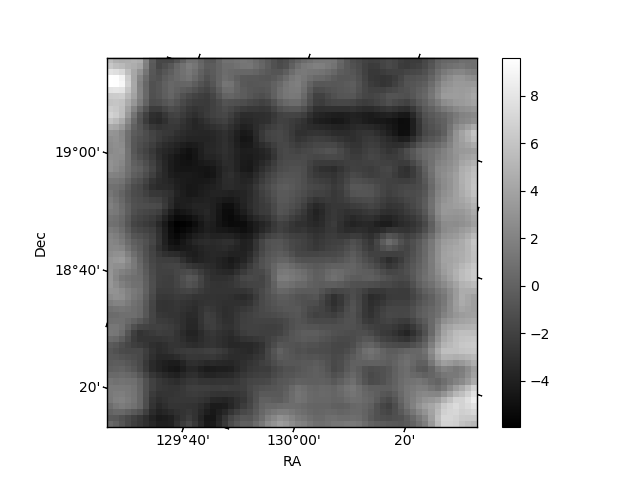
Histogram calculated using DETX and DETY for each event in the final _common_clean file
| Quadrant A | 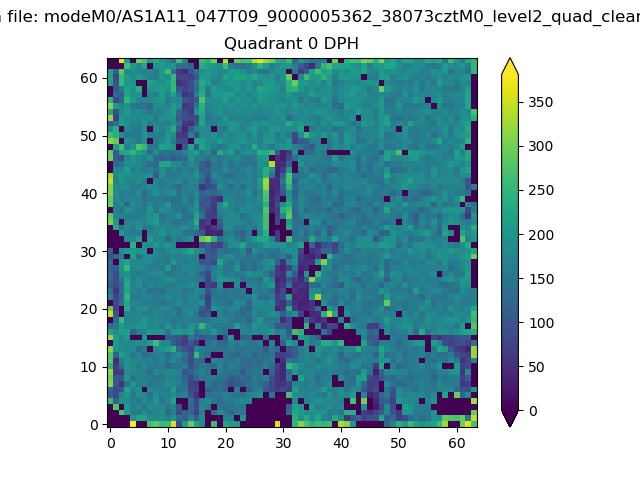 |
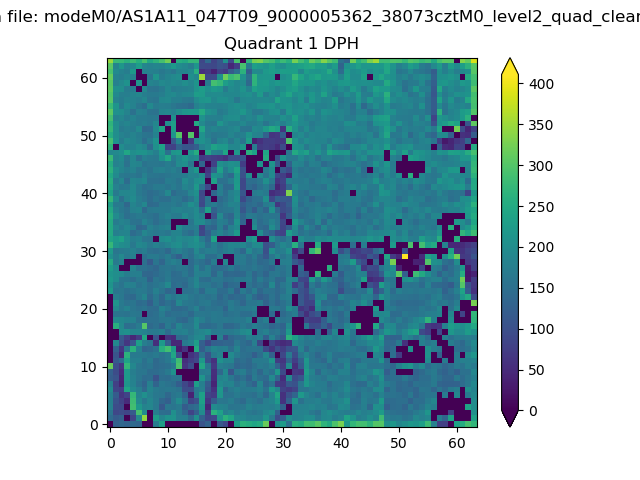 |
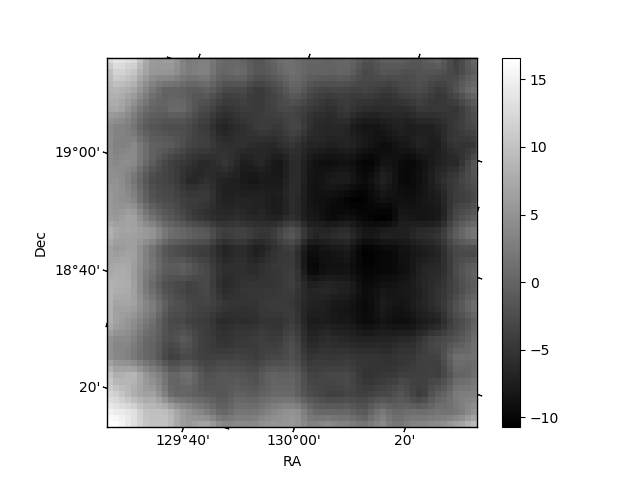
Quadrant B |
|---|---|---|---|
| Quadrant D | 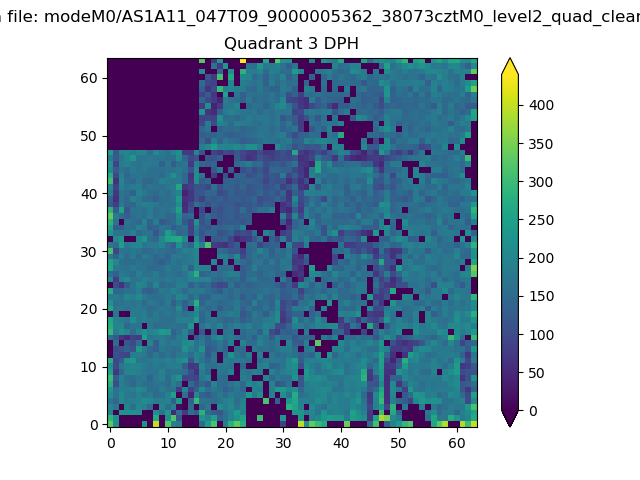 |
 |
Quadrant C |
| Plot type | Count rate plots | Images |
|---|---|---|
| Comparison with Poisson distribution Blue bars denote a histogram of data divided into 1 sec bins. Red curve is a Poisson curve with rate = median count rate of data. |
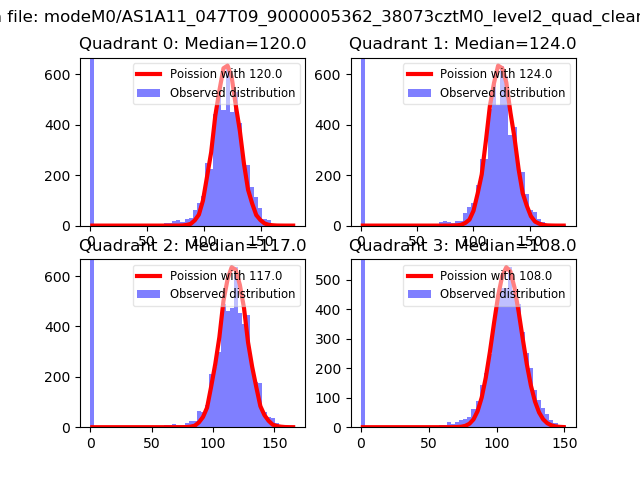 |
 |
| Quadrant-wise count rates Data is divided into 100 sec bins |
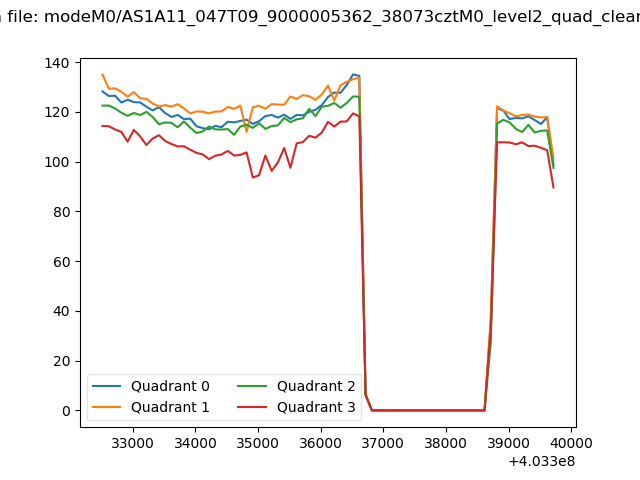 |
|
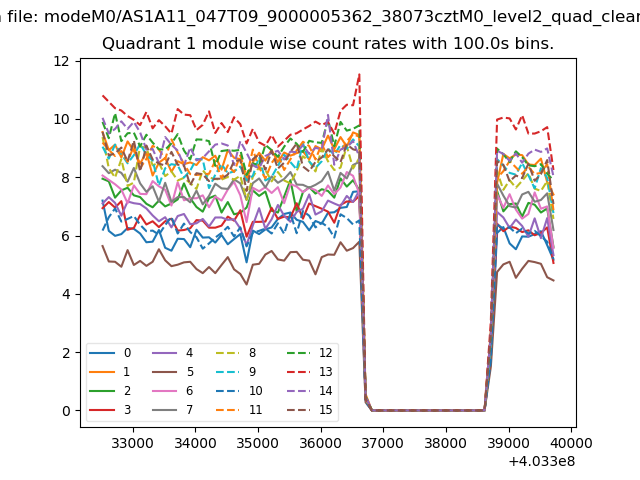
| Module-wise count rates for Quadrant A Data is divided into 100 sec bins |
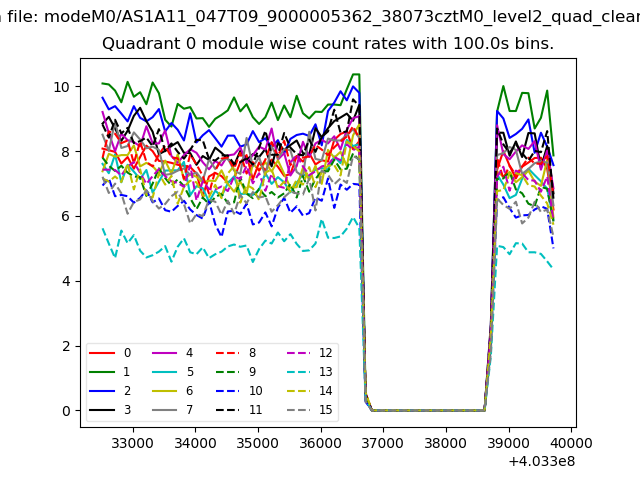 |
 |
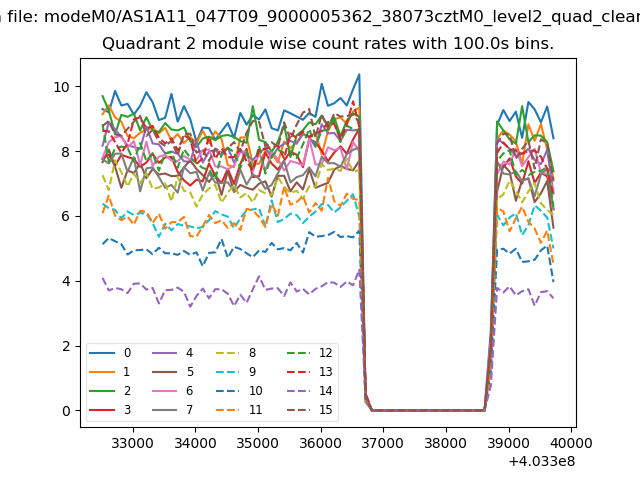
| Module-wise count rates for Quadrant B Data is divided into 100 sec bins |
 |
 |
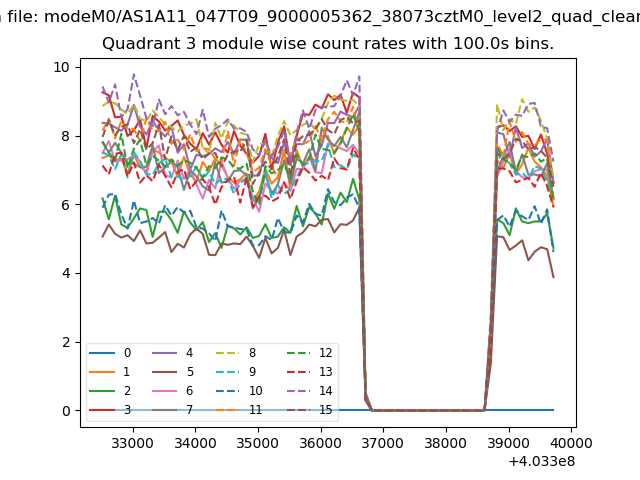
| Module-wise count rates for Quadrant C Data is divided into 100 sec bins |
 |
 |
| Module-wise count rates for Quadrant D Data is divided into 100 sec bins |
 |
 |
| Parameter | Plot |
|---|---|
| CZT HV Monitor | 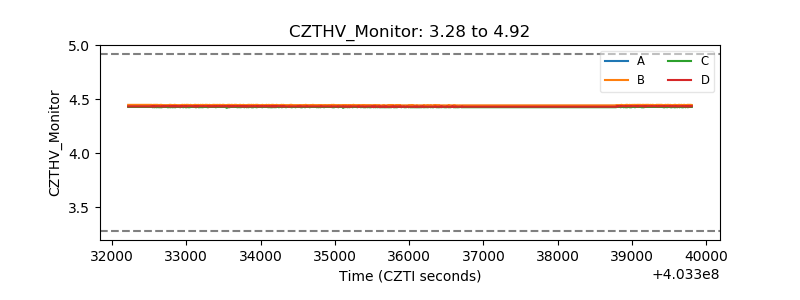 |
| D_VDD | 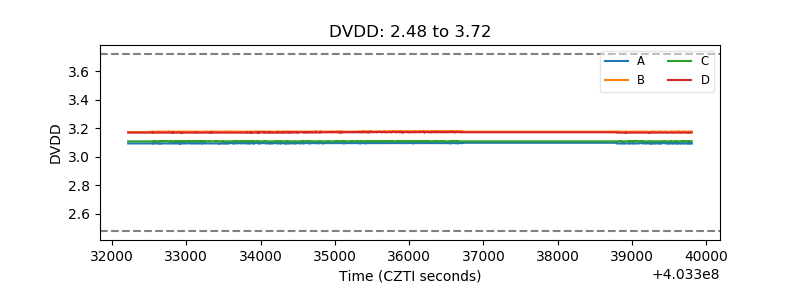 |
| Temperature 1 | 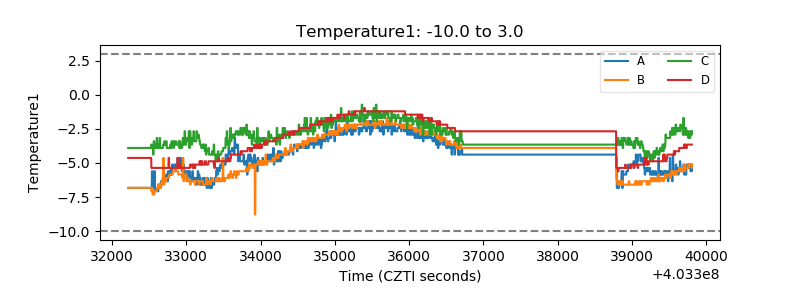 |
| Veto HV Monitor | 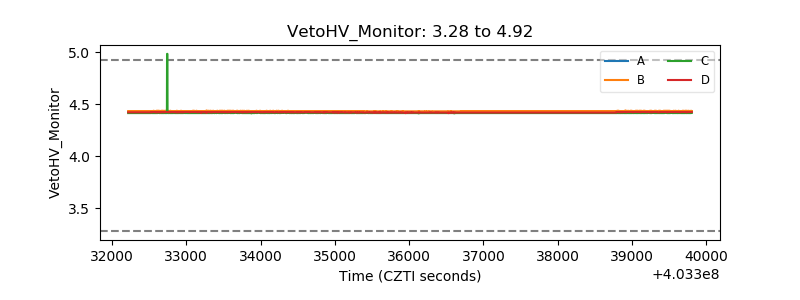 |
| Veto LLD | 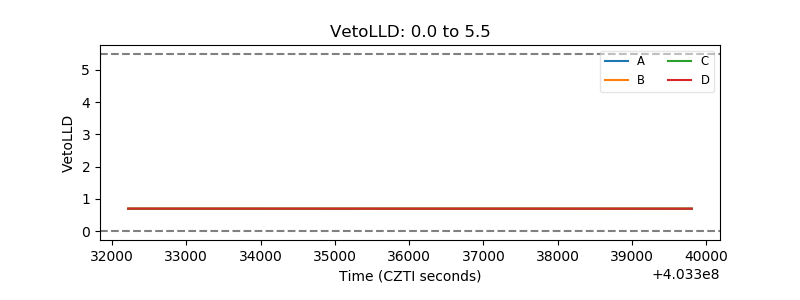 |
| Alpha Counter | 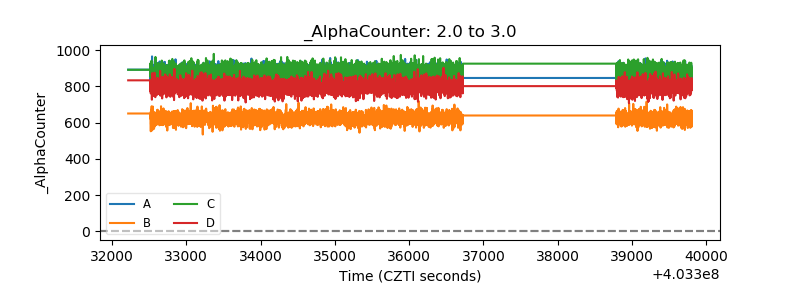 |
| _CPM_Rate | 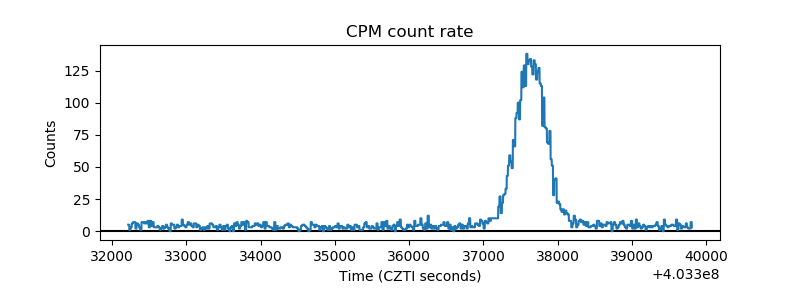 |
| CZT Counter | 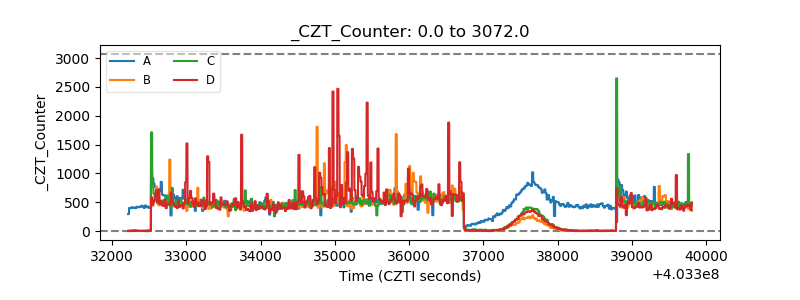 |
| +2.5 Volts monitor | 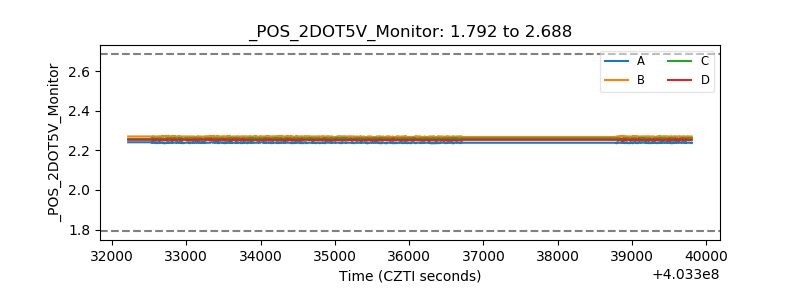 |
| +5 Volts monitor | 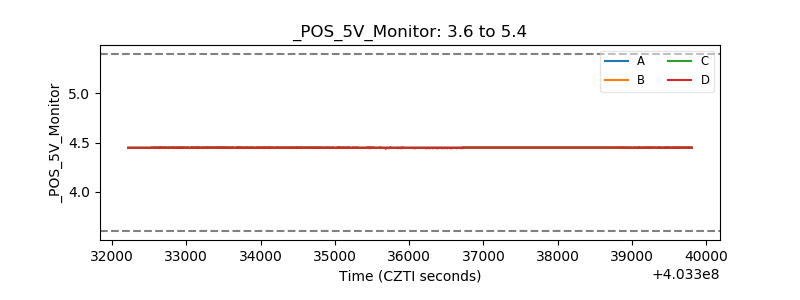 |
| _ROLL_ROT | 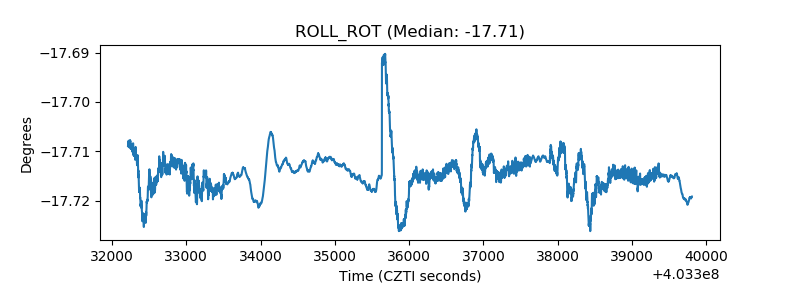 |
| _Roll_DEC | 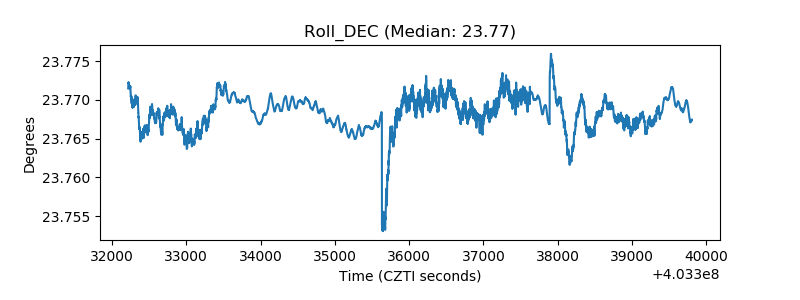 |
| _Roll_RA | 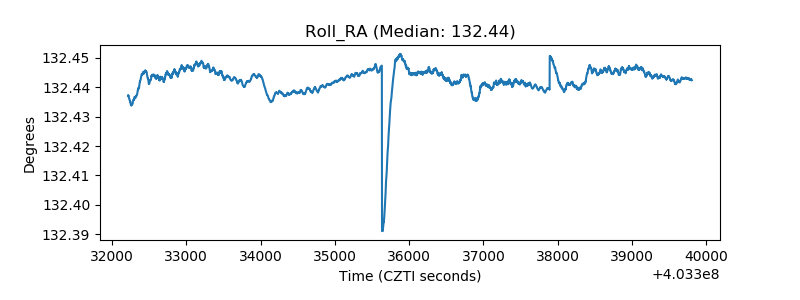 |
| Veto Counter | 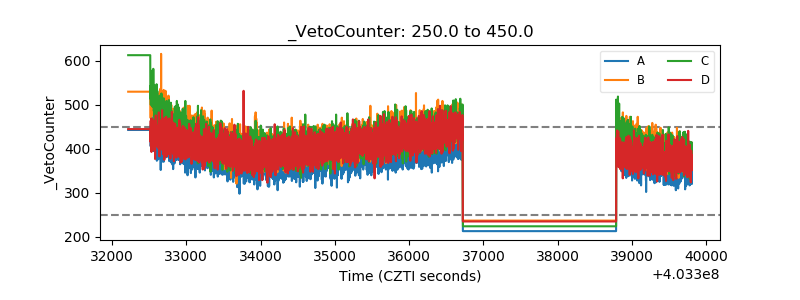 |