| Param | Original file | Final file |
|---|---|---|
| Filename | modeM0/AS1A11_047T09_9000005362_38074cztM0_level2.fits | modeM0/AS1A11_047T09_9000005362_38074cztM0_level2_quad_clean.evt |
| Size (bytes) | 343,935,360 | 92,211,840 |
| Size | 328.0 MB | 87.9 MB |
| Events in quadrant A | 2,844,806 | 631,209 |
| Events in quadrant B | 2,726,699 | 642,938 |
| Events in quadrant C | 2,817,297 | 610,877 |
| Events in quadrant D | 3,921,492 | 528,905 |
| Mode M0 | |||
|---|---|---|---|
| Quadrant | BADHDUFLAG | Total packets | Discarded packets |
| A | 0 | 11559 | 3 |
| B | 0 | 11564 | 2 |
| C | 0 | 11552 | 2 |
| D | 0 | 15395 | 2 |
| Mode SS | |||
|---|---|---|---|
| Quadrant | BADHDUFLAG | Total packets | Discarded packets |
| A | 0 | 110 | 0 |
| B | 0 | 110 | 0 |
| C | 0 | 110 | 0 |
| D | 0 | 110 | 0 |
| Mode M9 | |||
|---|---|---|---|
| Quadrant | BADHDUFLAG | Total packets | Discarded packets |
| A | 0 | 20 | 0 |
| B | 0 | 20 | 0 |
| C | 0 | 20 | 0 |
| D | 0 | 21 | 0 |
| Quadrant | Total seconds | Saturated seconds | Saturation percentage |
|---|---|---|---|
| A | 5405 | 11 | 0.203515% |
| B | 5405 | 41 | 0.758557% |
| C | 5405 | 23 | 0.425532% |
| D | 5405 | 416 | 7.696577% |
Noise dominated data is calculated using 1-second bins in cleaned event files. If a bin has >2000 counts, and if more than 50% of those come from <1% of pixels, then it is considered to be noise-dominated and hence unusable.
| Quadrant | # 1 sec bins | Bins with >0 counts | Bins with >2000 counts | High rate bins dominated by noise | Noise dominated (total time) | Noise dominated (detector-on time) | Marked lightcurve |
|---|---|---|---|---|---|---|---|
| A | 7198 | 5406 | 4 | 4 | 0.06% | 0.07% | 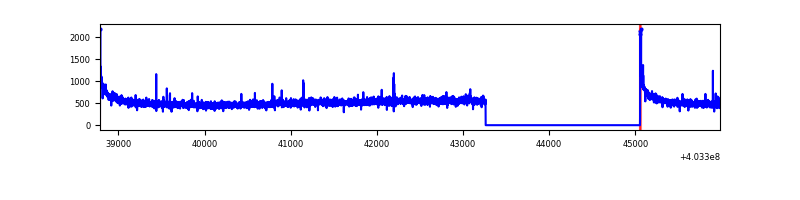 |
| B | 7198 | 5406 | 25 | 25 | 0.35% | 0.46% | 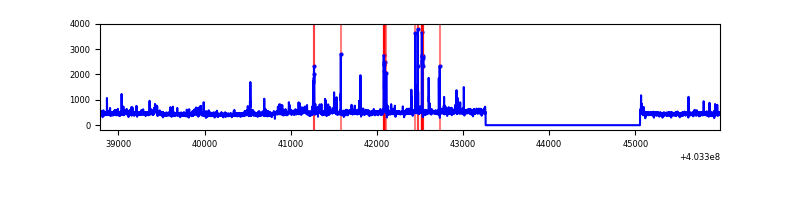 |
| C | 7198 | 5406 | 22 | 22 | 0.31% | 0.41% | 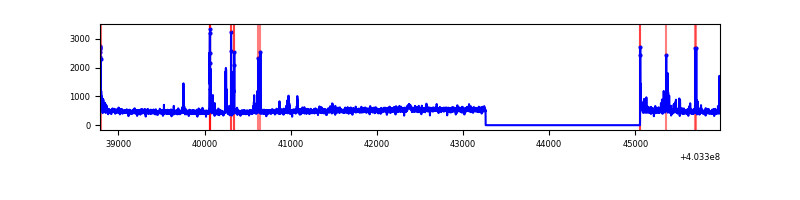 |
| D | 7198 | 5406 | 360 | 360 | 5.00% | 6.66% | 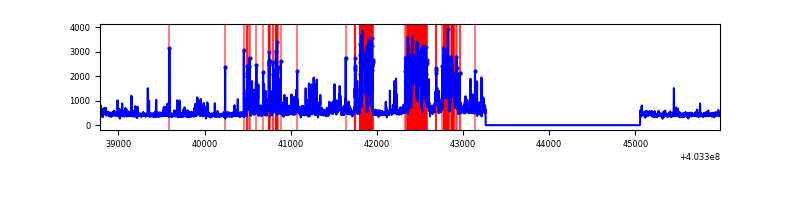 |
Top three noisy pixels from each quadrant. If the there are fewer than three noisy pixels in the level2.evt file, extra rows are filled as -1
| Pixel properties | Quadrant properties | ||||||
|---|---|---|---|---|---|---|---|
| Quadrant | DetID | PixID | Counts | Sigma | Mean | Median | Sigma |
| A | 10 | 83 | 369530 | 2881.33 | 630 | 620 | 128.0 |
| A | 7 | 16 | 15743 | 118.12 | 630 | 620 | 128.0 |
| A | 13 | 6 | 6906 | 49.1 | 630 | 620 | 128.0 |
| B | 0 | 229 | 130318 | 1074.78 | 620 | 604 | 120.7 |
| B | 5 | 184 | 54399 | 445.73 | 620 | 604 | 120.7 |
| B | 4 | 171 | 43225 | 353.15 | 620 | 604 | 120.7 |
| C | 15 | 214 | 224957 | 1561.35 | 610 | 614 | 143.7 |
| C | 1 | 23 | 151621 | 1050.96 | 610 | 614 | 143.7 |
| C | 0 | 10 | 45434 | 311.93 | 610 | 614 | 143.7 |
| D | 1 | 52 | 758872 | 5227.09 | 590 | 574 | 145.1 |
| D | 5 | 222 | 268304 | 1845.51 | 590 | 574 | 145.1 |
| D | 2 | 250 | 193430 | 1329.39 | 590 | 574 | 145.1 |
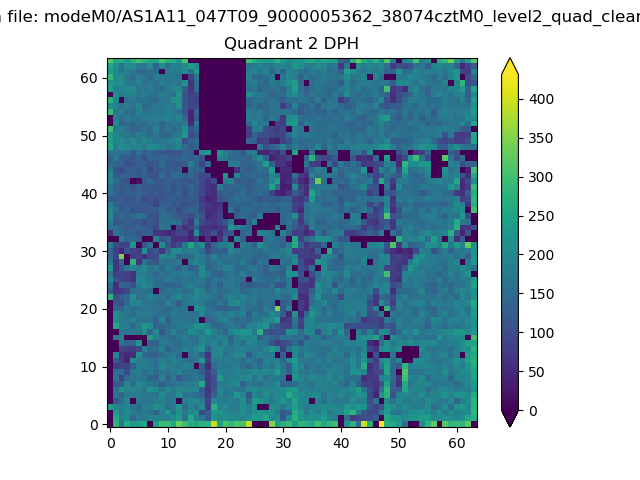
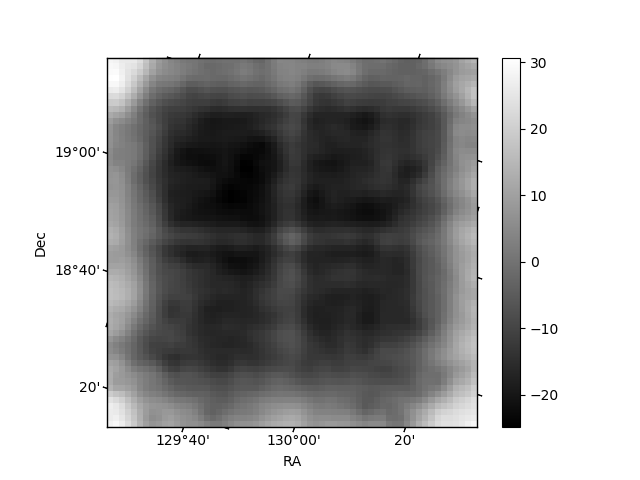
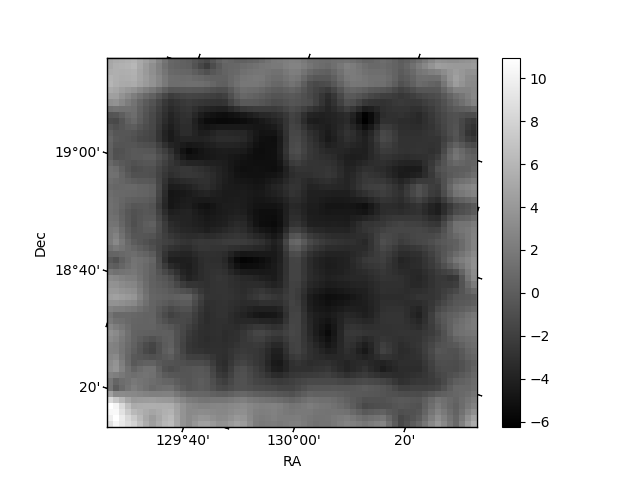
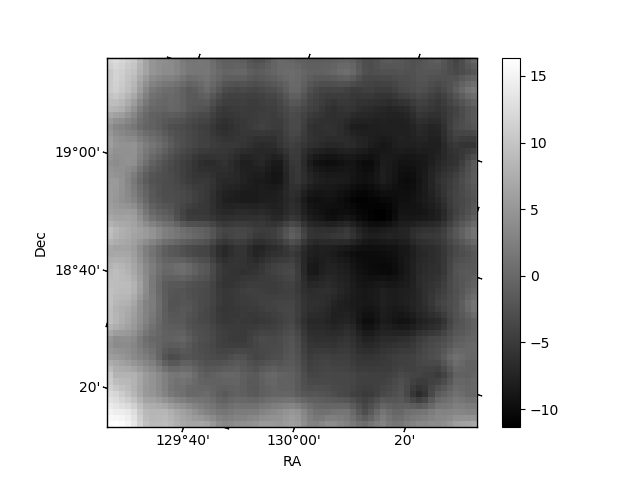
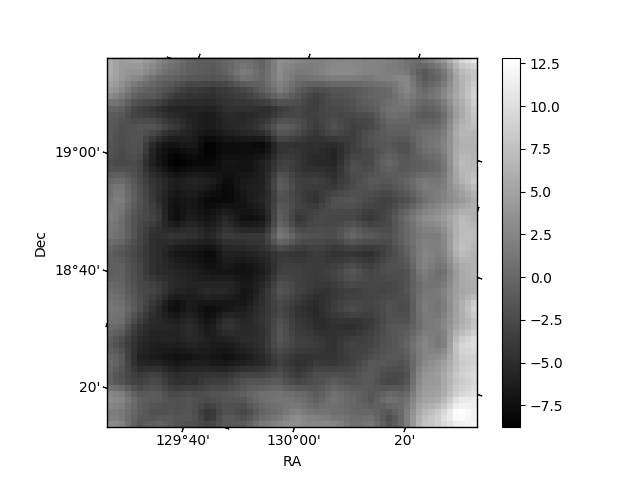
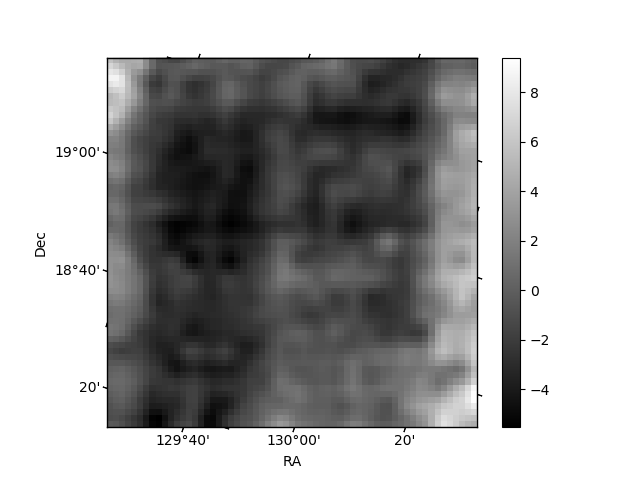
Histogram calculated using DETX and DETY for each event in the final _common_clean file
| Quadrant A | 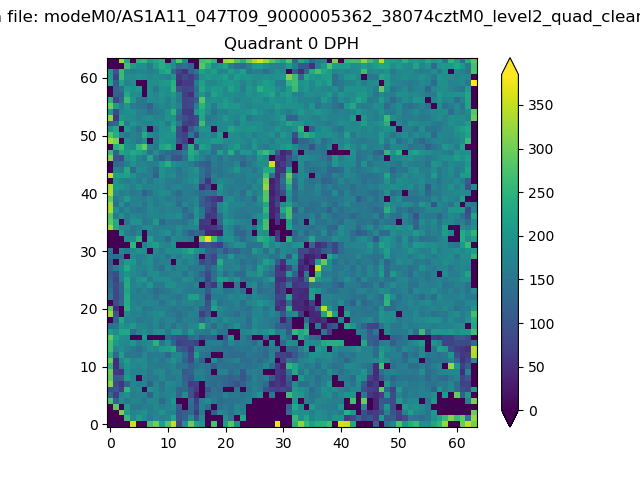 |
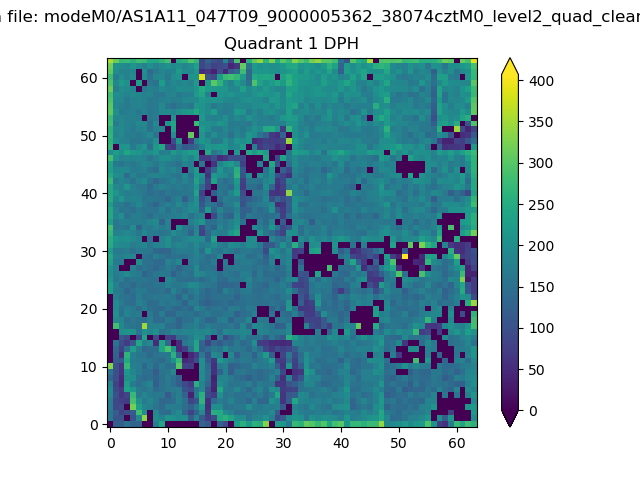 |
Quadrant B |
|---|---|---|---|
| Quadrant D | 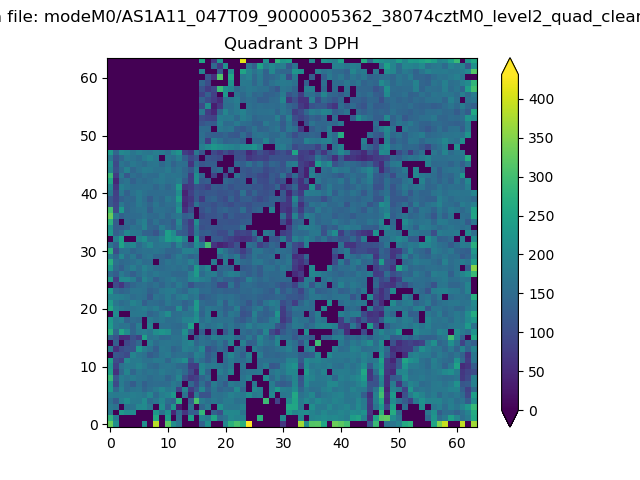 |
 |
Quadrant C |
| Plot type | Count rate plots | Images |
|---|---|---|
| Comparison with Poisson distribution Blue bars denote a histogram of data divided into 1 sec bins. Red curve is a Poisson curve with rate = median count rate of data. |
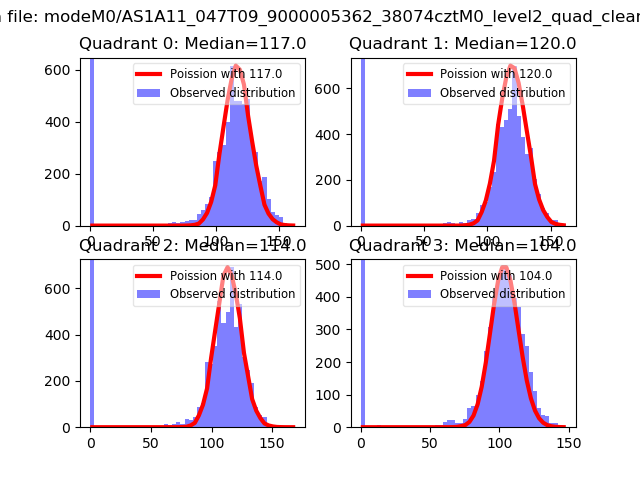 |
 |
| Quadrant-wise count rates Data is divided into 100 sec bins |
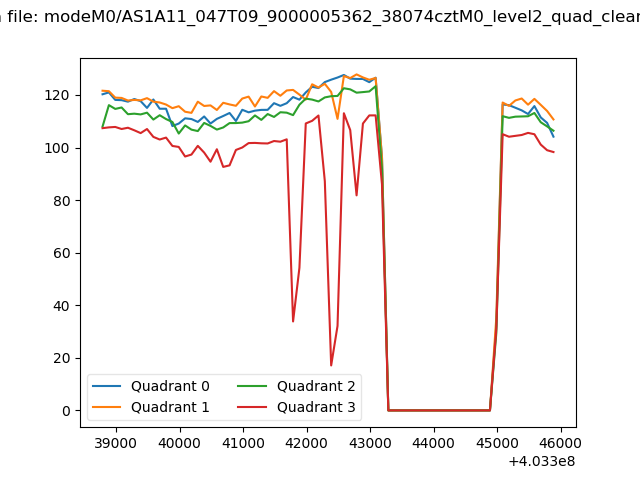 |
|
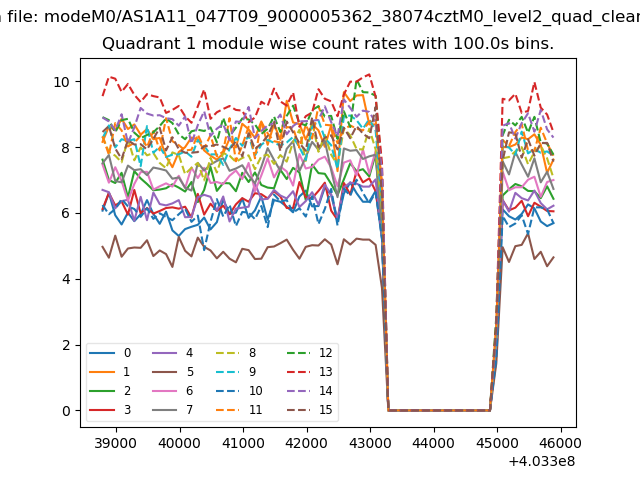
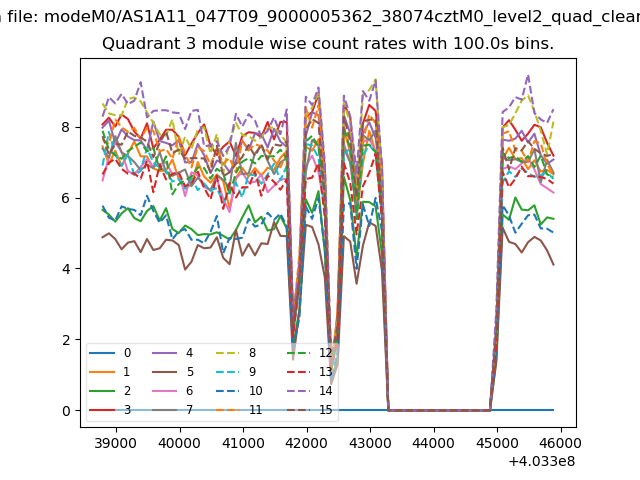
| Module-wise count rates for Quadrant A Data is divided into 100 sec bins |
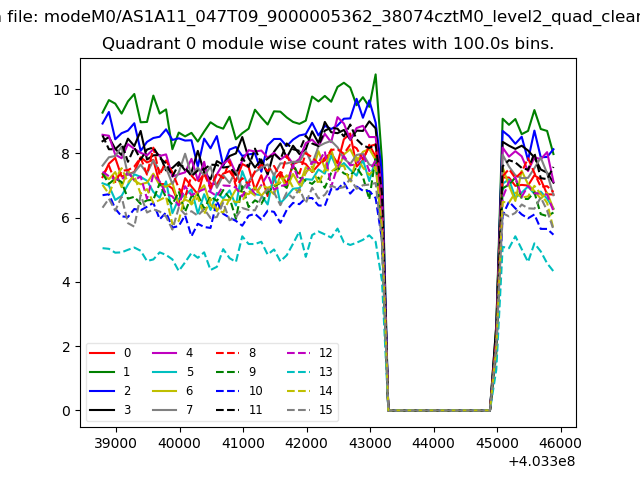 |
 |
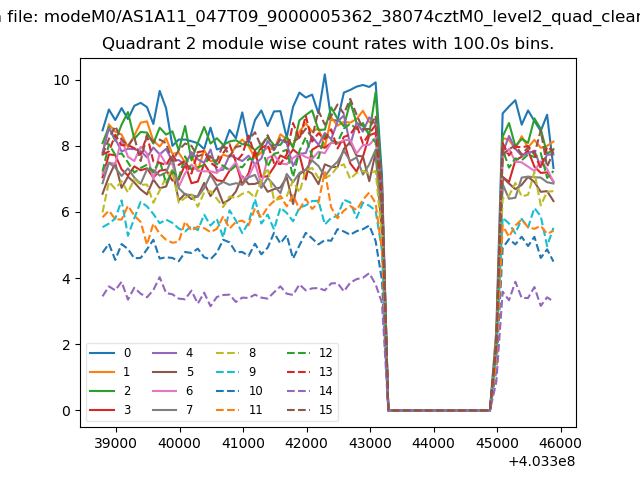
| Module-wise count rates for Quadrant B Data is divided into 100 sec bins |
 |
 |
| Module-wise count rates for Quadrant C Data is divided into 100 sec bins |
 |
 |
| Module-wise count rates for Quadrant D Data is divided into 100 sec bins |
 |
 |
| Parameter | Plot |
|---|---|
| CZT HV Monitor | 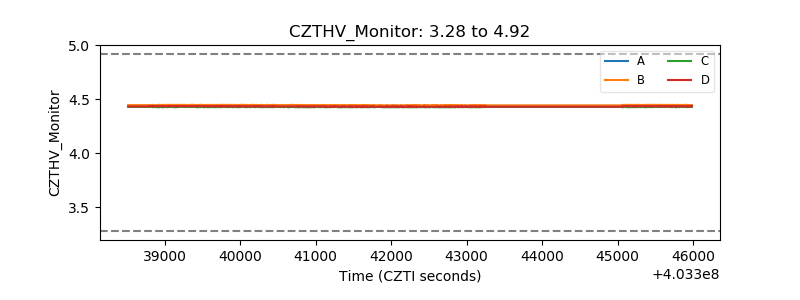 |
| D_VDD | 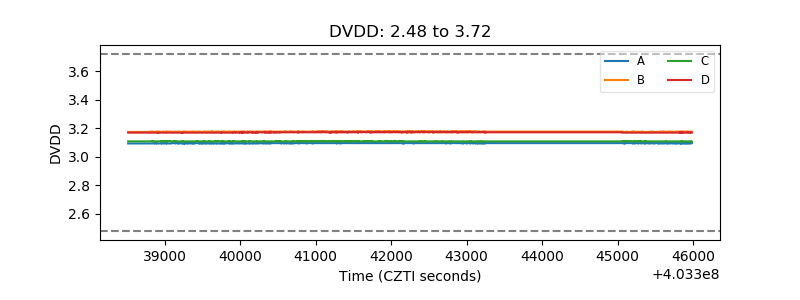 |
| Temperature 1 | 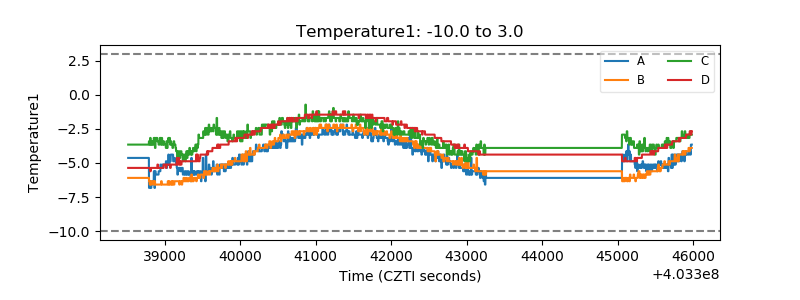 |
| Veto HV Monitor | 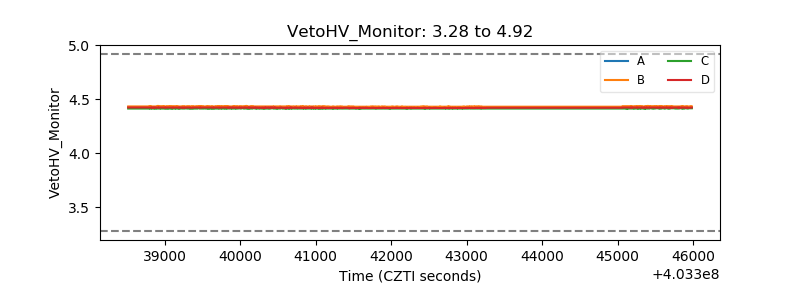 |
| Veto LLD | 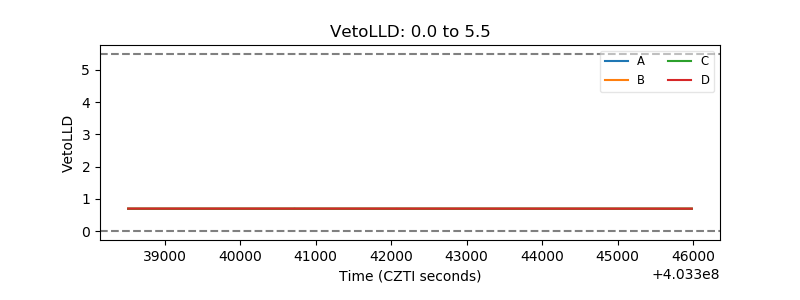 |
| Alpha Counter | 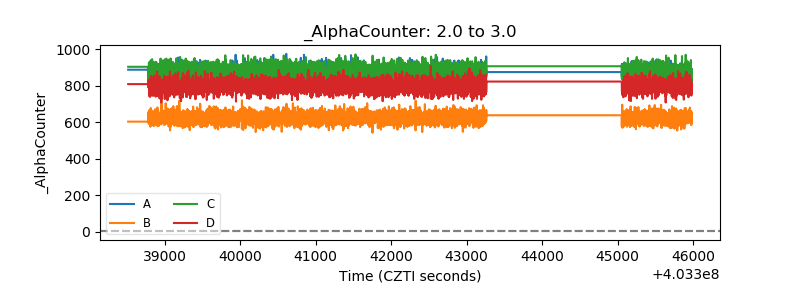 |
| _CPM_Rate | 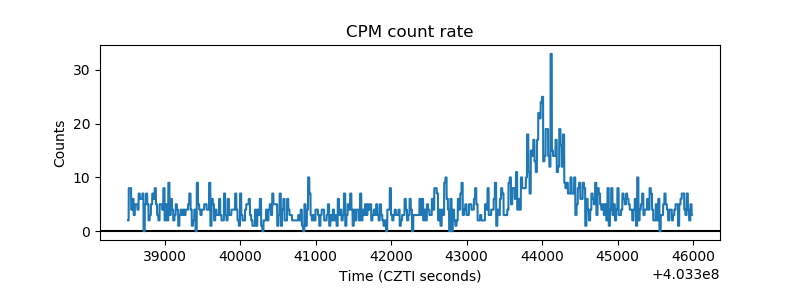 |
| CZT Counter | 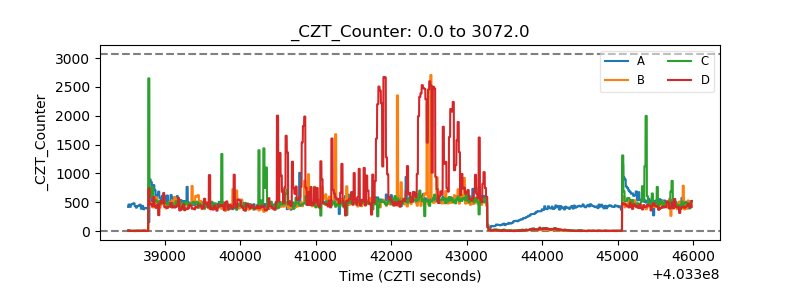 |
| +2.5 Volts monitor | 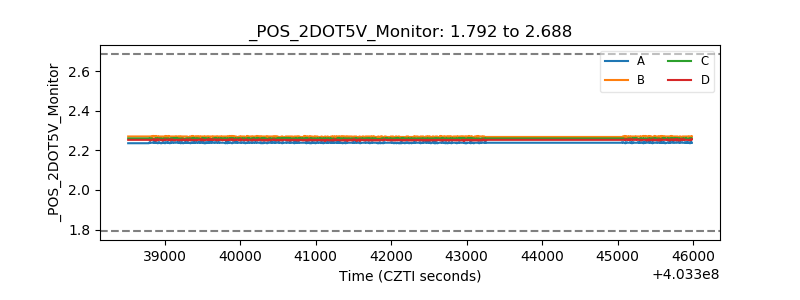 |
| +5 Volts monitor | 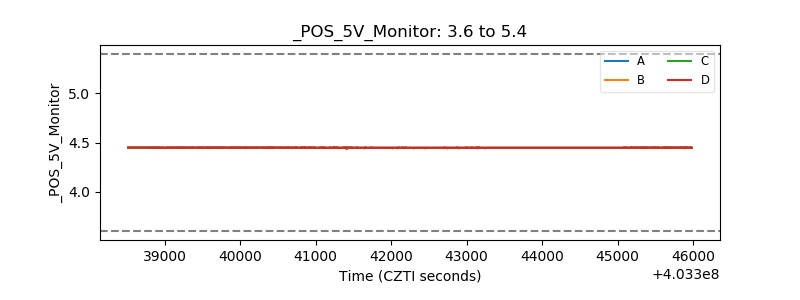 |
| _ROLL_ROT | 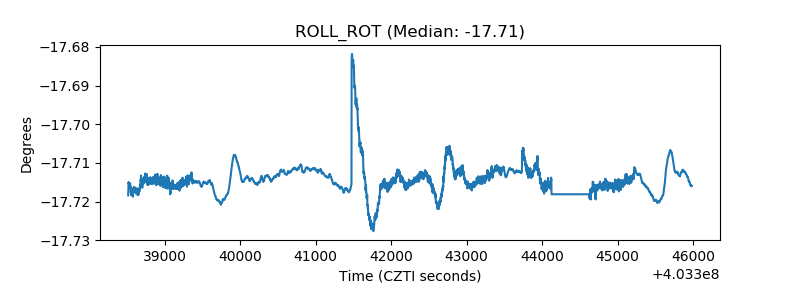 |
| _Roll_DEC | 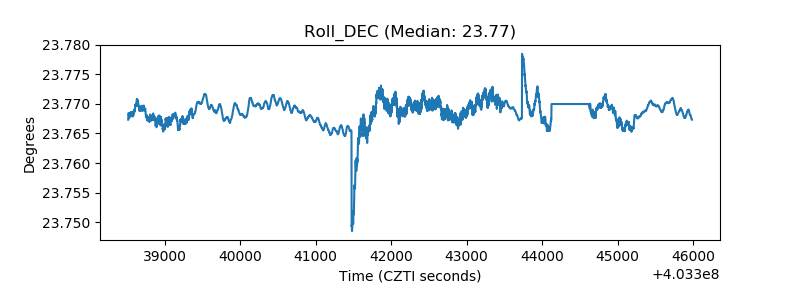 |
| _Roll_RA | 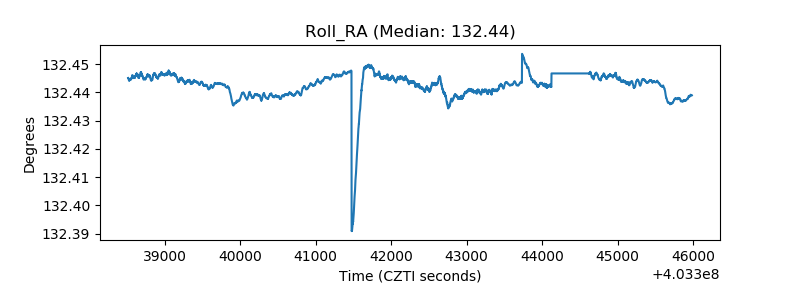 |
| Veto Counter | 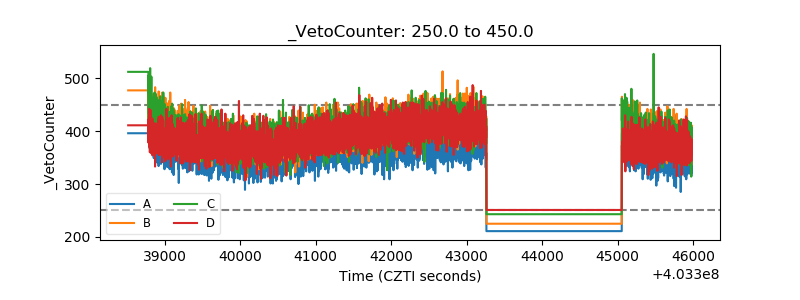 |