| Param | Original file | Final file |
|---|---|---|
| Filename | modeM0/AS1A11_047T09_9000005362_38075cztM0_level2.fits | modeM0/AS1A11_047T09_9000005362_38075cztM0_level2_quad_clean.evt |
| Size (bytes) | 392,351,040 | 95,814,720 |
| Size | 374.2 MB | 91.4 MB |
| Events in quadrant A | 2,977,279 | 653,905 |
| Events in quadrant B | 2,840,492 | 669,106 |
| Events in quadrant C | 2,925,007 | 635,070 |
| Events in quadrant D | 5,337,726 | 545,360 |
| Mode M0 | |||
|---|---|---|---|
| Quadrant | BADHDUFLAG | Total packets | Discarded packets |
| A | 0 | 12019 | 3 |
| B | 0 | 12055 | 2 |
| C | 0 | 11963 | 2 |
| D | 0 | 19813 | 2 |
| Mode SS | |||
|---|---|---|---|
| Quadrant | BADHDUFLAG | Total packets | Discarded packets |
| A | 0 | 114 | 0 |
| B | 0 | 114 | 0 |
| C | 0 | 114 | 0 |
| D | 0 | 114 | 0 |
| Mode M9 | |||
|---|---|---|---|
| Quadrant | BADHDUFLAG | Total packets | Discarded packets |
| A | 0 | 18 | 0 |
| B | 0 | 18 | 0 |
| C | 0 | 18 | 0 |
| D | 0 | 19 | 0 |
| Quadrant | Total seconds | Saturated seconds | Saturation percentage |
|---|---|---|---|
| A | 5697 | 8 | 0.140425% |
| B | 5697 | 33 | 0.579252% |
| C | 5697 | 17 | 0.298403% |
| D | 5697 | 542 | 9.513779% |
Noise dominated data is calculated using 1-second bins in cleaned event files. If a bin has >2000 counts, and if more than 50% of those come from <1% of pixels, then it is considered to be noise-dominated and hence unusable.
| Quadrant | # 1 sec bins | Bins with >0 counts | Bins with >2000 counts | High rate bins dominated by noise | Noise dominated (total time) | Noise dominated (detector-on time) | Marked lightcurve |
|---|---|---|---|---|---|---|---|
| A | 7160 | 5698 | 4 | 4 | 0.06% | 0.07% | 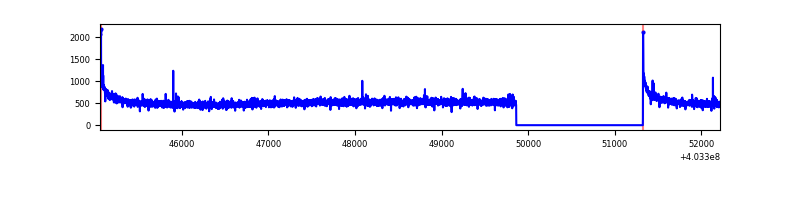 |
| B | 7160 | 5698 | 11 | 11 | 0.15% | 0.19% | 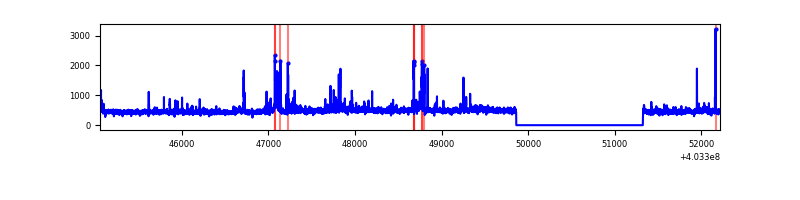 |
| C | 7160 | 5698 | 12 | 12 | 0.17% | 0.21% | 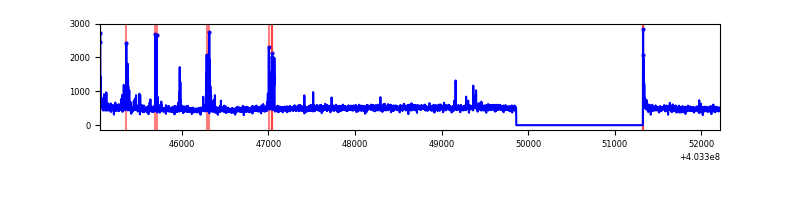 |
| D | 7160 | 5698 | 494 | 494 | 6.90% | 8.67% | 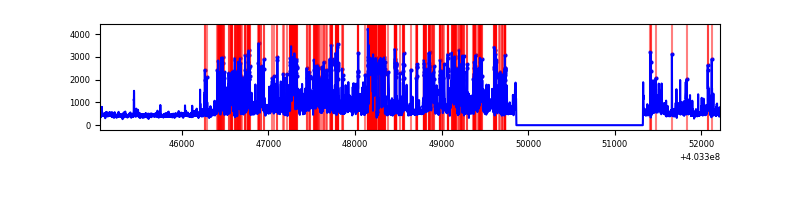 |
Top three noisy pixels from each quadrant. If the there are fewer than three noisy pixels in the level2.evt file, extra rows are filled as -1
| Pixel properties | Quadrant properties | ||||||
|---|---|---|---|---|---|---|---|
| Quadrant | DetID | PixID | Counts | Sigma | Mean | Median | Sigma |
| A | 10 | 83 | 382111 | 2813.52 | 664 | 649 | 135.6 |
| A | 12 | 189 | 10113 | 69.8 | 664 | 649 | 135.6 |
| A | 13 | 254 | 8487 | 57.81 | 664 | 649 | 135.6 |
| B | 5 | 172 | 58990 | 459.87 | 658 | 640 | 126.9 |
| B | 4 | 171 | 56656 | 441.47 | 658 | 640 | 126.9 |
| B | 0 | 229 | 43574 | 338.37 | 658 | 640 | 126.9 |
| C | 15 | 214 | 238328 | 1573.0 | 644 | 649 | 151.1 |
| C | 1 | 23 | 126293 | 831.53 | 644 | 649 | 151.1 |
| C | 0 | 10 | 31251 | 202.53 | 644 | 649 | 151.1 |
| D | 1 | 52 | 1479536 | 9728.45 | 621 | 603 | 152.0 |
| D | 12 | 227 | 699562 | 4597.77 | 621 | 603 | 152.0 |
| D | 13 | 249 | 290850 | 1909.25 | 621 | 603 | 152.0 |
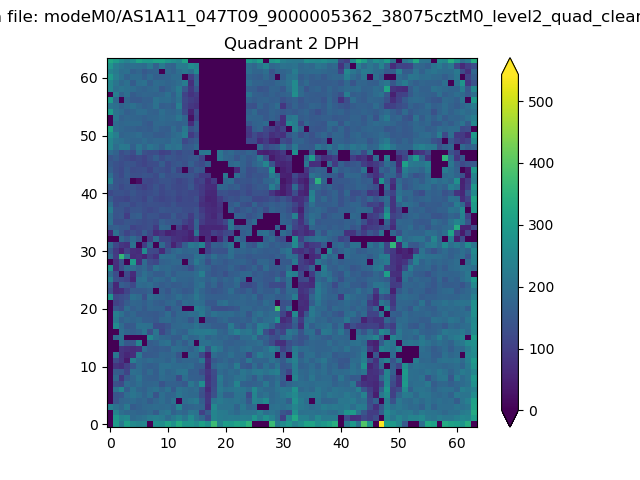
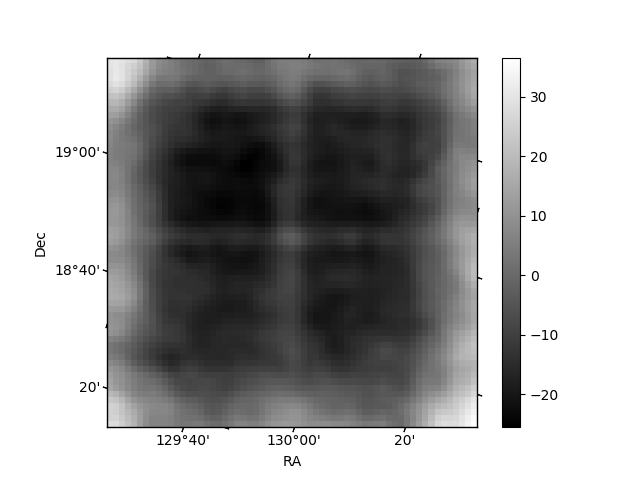
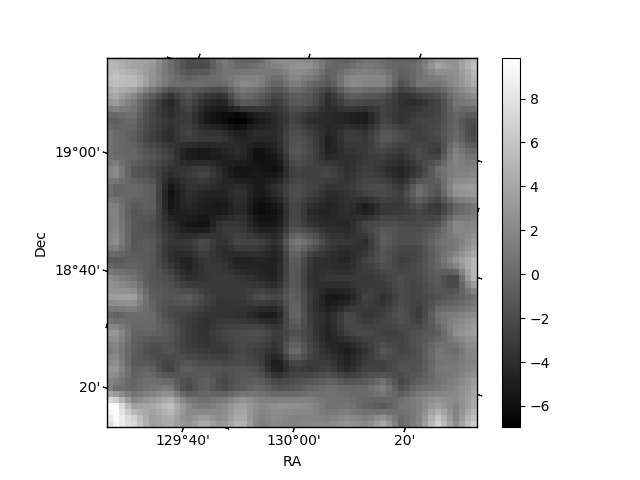
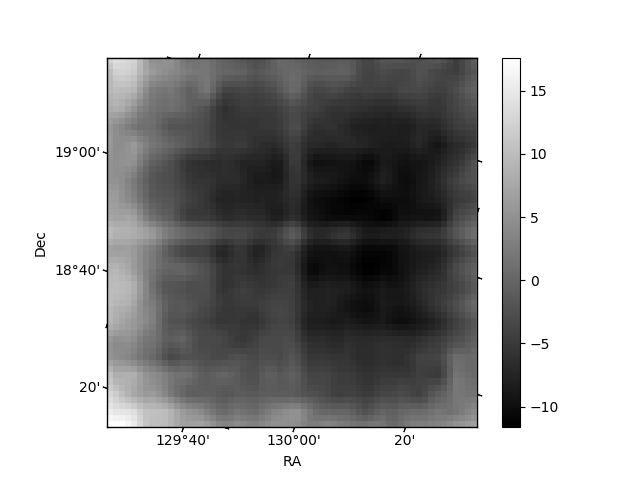
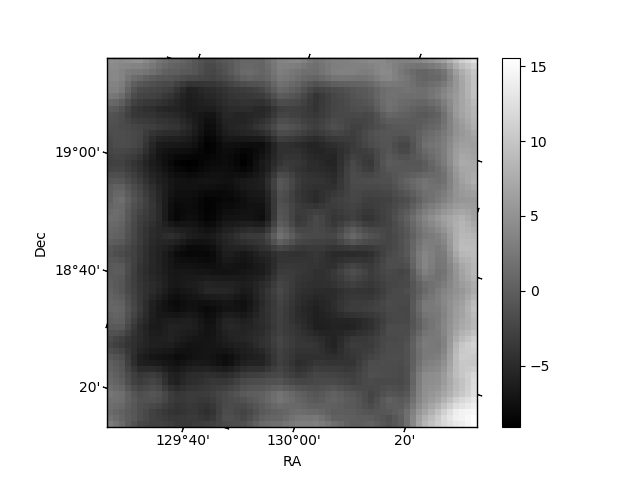
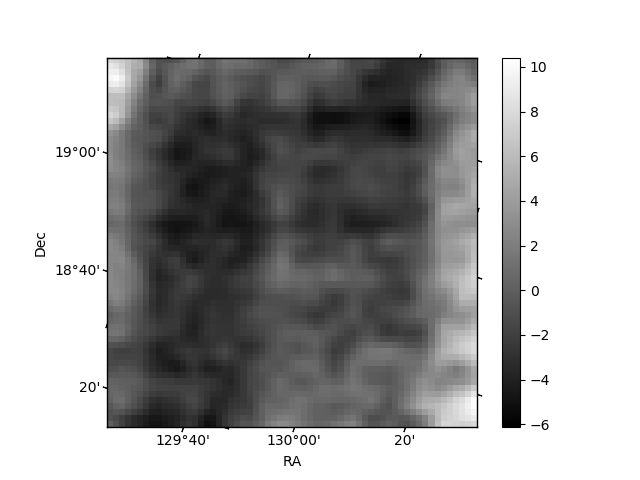
Histogram calculated using DETX and DETY for each event in the final _common_clean file
| Quadrant A | 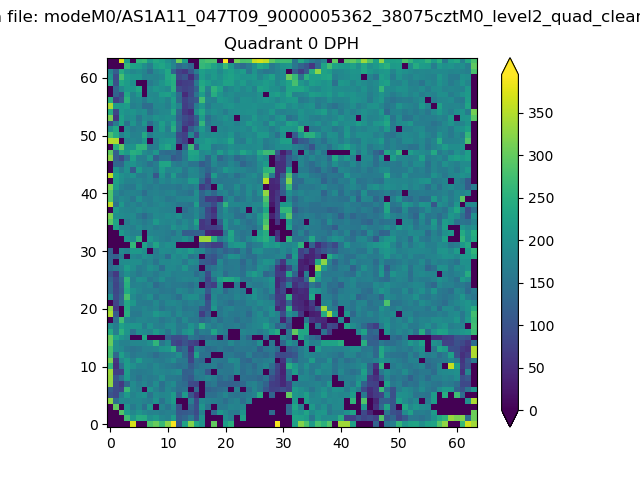 |
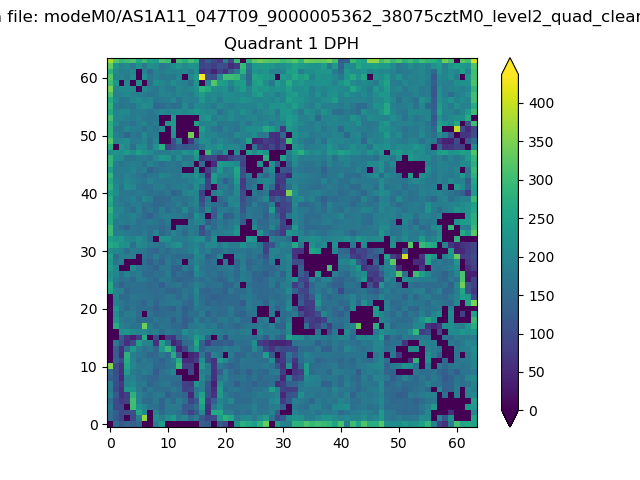 |
Quadrant B |
|---|---|---|---|
| Quadrant D | 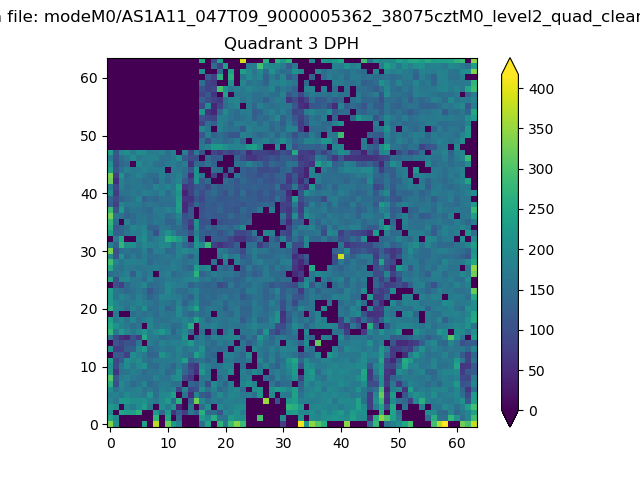 |
 |
Quadrant C |
| Plot type | Count rate plots | Images |
|---|---|---|
| Comparison with Poisson distribution Blue bars denote a histogram of data divided into 1 sec bins. Red curve is a Poisson curve with rate = median count rate of data. |
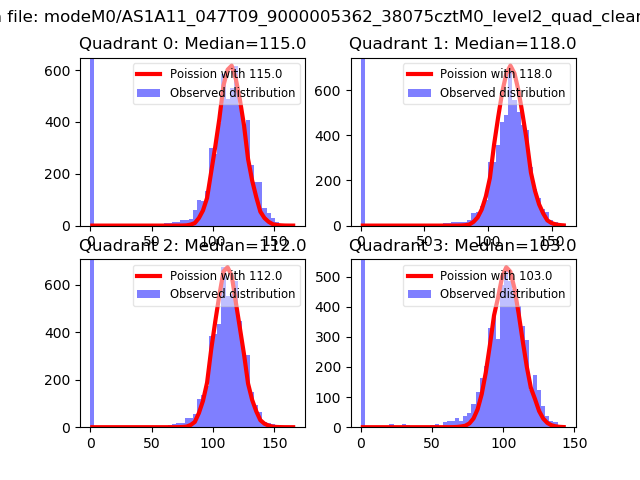 |
 |
| Quadrant-wise count rates Data is divided into 100 sec bins |
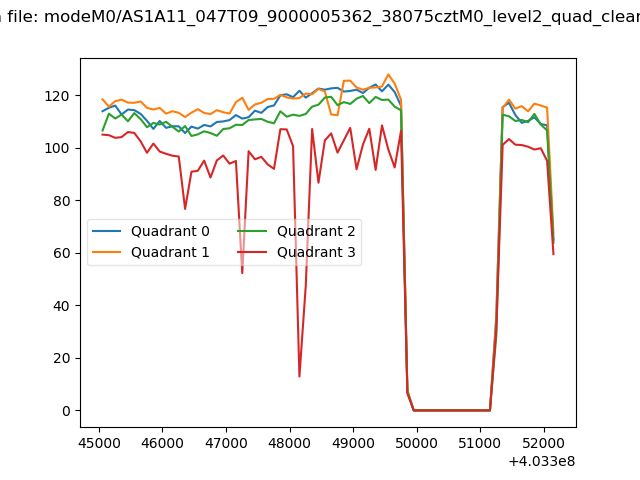 |
|
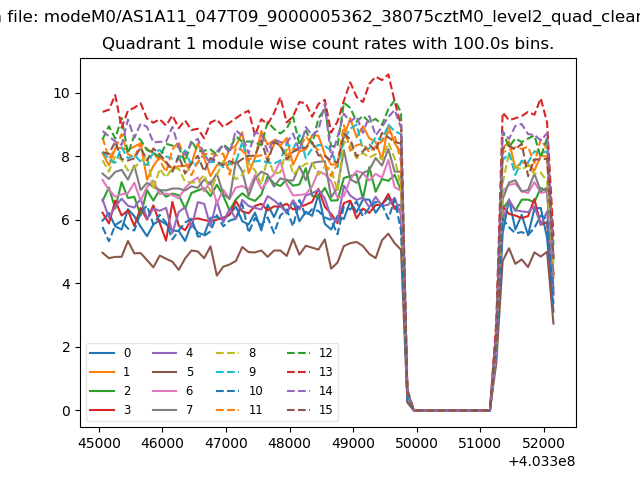
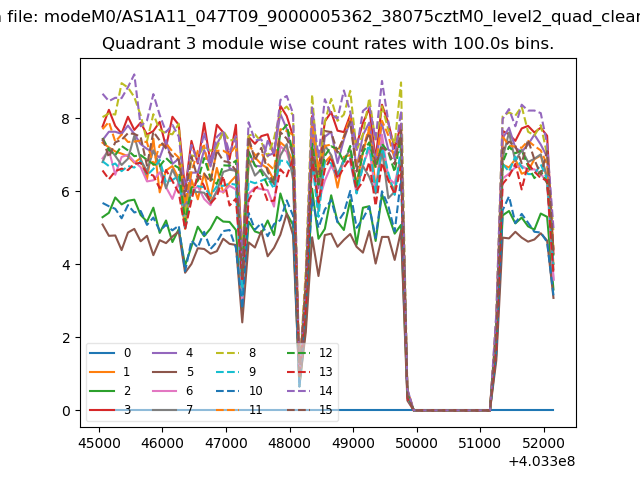
| Module-wise count rates for Quadrant A Data is divided into 100 sec bins |
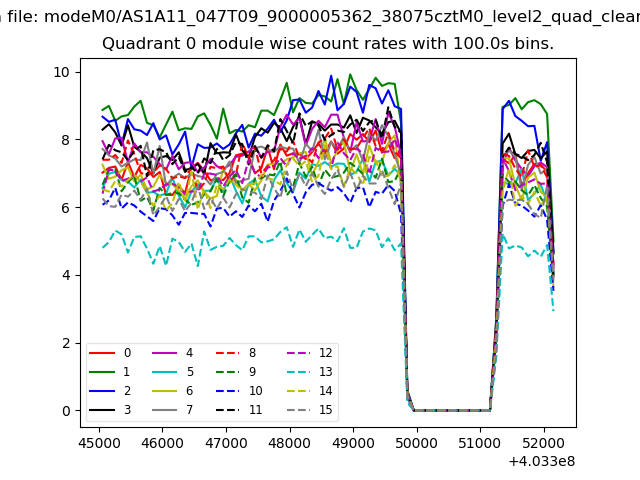 |
 |
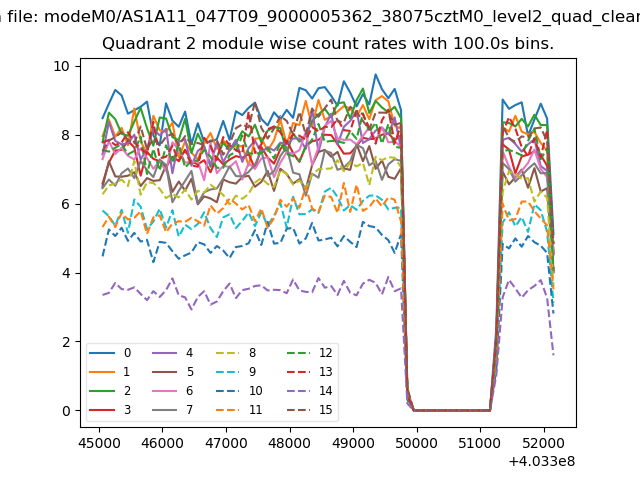
| Module-wise count rates for Quadrant B Data is divided into 100 sec bins |
 |
 |
| Module-wise count rates for Quadrant C Data is divided into 100 sec bins |
 |
 |
| Module-wise count rates for Quadrant D Data is divided into 100 sec bins |
 |
 |
| Parameter | Plot |
|---|---|
| CZT HV Monitor | 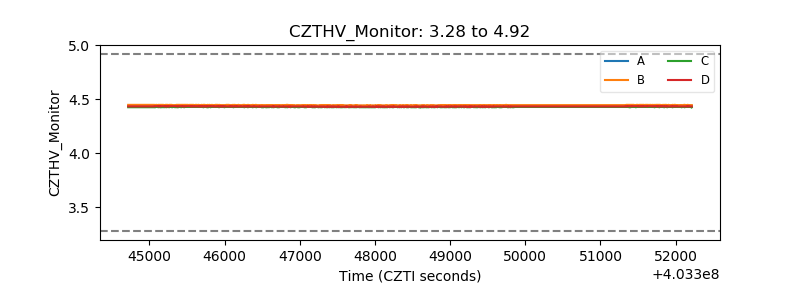 |
| D_VDD | 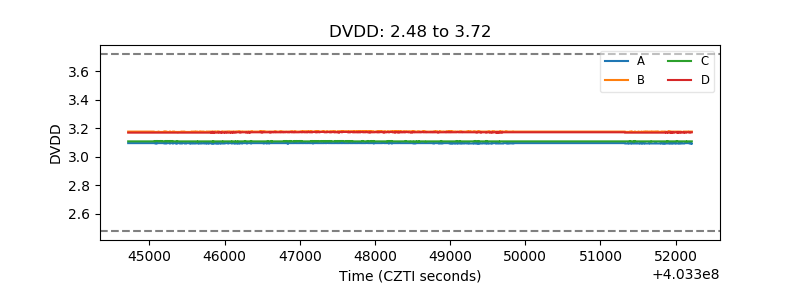 |
| Temperature 1 | 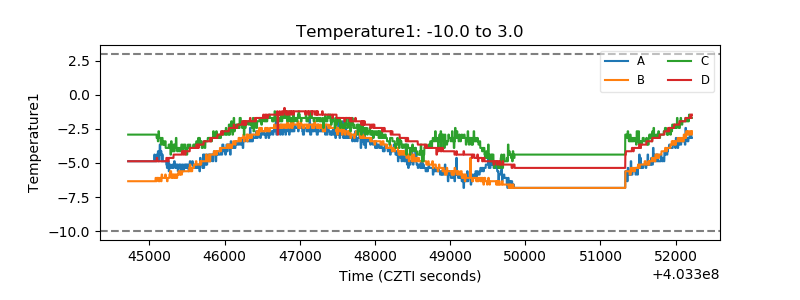 |
| Veto HV Monitor | 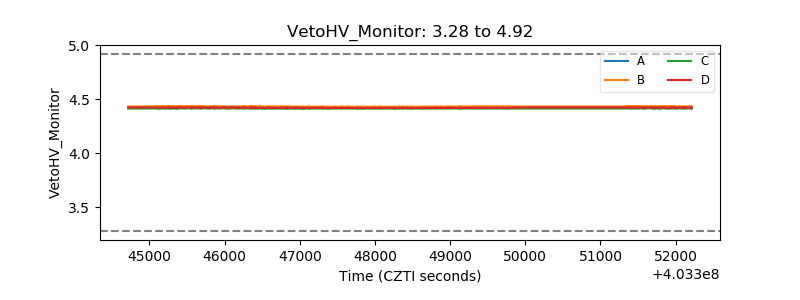 |
| Veto LLD | 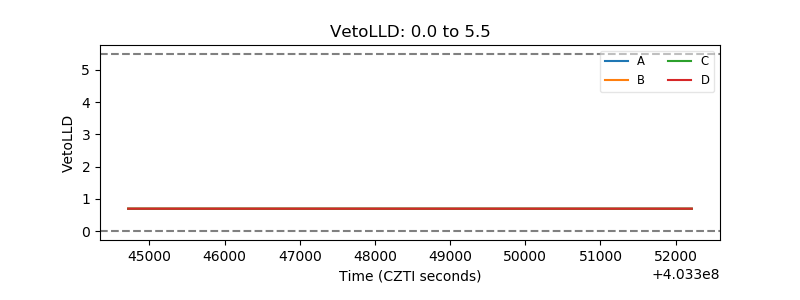 |
| Alpha Counter | 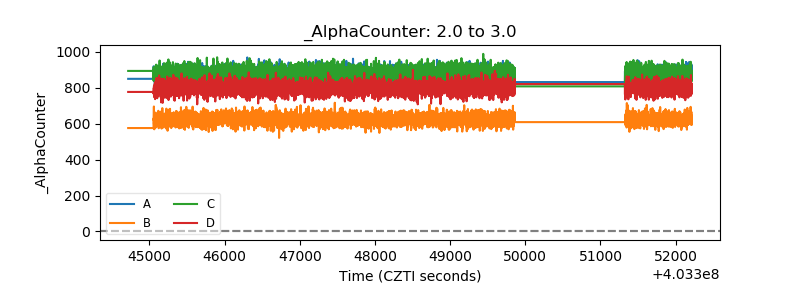 |
| _CPM_Rate | 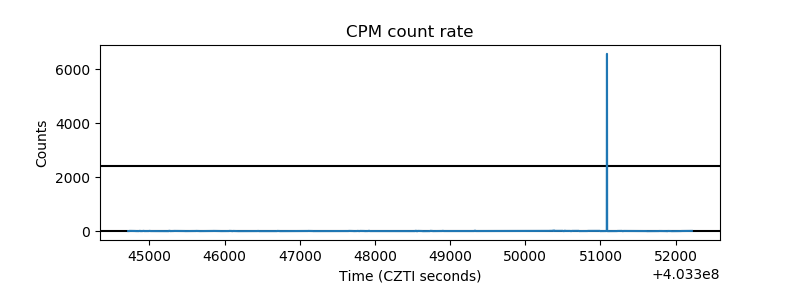 |
| CZT Counter | 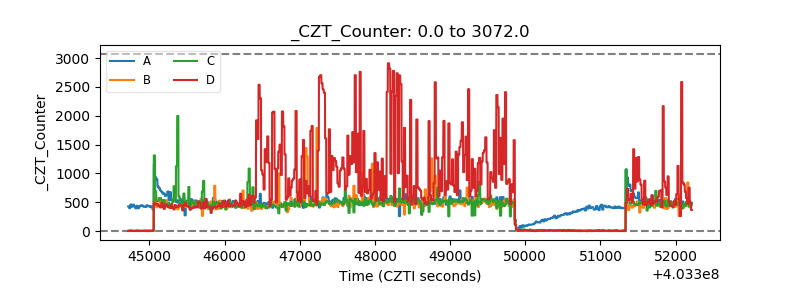 |
| +2.5 Volts monitor | 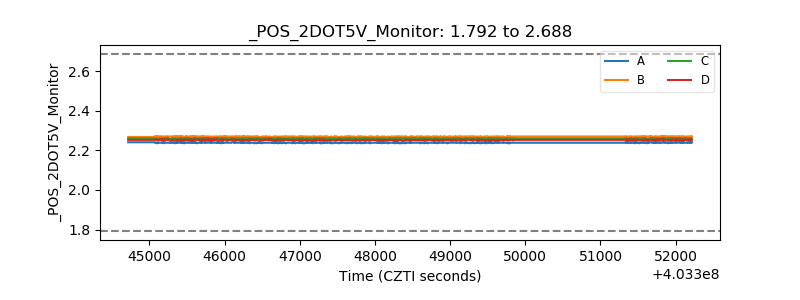 |
| +5 Volts monitor |  |
| _ROLL_ROT | 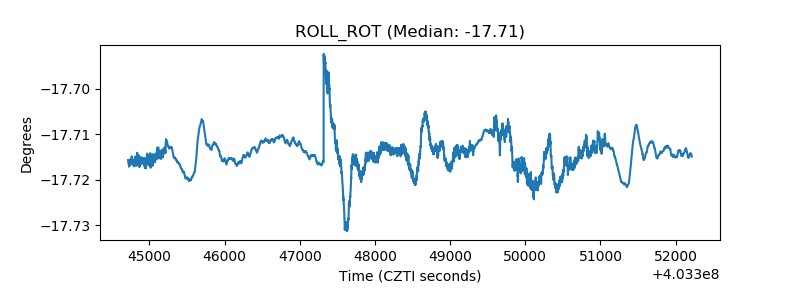 |
| _Roll_DEC | 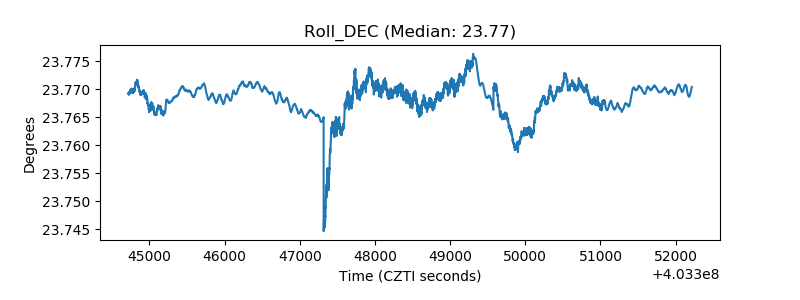 |
| _Roll_RA | 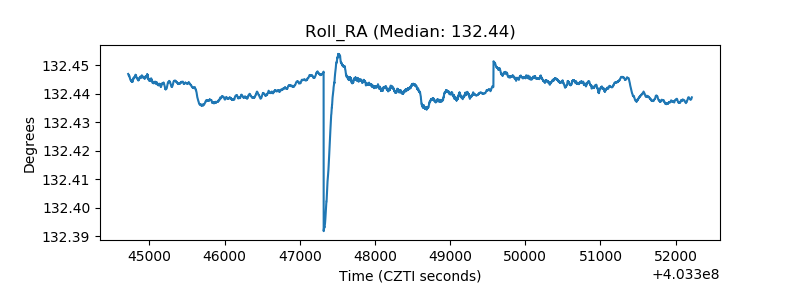 |
| Veto Counter | 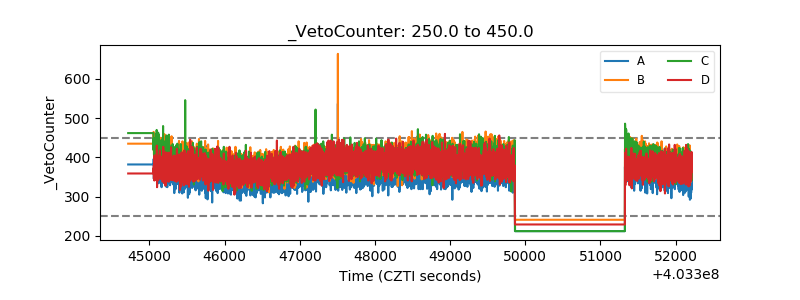 |