| Param | Original file | Final file |
|---|---|---|
| Filename | modeM0/AS1A11_047T09_9000005362_38076cztM0_level2.fits | modeM0/AS1A11_047T09_9000005362_38076cztM0_level2_quad_clean.evt |
| Size (bytes) | 428,446,080 | 97,450,560 |
| Size | 408.6 MB | 92.9 MB |
| Events in quadrant A | 3,090,378 | 670,431 |
| Events in quadrant B | 3,044,271 | 685,299 |
| Events in quadrant C | 2,934,139 | 651,878 |
| Events in quadrant D | 6,332,428 | 530,864 |
| Mode M0 | |||
|---|---|---|---|
| Quadrant | BADHDUFLAG | Total packets | Discarded packets |
| A | 0 | 12473 | 3 |
| B | 0 | 12715 | 2 |
| C | 0 | 12080 | 2 |
| D | 0 | 22864 | 2 |
| Mode SS | |||
|---|---|---|---|
| Quadrant | BADHDUFLAG | Total packets | Discarded packets |
| A | 0 | 120 | 0 |
| B | 0 | 120 | 0 |
| C | 0 | 120 | 0 |
| D | 0 | 120 | 0 |
| Mode M9 | |||
|---|---|---|---|
| Quadrant | BADHDUFLAG | Total packets | Discarded packets |
| A | 0 | 18 | 0 |
| B | 0 | 18 | 0 |
| C | 0 | 18 | 0 |
| D | 0 | 19 | 0 |
| Quadrant | Total seconds | Saturated seconds | Saturation percentage |
|---|---|---|---|
| A | 5897 | 11 | 0.186536% |
| B | 5897 | 27 | 0.457860% |
| C | 5897 | 13 | 0.220451% |
| D | 5897 | 839 | 14.227573% |
Noise dominated data is calculated using 1-second bins in cleaned event files. If a bin has >2000 counts, and if more than 50% of those come from <1% of pixels, then it is considered to be noise-dominated and hence unusable.
| Quadrant | # 1 sec bins | Bins with >0 counts | Bins with >2000 counts | High rate bins dominated by noise | Noise dominated (total time) | Noise dominated (detector-on time) | Marked lightcurve |
|---|---|---|---|---|---|---|---|
| A | 7210 | 5898 | 1 | 1 | 0.01% | 0.02% | 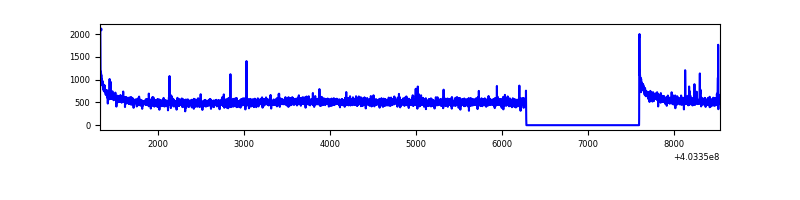 |
| B | 7210 | 5898 | 19 | 19 | 0.26% | 0.32% | 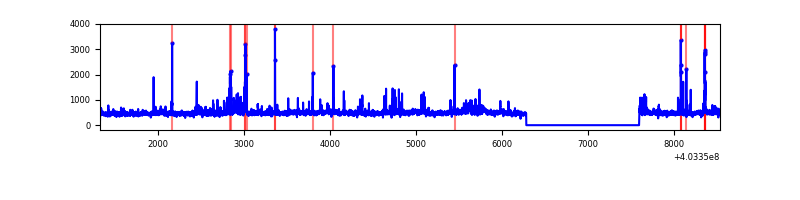 |
| C | 7210 | 5898 | 4 | 4 | 0.06% | 0.07% | 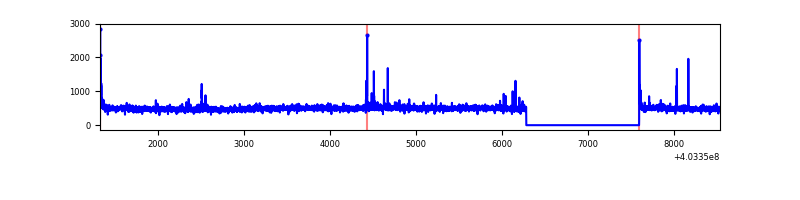 |
| D | 7210 | 5898 | 783 | 783 | 10.86% | 13.28% | 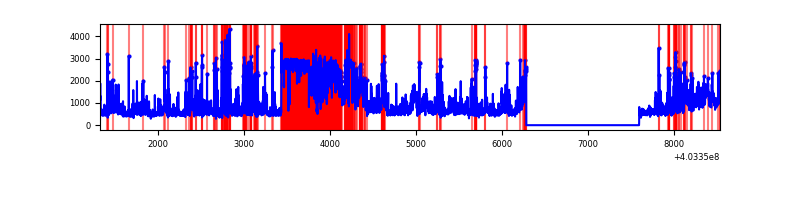 |
Top three noisy pixels from each quadrant. If the there are fewer than three noisy pixels in the level2.evt file, extra rows are filled as -1
| Pixel properties | Quadrant properties | ||||||
|---|---|---|---|---|---|---|---|
| Quadrant | DetID | PixID | Counts | Sigma | Mean | Median | Sigma |
| A | 10 | 83 | 385167 | 2746.44 | 688 | 675 | 140.0 |
| A | 9 | 143 | 13857 | 94.16 | 688 | 675 | 140.0 |
| A | 12 | 189 | 11780 | 79.32 | 688 | 675 | 140.0 |
| B | 0 | 229 | 146306 | 1102.88 | 681 | 662 | 132.1 |
| B | 4 | 171 | 53922 | 403.31 | 681 | 662 | 132.1 |
| B | 0 | 189 | 49302 | 368.32 | 681 | 662 | 132.1 |
| C | 15 | 214 | 246752 | 1562.52 | 668 | 669 | 157.5 |
| C | 0 | 10 | 29171 | 180.98 | 668 | 669 | 157.5 |
| C | 1 | 23 | 27979 | 173.41 | 668 | 669 | 157.5 |
| D | 12 | 227 | 1567685 | 10215.27 | 621 | 602 | 153.4 |
| D | 1 | 52 | 1300726 | 8475.06 | 621 | 602 | 153.4 |
| D | 13 | 249 | 390419 | 2541.08 | 621 | 602 | 153.4 |
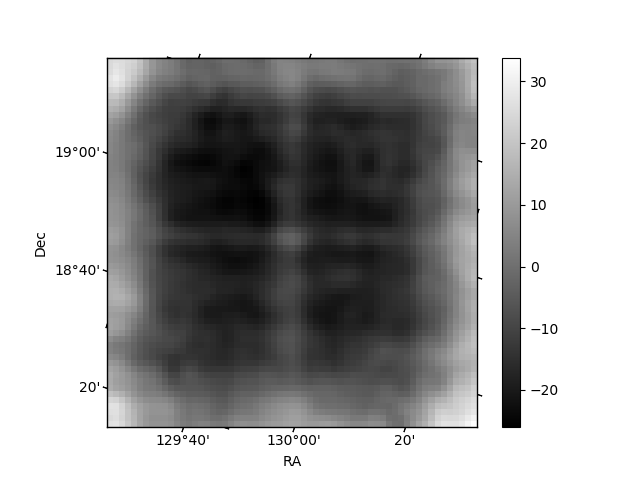
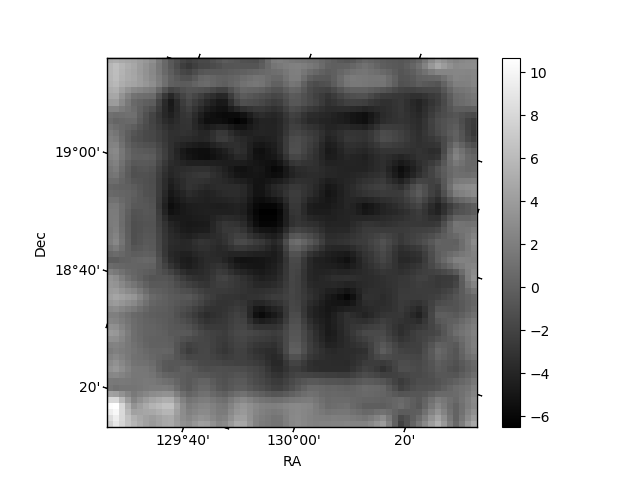
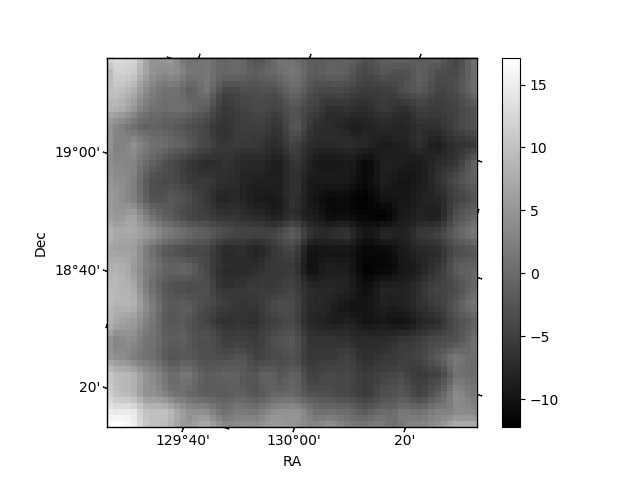
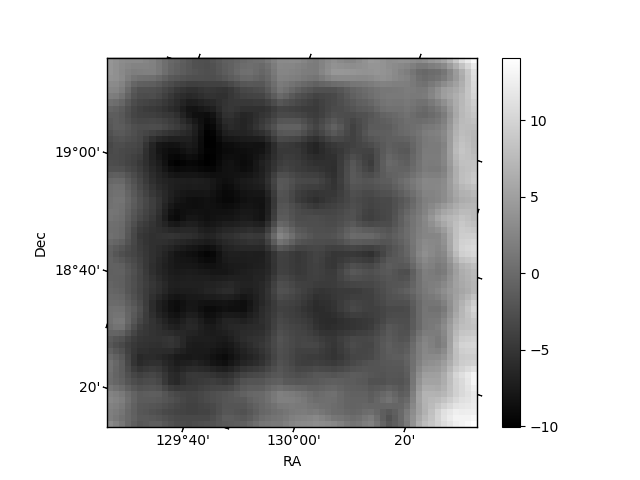
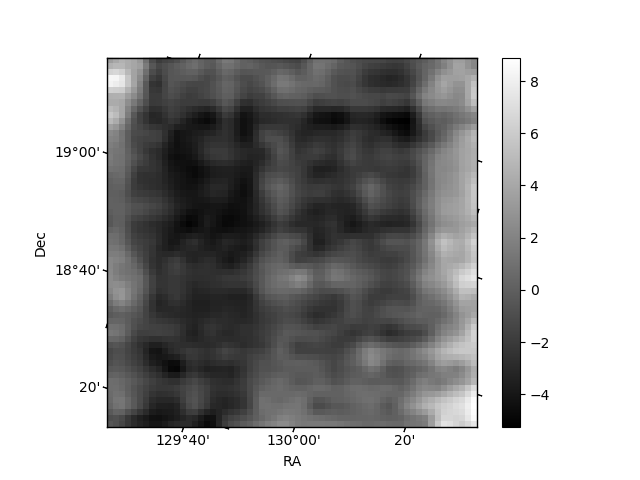
Histogram calculated using DETX and DETY for each event in the final _common_clean file
| Quadrant A | 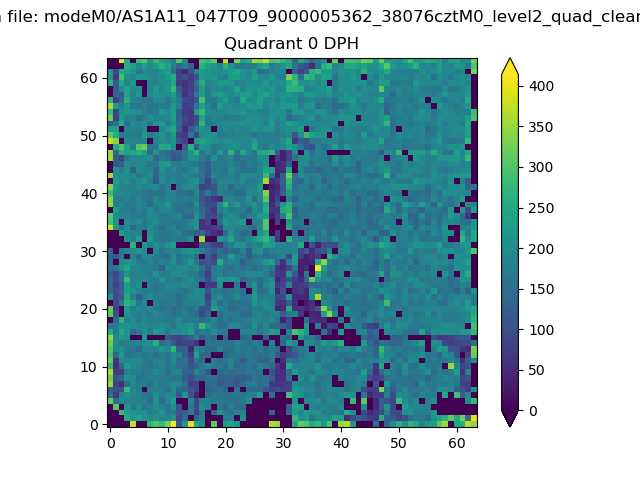 |
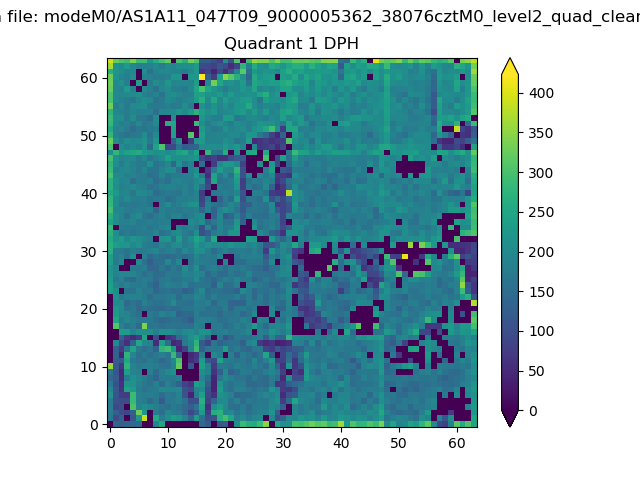 |
Quadrant B |
|---|---|---|---|
| Quadrant D | 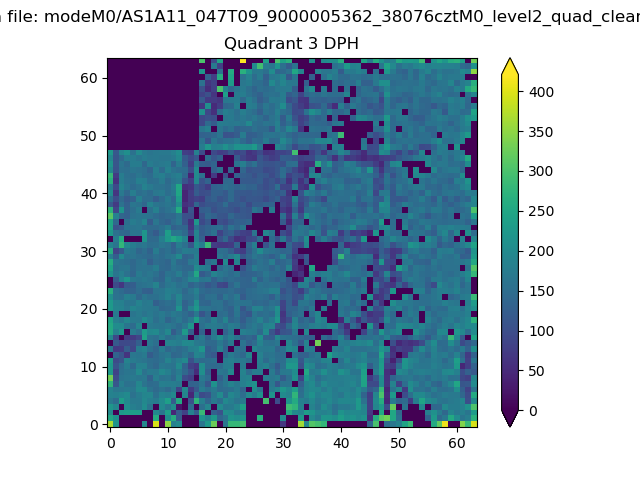 |
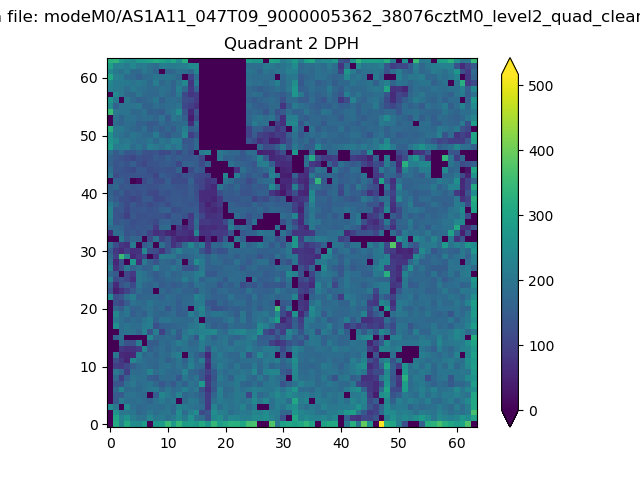 |
Quadrant C |
| Plot type | Count rate plots | Images |
|---|---|---|
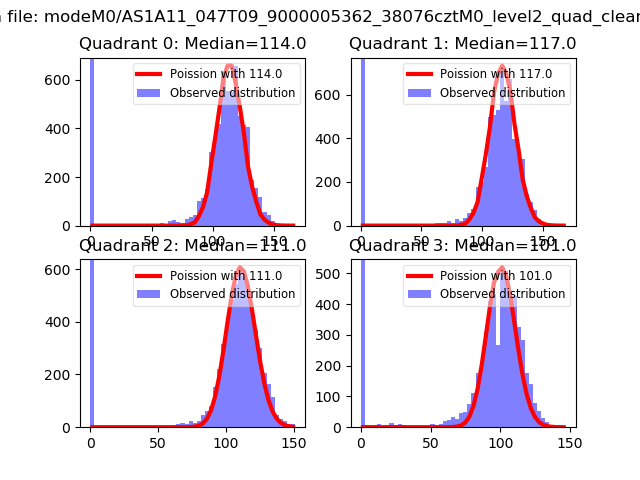
| Comparison with Poisson distribution Blue bars denote a histogram of data divided into 1 sec bins. Red curve is a Poisson curve with rate = median count rate of data. |
 |
 |
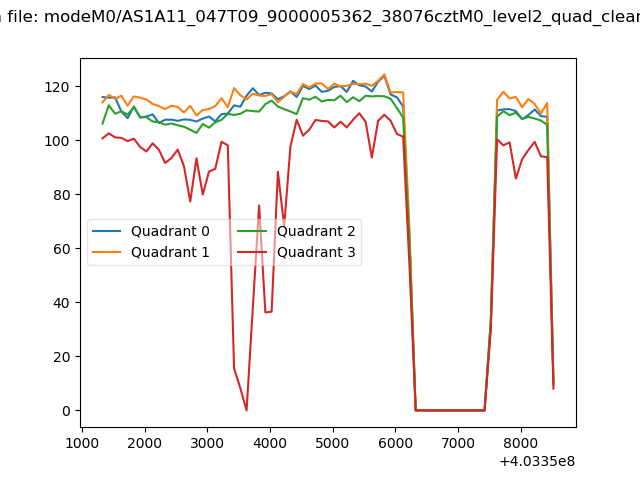
| Quadrant-wise count rates Data is divided into 100 sec bins |
 |
|
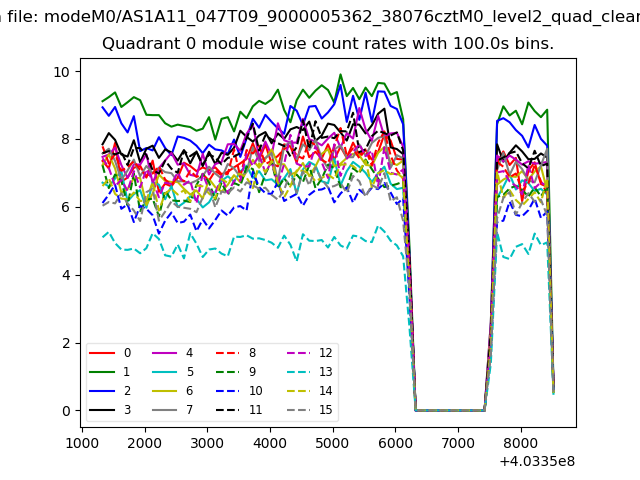
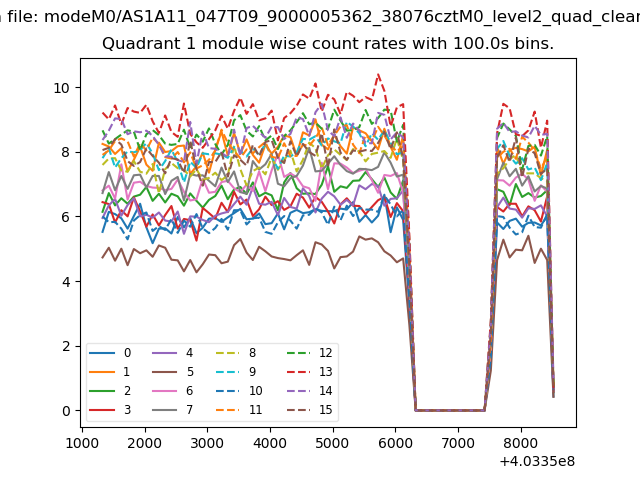
| Module-wise count rates for Quadrant A Data is divided into 100 sec bins |
 |
 |
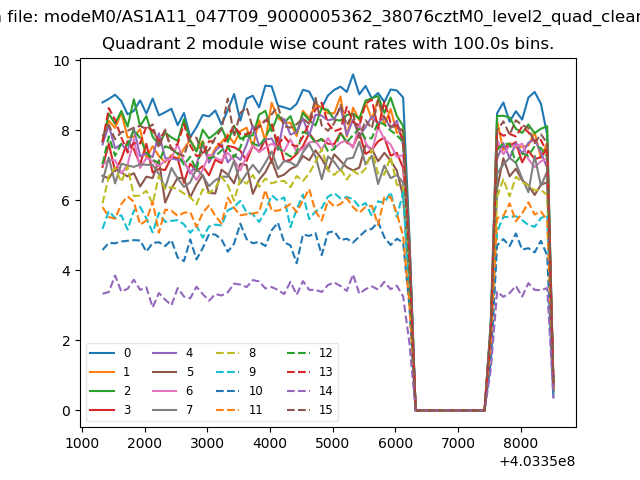
| Module-wise count rates for Quadrant B Data is divided into 100 sec bins |
 |
 |
| Module-wise count rates for Quadrant C Data is divided into 100 sec bins |
 |
 |
| Module-wise count rates for Quadrant D Data is divided into 100 sec bins |
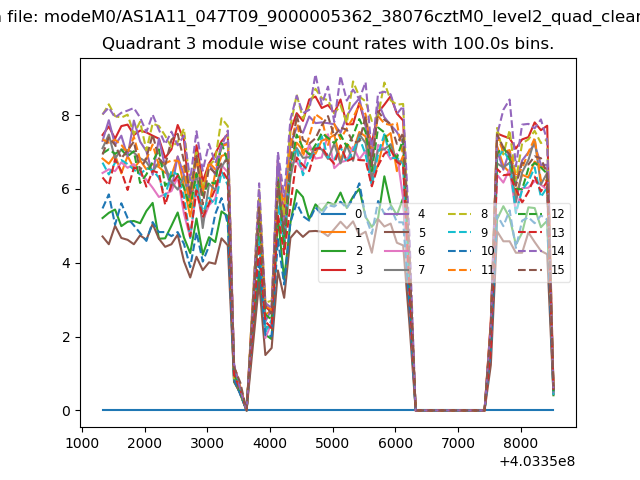 |
 |
| Parameter | Plot |
|---|---|
| CZT HV Monitor | 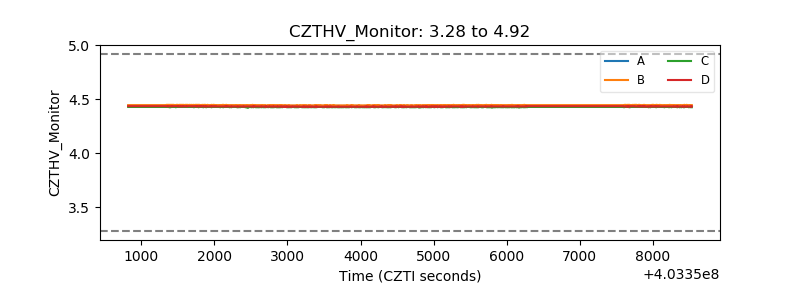 |
| D_VDD | 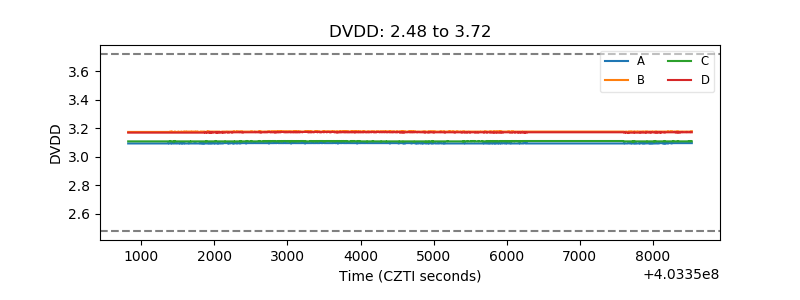 |
| Temperature 1 | 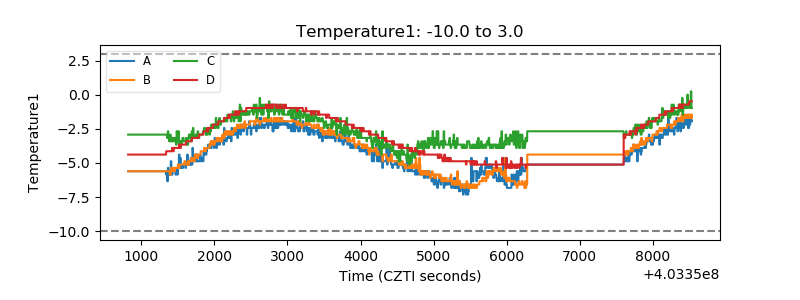 |
| Veto HV Monitor |  |
| Veto LLD | 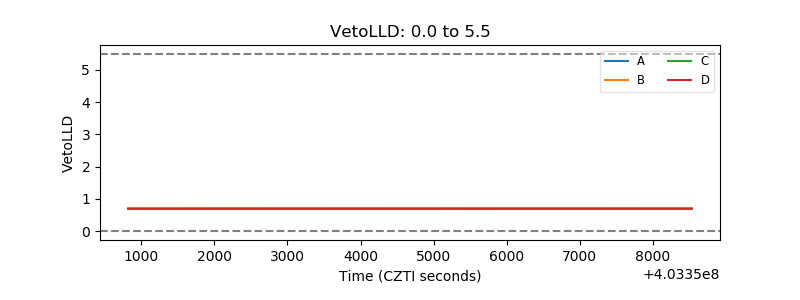 |
| Alpha Counter | 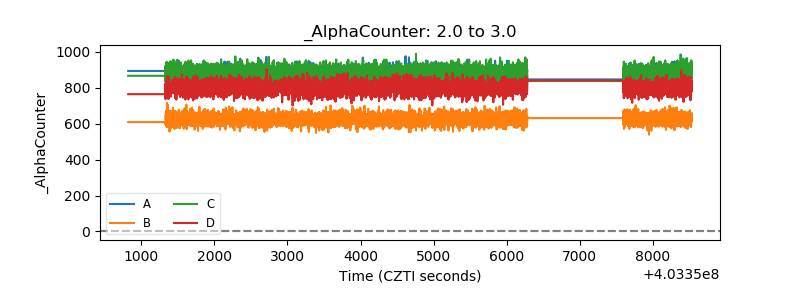 |
| _CPM_Rate | 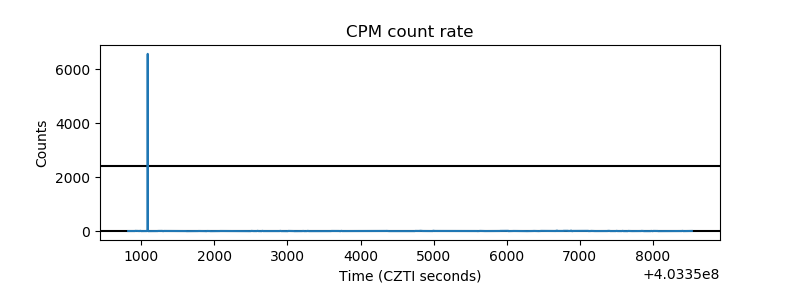 |
| CZT Counter | 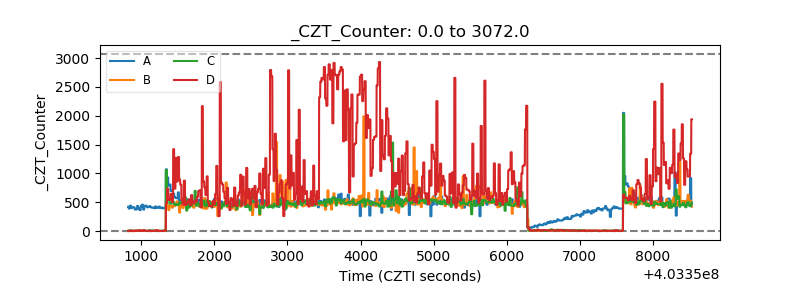 |
| +2.5 Volts monitor | 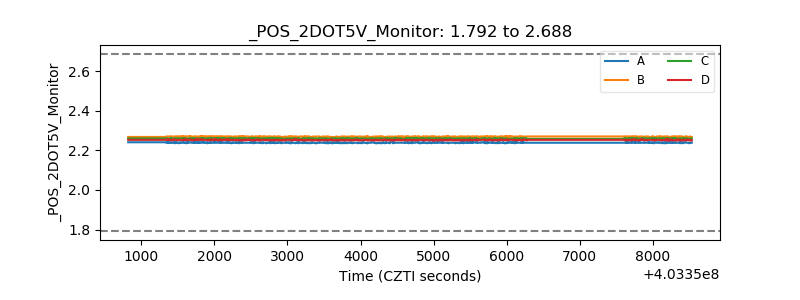 |
| +5 Volts monitor | 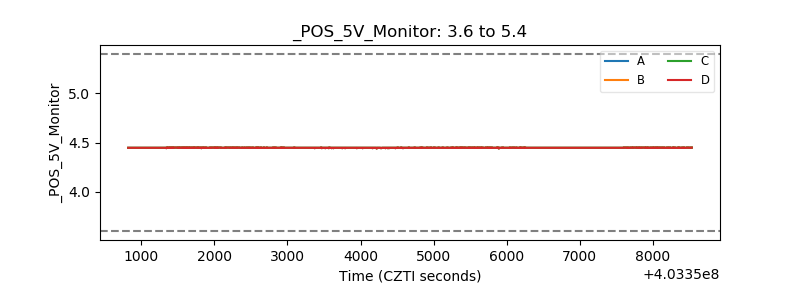 |
| _ROLL_ROT | 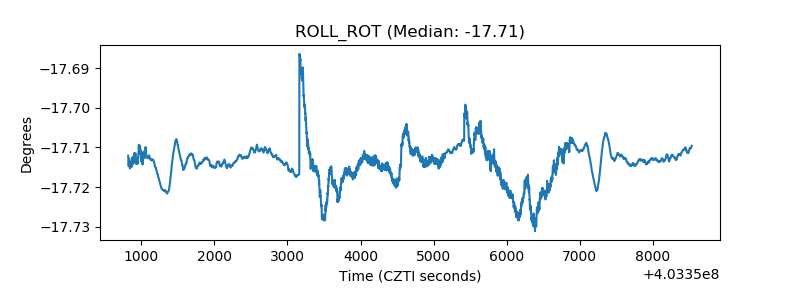 |
| _Roll_DEC | 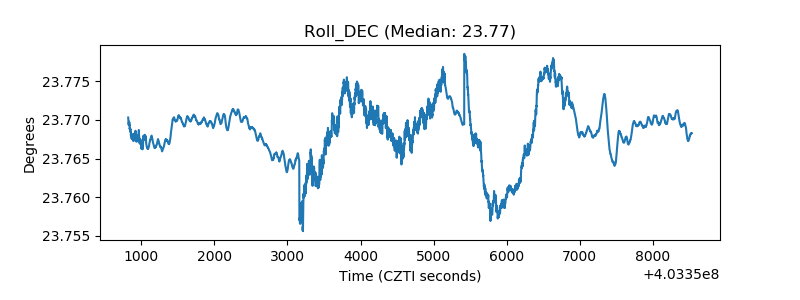 |
| _Roll_RA | 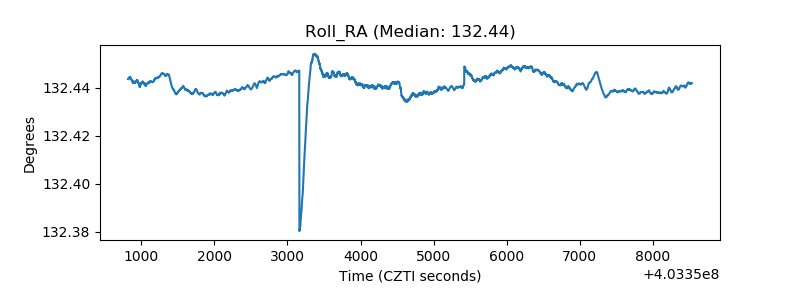 |
| Veto Counter | 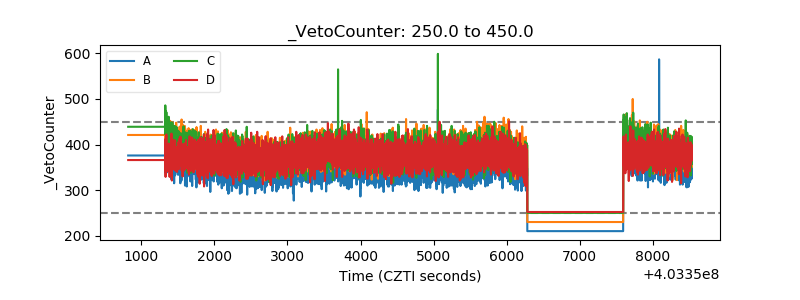 |