| Param | Original file | Final file |
|---|---|---|
| Filename | modeM0/AS1A11_047T09_9000005362_38081cztM0_level2.fits | modeM0/AS1A11_047T09_9000005362_38081cztM0_level2_quad_clean.evt |
| Size (bytes) | 880,001,280 | 160,868,160 |
| Size | 839.2 MB | 153.4 MB |
| Events in quadrant A | 5,733,980 | 1,177,846 |
| Events in quadrant B | 5,064,349 | 1,188,477 |
| Events in quadrant C | 5,019,693 | 1,138,657 |
| Events in quadrant D | 15,985,918 | 676,449 |
| Mode M0 | |||
|---|---|---|---|
| Quadrant | BADHDUFLAG | Total packets | Discarded packets |
| A | 0 | 23282 | 3 |
| B | 0 | 21512 | 2 |
| C | 0 | 20945 | 2 |
| D | 0 | 54331 | 2 |
| Mode SS | |||
|---|---|---|---|
| Quadrant | BADHDUFLAG | Total packets | Discarded packets |
| A | 0 | 202 | 0 |
| B | 0 | 202 | 0 |
| C | 0 | 202 | 0 |
| D | 0 | 202 | 0 |
| Mode M9 | |||
|---|---|---|---|
| Quadrant | BADHDUFLAG | Total packets | Discarded packets |
| A | 0 | 33 | 0 |
| B | 0 | 33 | 0 |
| C | 0 | 33 | 0 |
| D | 0 | 33 | 0 |
| Quadrant | Total seconds | Saturated seconds | Saturation percentage |
|---|---|---|---|
| A | 9950 | 51 | 0.512563% |
| B | 9950 | 61 | 0.613065% |
| C | 9950 | 21 | 0.211055% |
| D | 9950 | 4109 | 41.296482% |
Noise dominated data is calculated using 1-second bins in cleaned event files. If a bin has >2000 counts, and if more than 50% of those come from <1% of pixels, then it is considered to be noise-dominated and hence unusable.
| Quadrant | # 1 sec bins | Bins with >0 counts | Bins with >2000 counts | High rate bins dominated by noise | Noise dominated (total time) | Noise dominated (detector-on time) | Marked lightcurve |
|---|---|---|---|---|---|---|---|
| A | 13236 | 9952 | 18 | 18 | 0.14% | 0.18% |  |
| B | 13236 | 9952 | 24 | 24 | 0.18% | 0.24% | 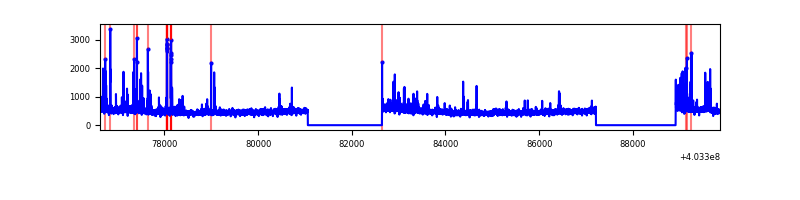 |
| C | 13236 | 9952 | 13 | 13 | 0.10% | 0.13% | 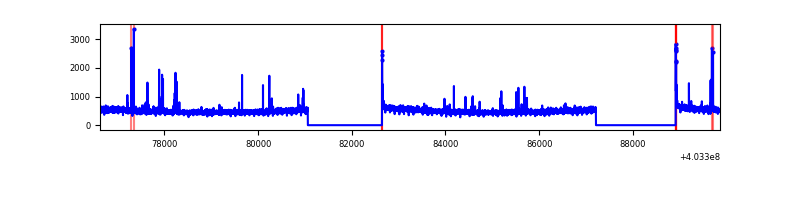 |
| D | 13236 | 9952 | 3996 | 3996 | 30.19% | 40.15% | 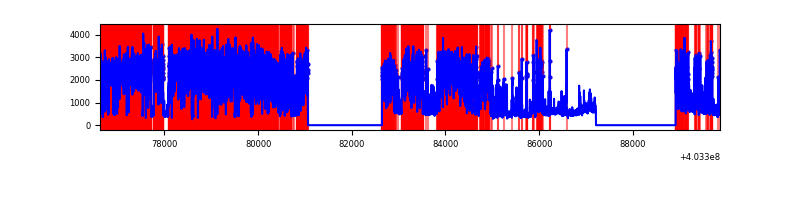 |
Top three noisy pixels from each quadrant. If the there are fewer than three noisy pixels in the level2.evt file, extra rows are filled as -1
| Pixel properties | Quadrant properties | ||||||
|---|---|---|---|---|---|---|---|
| Quadrant | DetID | PixID | Counts | Sigma | Mean | Median | Sigma |
| A | 10 | 83 | 583436 | 2479.42 | 1166 | 1144 | 234.8 |
| A | 12 | 16 | 297791 | 1263.14 | 1166 | 1144 | 234.8 |
| A | 15 | 222 | 92264 | 387.99 | 1166 | 1144 | 234.8 |
| B | 0 | 229 | 279076 | 1250.16 | 1160 | 1129 | 222.3 |
| B | 5 | 172 | 60317 | 266.22 | 1160 | 1129 | 222.3 |
| B | 0 | 189 | 39157 | 171.04 | 1160 | 1129 | 222.3 |
| C | 15 | 214 | 401267 | 1510.14 | 1139 | 1148 | 265.0 |
| C | 14 | 254 | 55355 | 204.59 | 1139 | 1148 | 265.0 |
| C | 1 | 23 | 52856 | 195.16 | 1139 | 1148 | 265.0 |
| D | 1 | 52 | 9553546 | 39304.53 | 991 | 964 | 243.0 |
| D | 13 | 138 | 1056692 | 4343.84 | 991 | 964 | 243.0 |
| D | 12 | 233 | 411946 | 1691.0 | 991 | 964 | 243.0 |
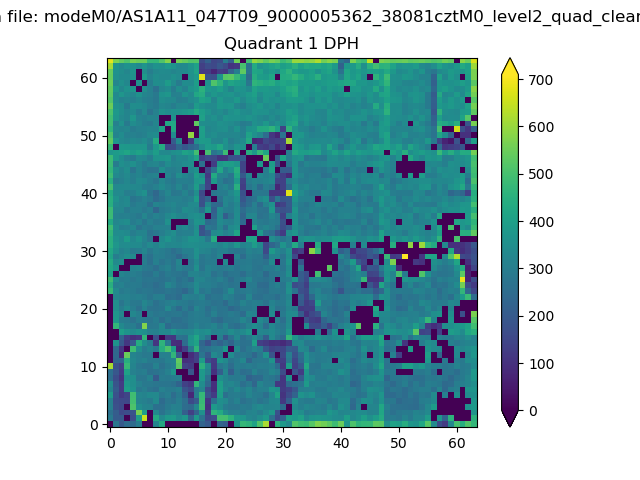
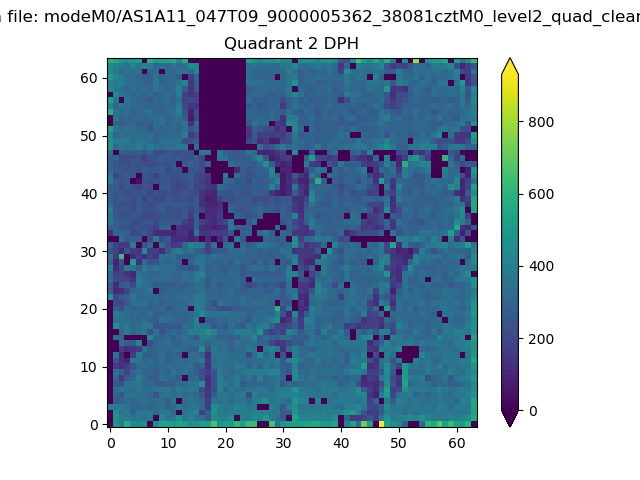
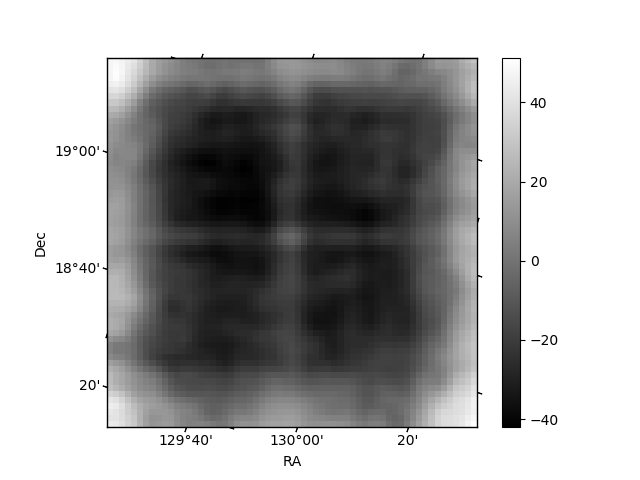
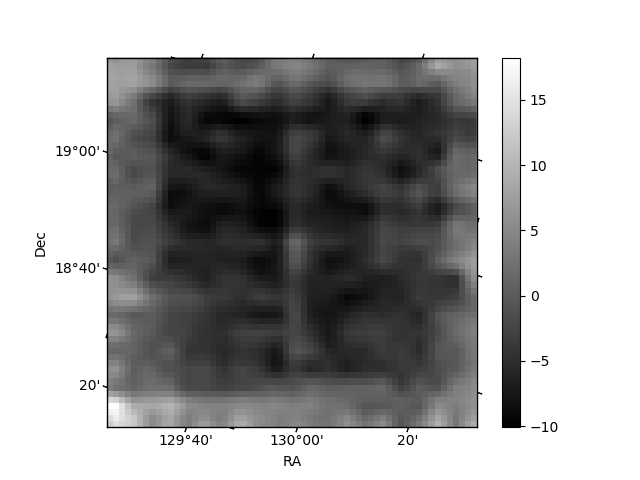
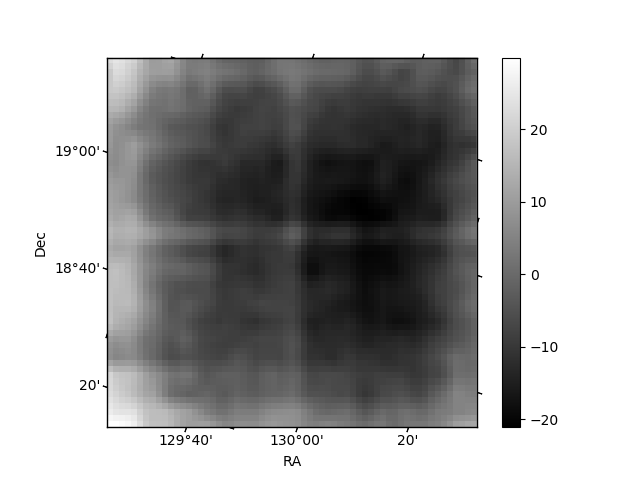
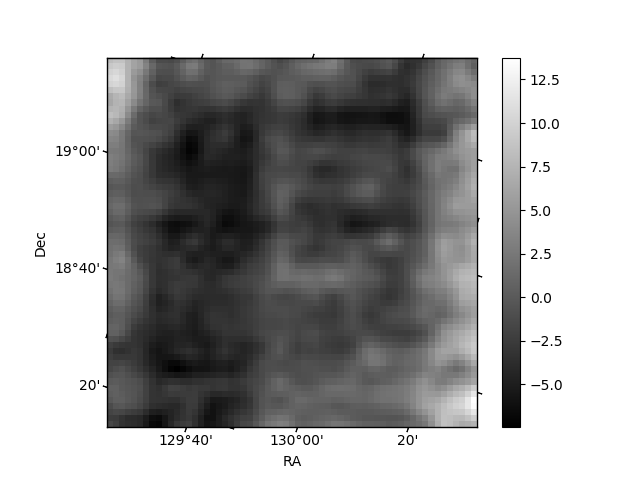
Histogram calculated using DETX and DETY for each event in the final _common_clean file
| Quadrant A | 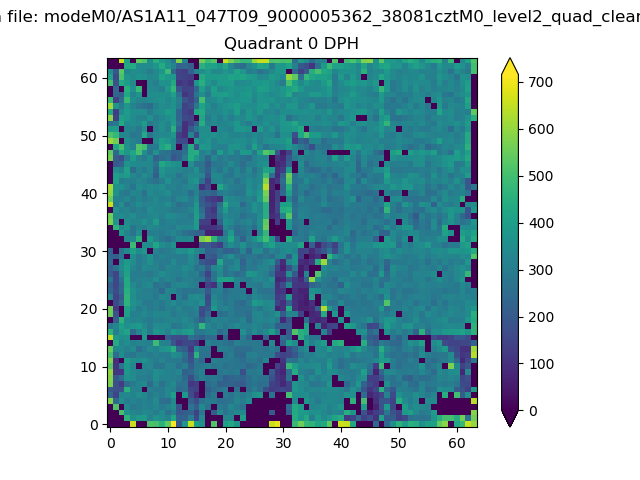 |
 |
Quadrant B |
|---|---|---|---|
| Quadrant D | 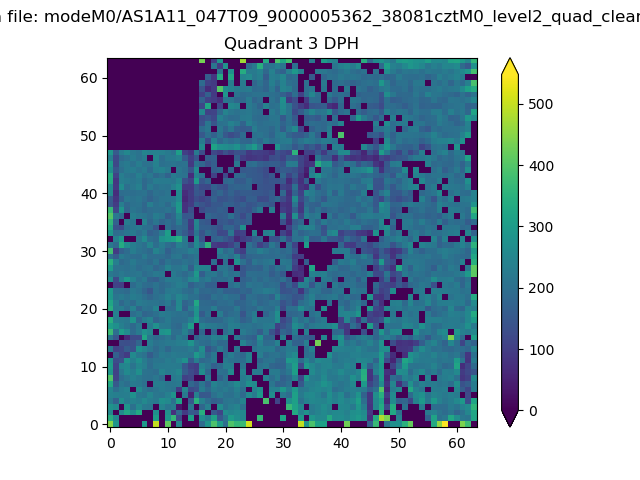 |
 |
Quadrant C |
| Plot type | Count rate plots | Images |
|---|---|---|
| Comparison with Poisson distribution Blue bars denote a histogram of data divided into 1 sec bins. Red curve is a Poisson curve with rate = median count rate of data. |
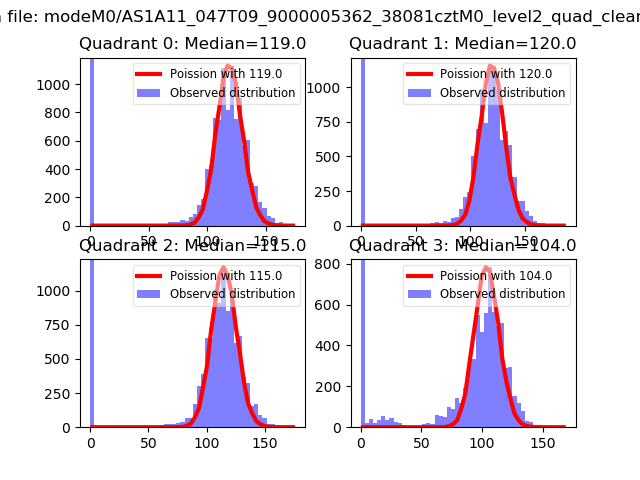 |
 |
| Quadrant-wise count rates Data is divided into 100 sec bins |
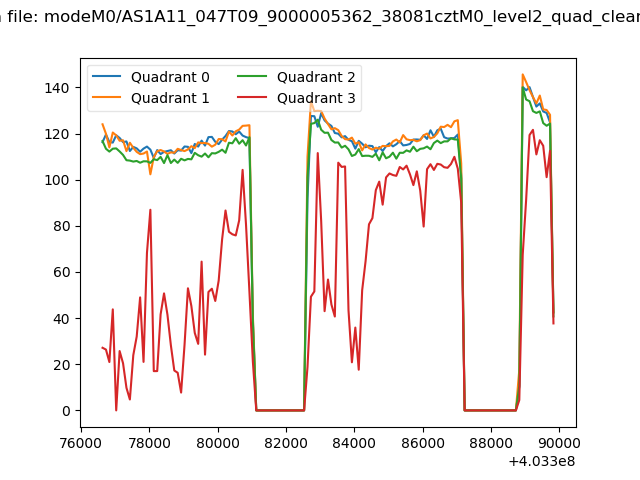 |
|
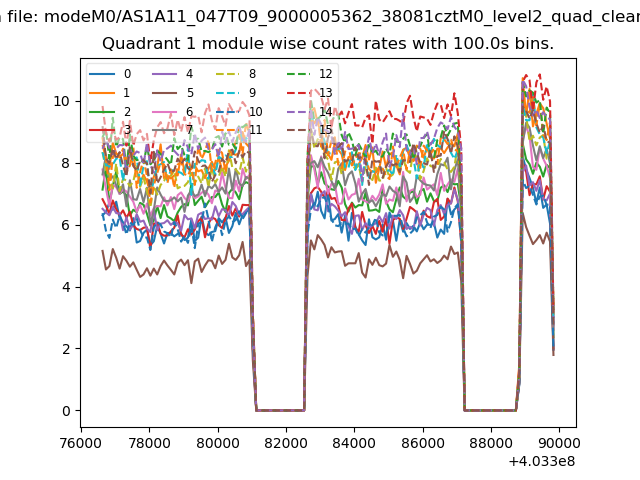
| Module-wise count rates for Quadrant A Data is divided into 100 sec bins |
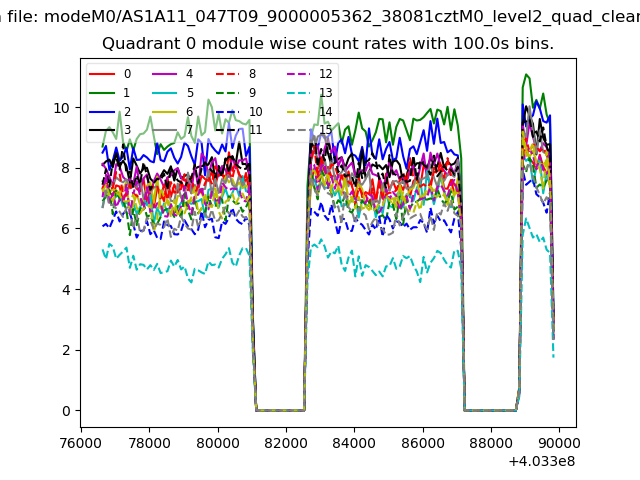 |
 |
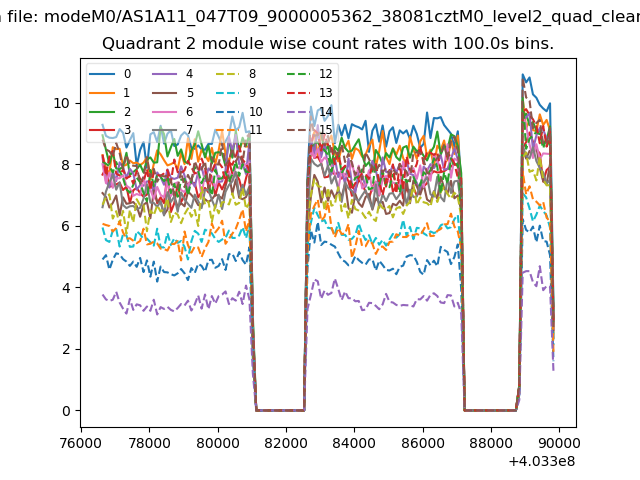
| Module-wise count rates for Quadrant B Data is divided into 100 sec bins |
 |
 |
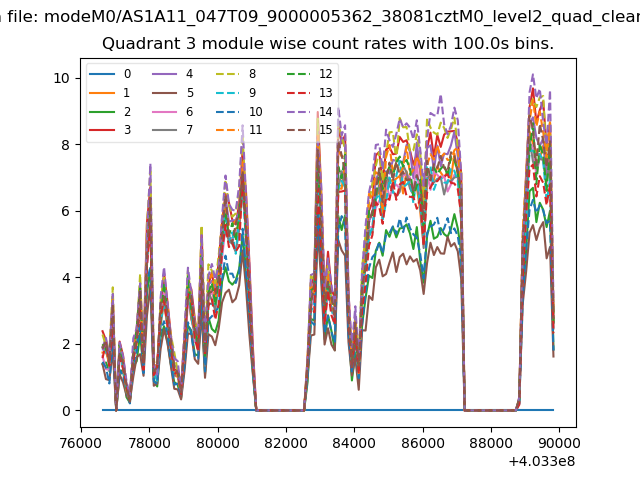
| Module-wise count rates for Quadrant C Data is divided into 100 sec bins |
 |
 |
| Module-wise count rates for Quadrant D Data is divided into 100 sec bins |
 |
 |
| Parameter | Plot |
|---|---|
| CZT HV Monitor | 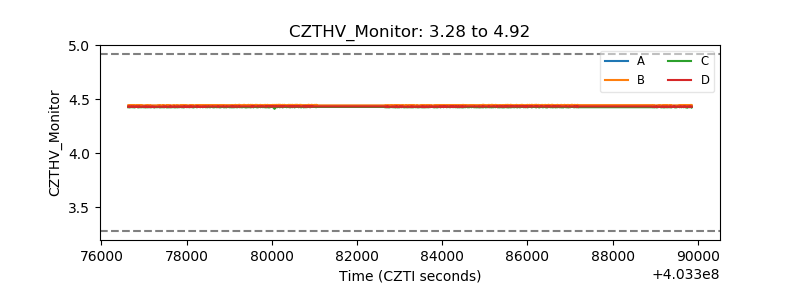 |
| D_VDD | 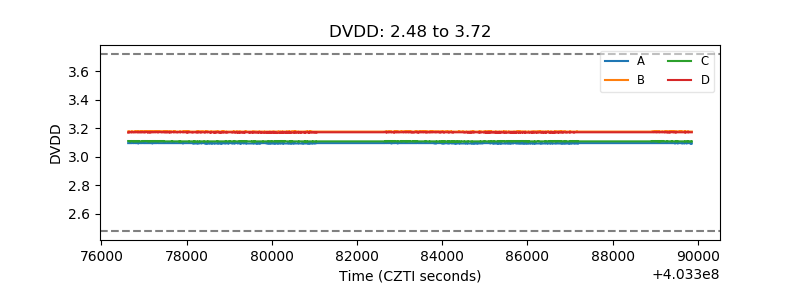 |
| Temperature 1 | 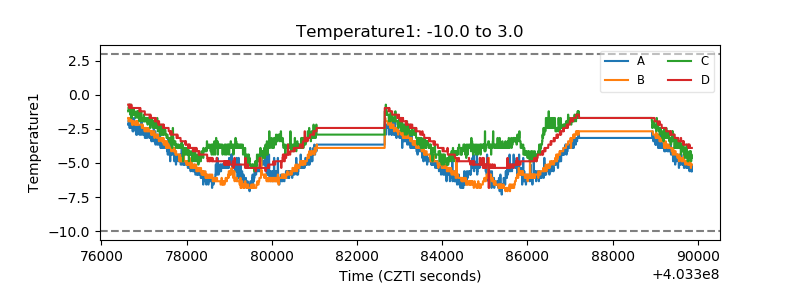 |
| Veto HV Monitor | 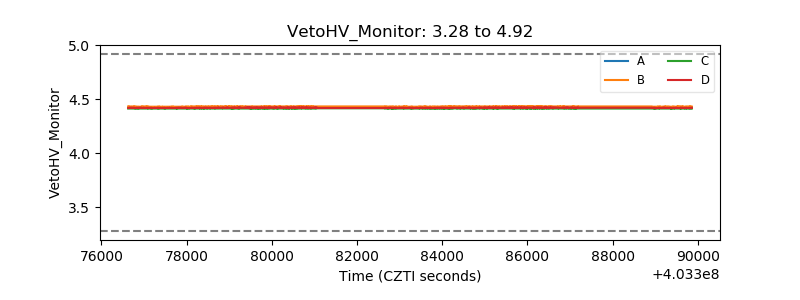 |
| Veto LLD | 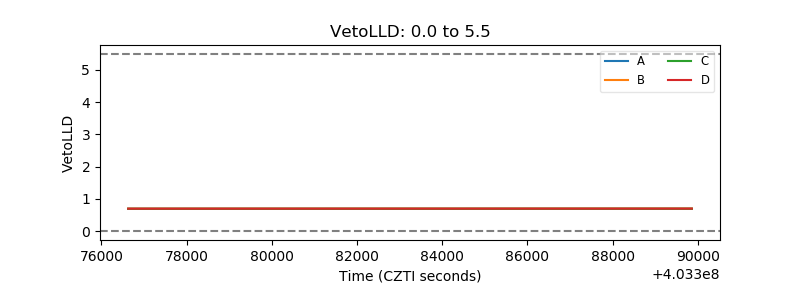 |
| Alpha Counter | 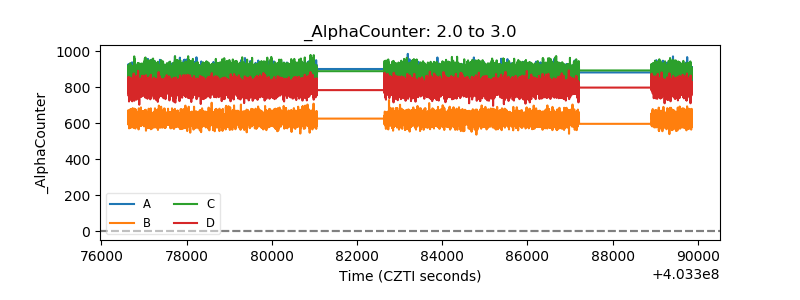 |
| _CPM_Rate | 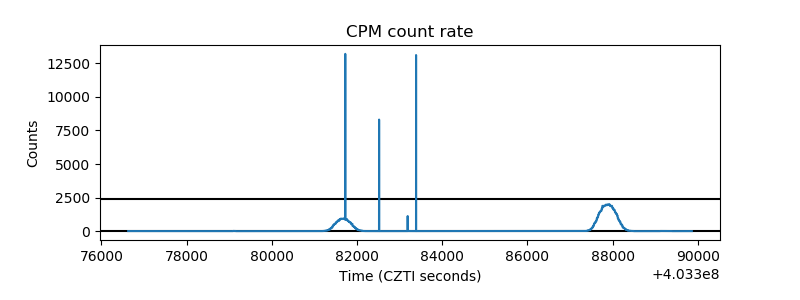 |
| CZT Counter | 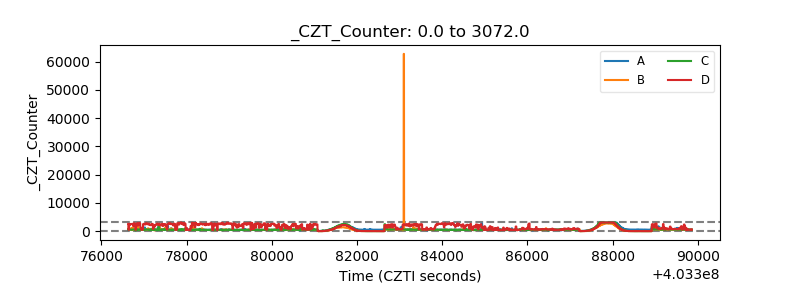 |
| +2.5 Volts monitor | 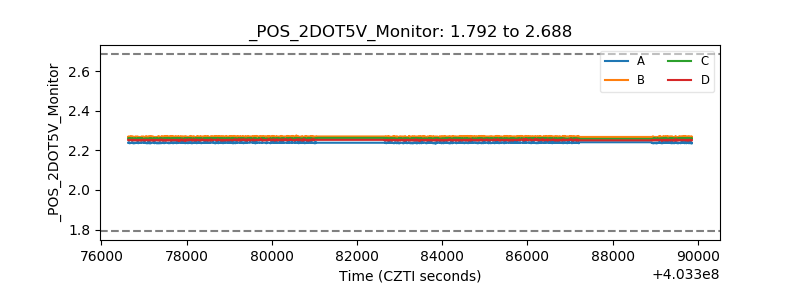 |
| +5 Volts monitor | 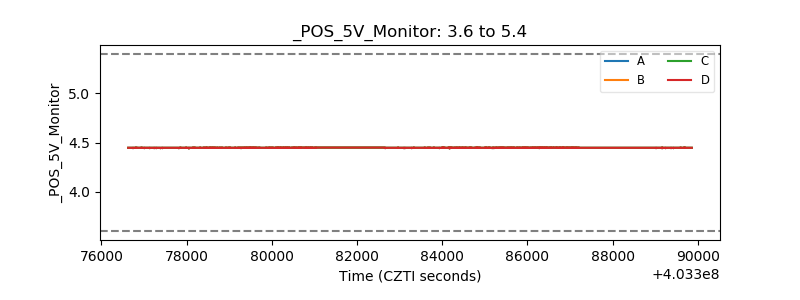 |
| _ROLL_ROT | 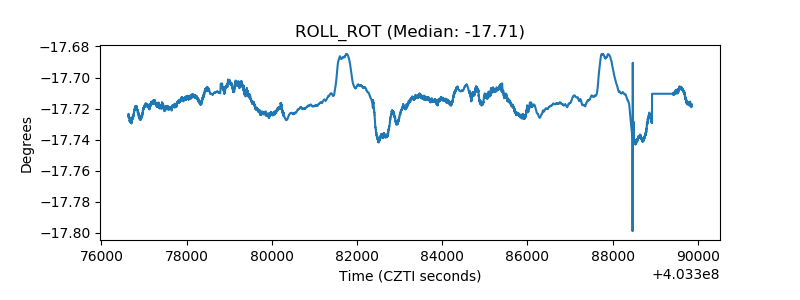 |
| _Roll_DEC | 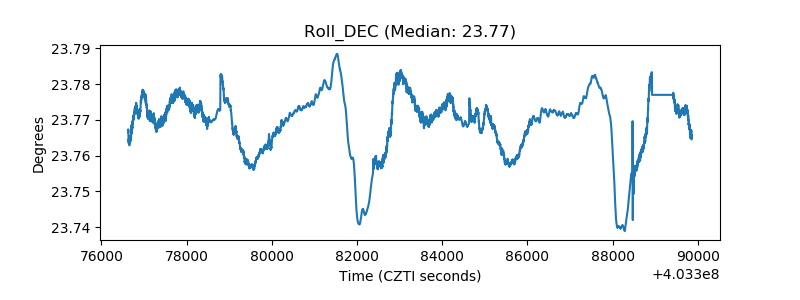 |
| _Roll_RA | 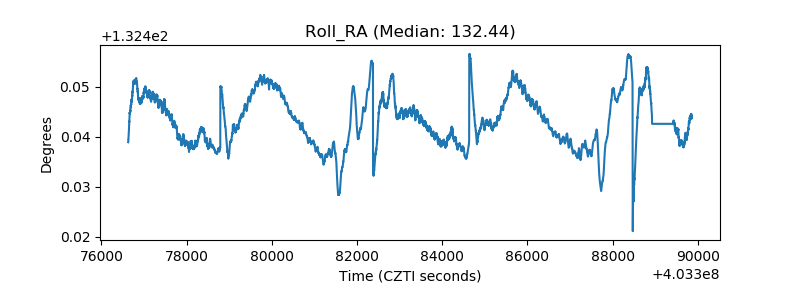 |
| Veto Counter | 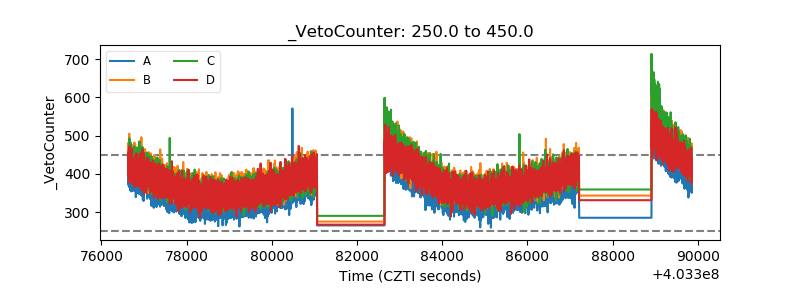 |