| Param | Original file | Final file |
|---|---|---|
| Filename | modeM0/AS1A11_047T09_9000005362_38083cztM0_level2.fits | modeM0/AS1A11_047T09_9000005362_38083cztM0_level2_quad_clean.evt |
| Size (bytes) | 362,053,440 | 95,405,760 |
| Size | 345.3 MB | 91.0 MB |
| Events in quadrant A | 3,317,822 | 651,298 |
| Events in quadrant B | 2,806,425 | 665,546 |
| Events in quadrant C | 2,845,134 | 638,604 |
| Events in quadrant D | 4,028,067 | 568,846 |
| Mode M0 | |||
|---|---|---|---|
| Quadrant | BADHDUFLAG | Total packets | Discarded packets |
| A | 0 | 13219 | 3 |
| B | 0 | 11727 | 2 |
| C | 0 | 11649 | 2 |
| D | 0 | 15525 | 2 |
| Mode SS | |||
|---|---|---|---|
| Quadrant | BADHDUFLAG | Total packets | Discarded packets |
| A | 0 | 108 | 0 |
| B | 0 | 108 | 0 |
| C | 0 | 108 | 0 |
| D | 0 | 108 | 0 |
| Mode M9 | |||
|---|---|---|---|
| Quadrant | BADHDUFLAG | Total packets | Discarded packets |
| A | 0 | 24 | 0 |
| B | 0 | 24 | 0 |
| C | 0 | 24 | 0 |
| D | 0 | 25 | 0 |
| Quadrant | Total seconds | Saturated seconds | Saturation percentage |
|---|---|---|---|
| A | 5199 | 88 | 1.692633% |
| B | 5199 | 67 | 1.288709% |
| C | 5199 | 30 | 0.577034% |
| D | 5199 | 326 | 6.270437% |
Noise dominated data is calculated using 1-second bins in cleaned event files. If a bin has >2000 counts, and if more than 50% of those come from <1% of pixels, then it is considered to be noise-dominated and hence unusable.
| Quadrant | # 1 sec bins | Bins with >0 counts | Bins with >2000 counts | High rate bins dominated by noise | Noise dominated (total time) | Noise dominated (detector-on time) | Marked lightcurve |
|---|---|---|---|---|---|---|---|
| A | 7053 | 5200 | 53 | 53 | 0.75% | 1.02% | 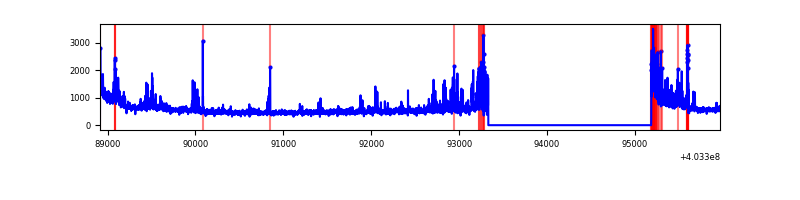 |
| B | 7053 | 5200 | 32 | 32 | 0.45% | 0.62% | 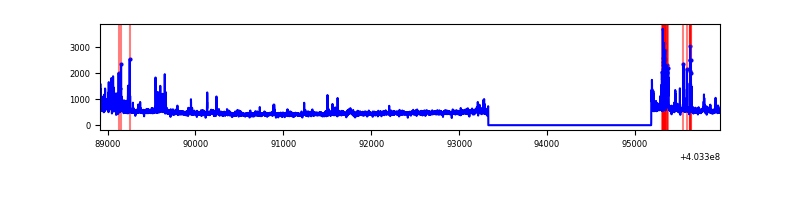 |
| C | 7053 | 5200 | 26 | 26 | 0.37% | 0.50% | 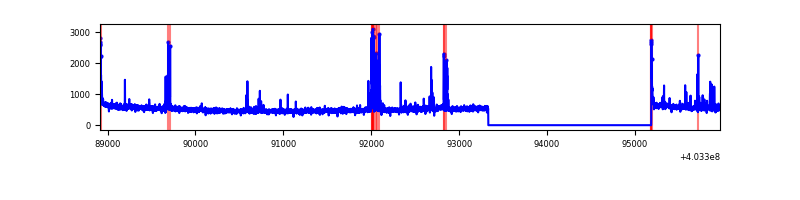 |
| D | 7053 | 5200 | 262 | 262 | 3.71% | 5.04% | 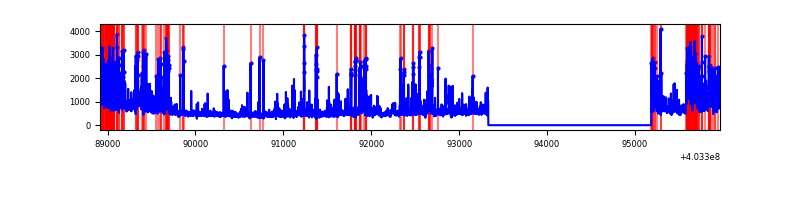 |
Top three noisy pixels from each quadrant. If the there are fewer than three noisy pixels in the level2.evt file, extra rows are filled as -1
| Pixel properties | Quadrant properties | ||||||
|---|---|---|---|---|---|---|---|
| Quadrant | DetID | PixID | Counts | Sigma | Mean | Median | Sigma |
| A | 10 | 83 | 353536 | 2778.28 | 627 | 616 | 127.0 |
| A | 12 | 16 | 344313 | 2705.68 | 627 | 616 | 127.0 |
| A | 9 | 143 | 77613 | 606.14 | 627 | 616 | 127.0 |
| B | 5 | 172 | 129155 | 1064.83 | 628 | 612 | 120.7 |
| B | 0 | 229 | 99149 | 816.27 | 628 | 612 | 120.7 |
| B | 4 | 81 | 32080 | 260.68 | 628 | 612 | 120.7 |
| C | 15 | 214 | 214379 | 1478.94 | 617 | 623 | 144.5 |
| C | 1 | 23 | 155618 | 1072.38 | 617 | 623 | 144.5 |
| C | 0 | 10 | 46553 | 317.78 | 617 | 623 | 144.5 |
| D | 2 | 250 | 371992 | 2528.3 | 601 | 584 | 146.9 |
| D | 13 | 138 | 339080 | 2304.25 | 601 | 584 | 146.9 |
| D | 12 | 233 | 308113 | 2093.45 | 601 | 584 | 146.9 |
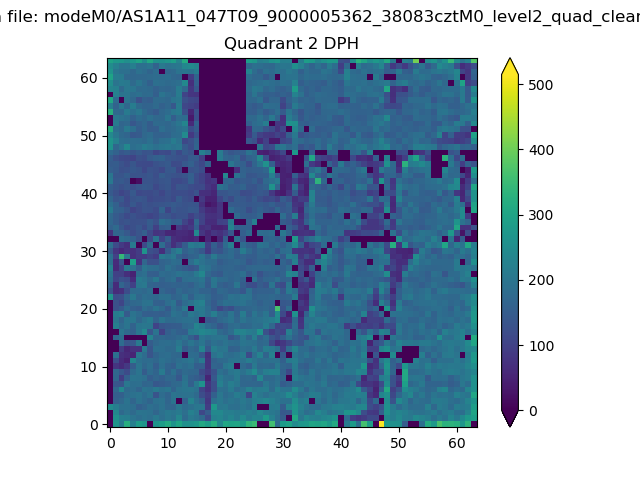
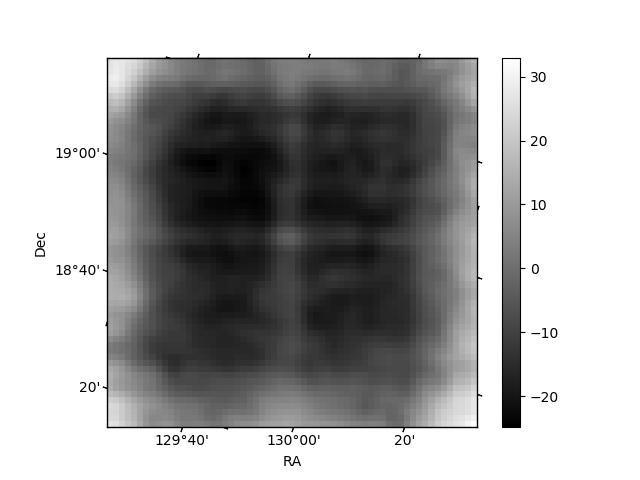
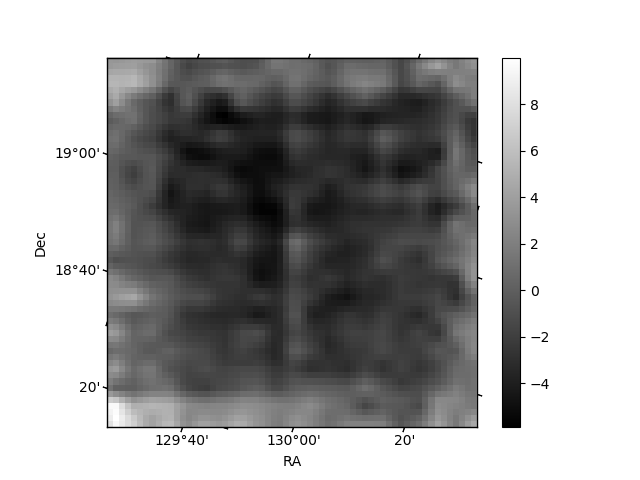
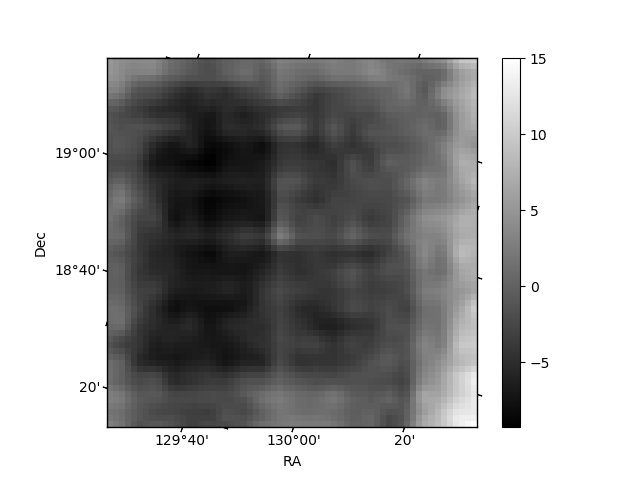
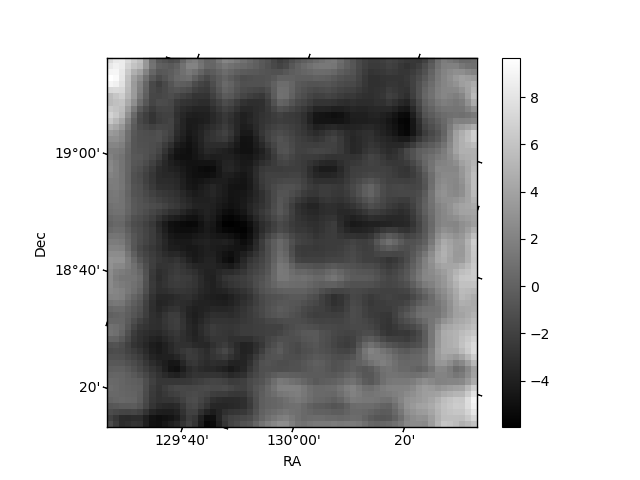
Histogram calculated using DETX and DETY for each event in the final _common_clean file
| Quadrant A | 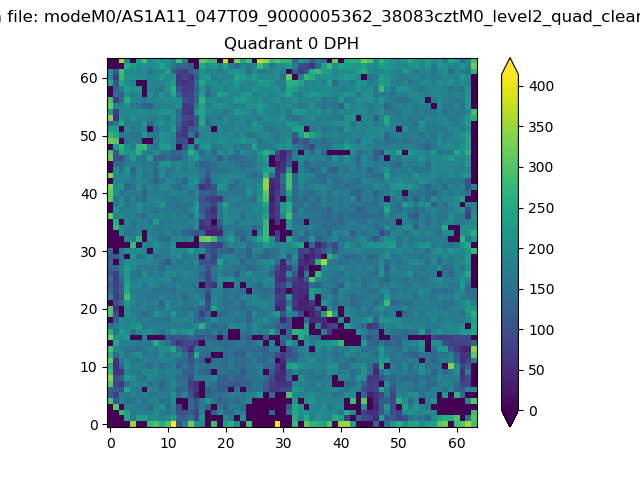 |
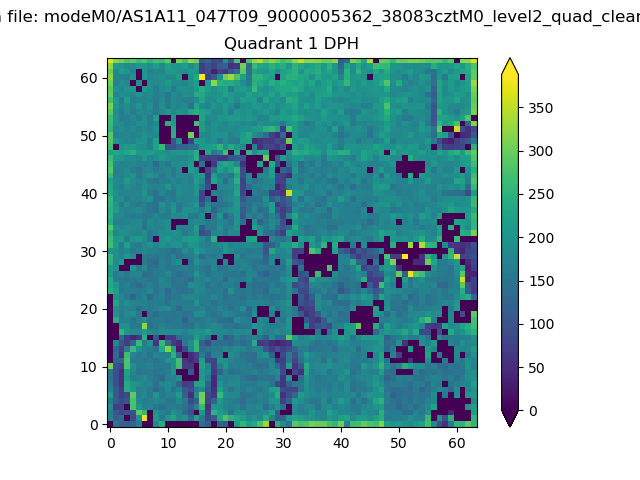 |
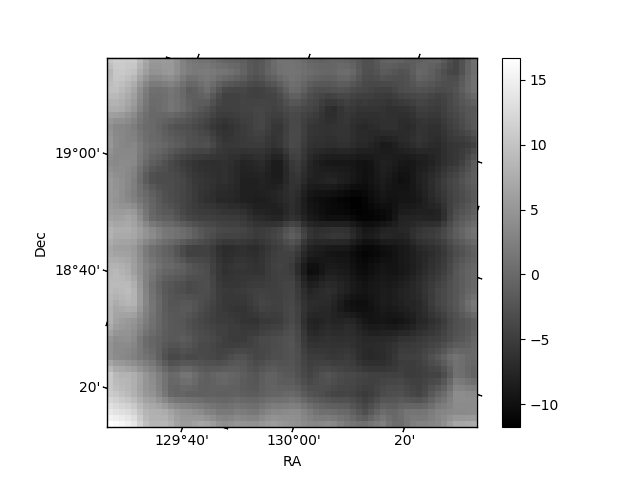
Quadrant B |
|---|---|---|---|
| Quadrant D | 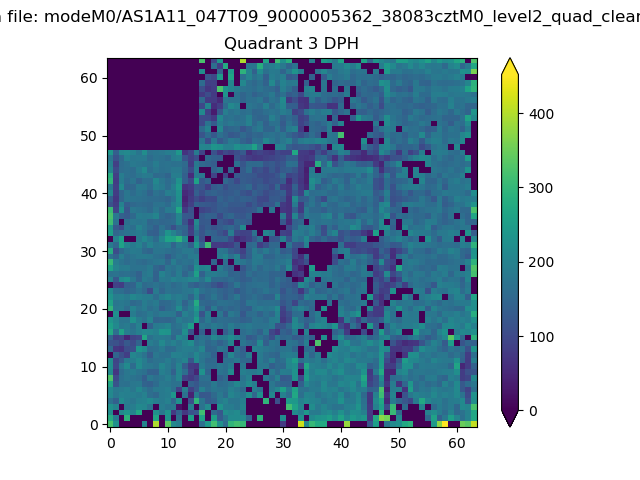 |
 |
Quadrant C |
| Plot type | Count rate plots | Images |
|---|---|---|
| Comparison with Poisson distribution Blue bars denote a histogram of data divided into 1 sec bins. Red curve is a Poisson curve with rate = median count rate of data. |
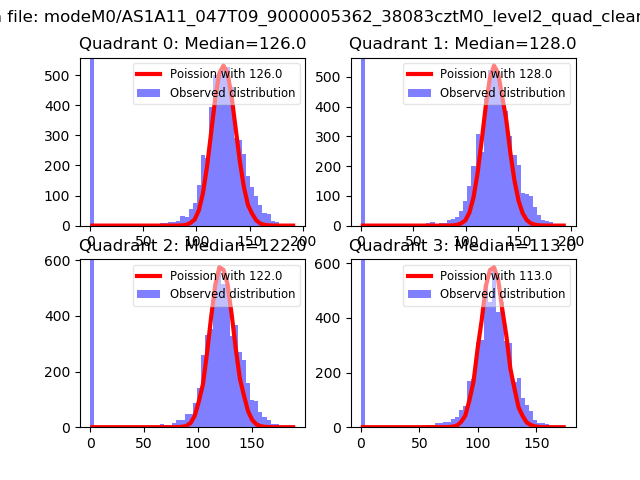 |
 |
| Quadrant-wise count rates Data is divided into 100 sec bins |
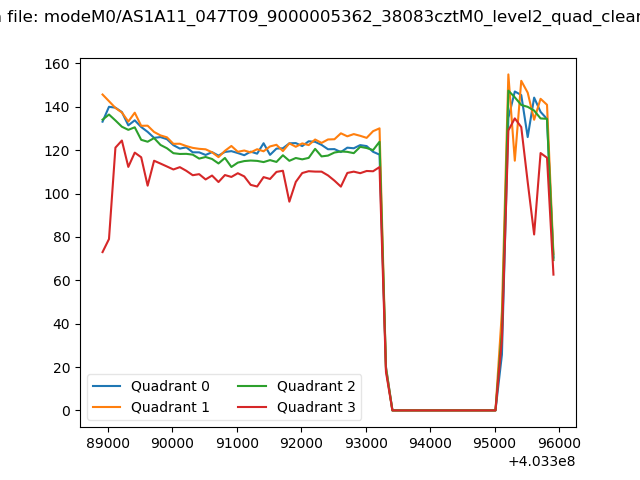 |
|
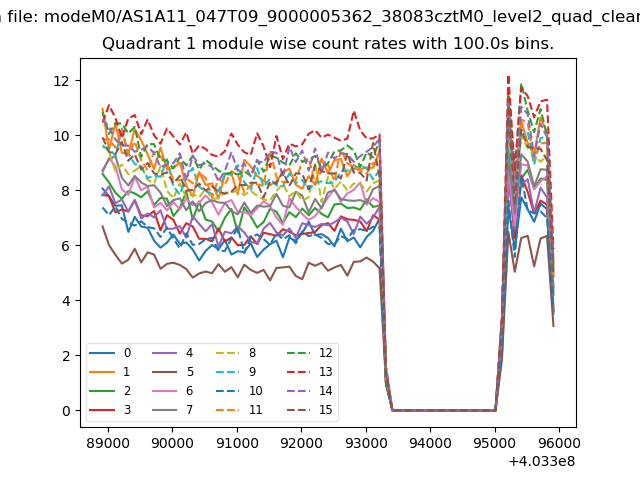
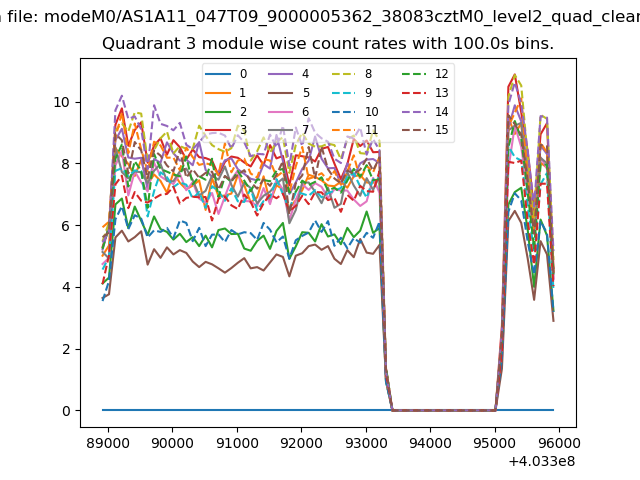
| Module-wise count rates for Quadrant A Data is divided into 100 sec bins |
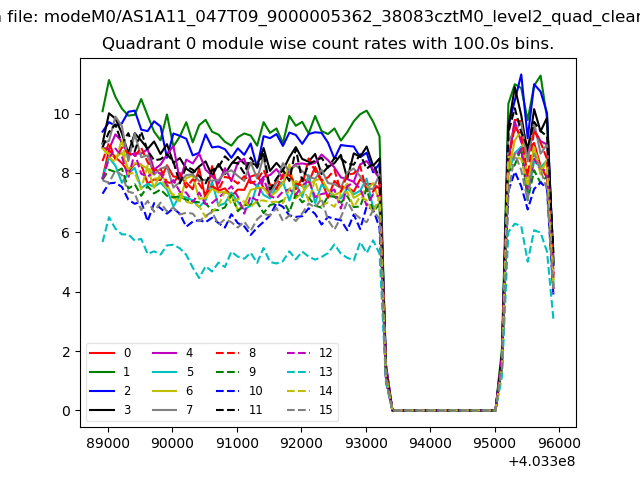 |
 |
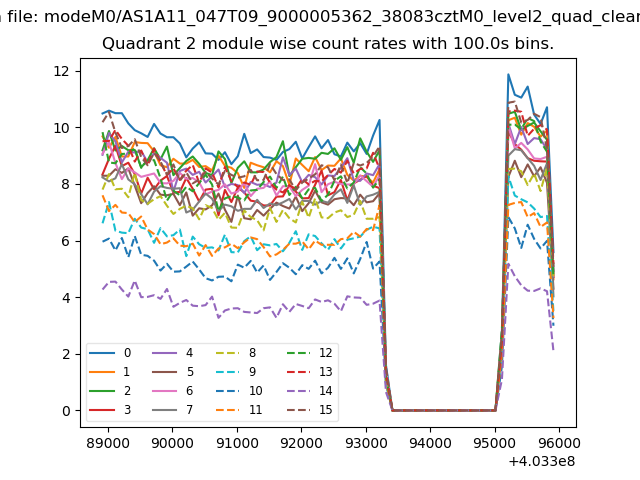
| Module-wise count rates for Quadrant B Data is divided into 100 sec bins |
 |
 |
| Module-wise count rates for Quadrant C Data is divided into 100 sec bins |
 |
 |
| Module-wise count rates for Quadrant D Data is divided into 100 sec bins |
 |
 |
| Parameter | Plot |
|---|---|
| CZT HV Monitor | 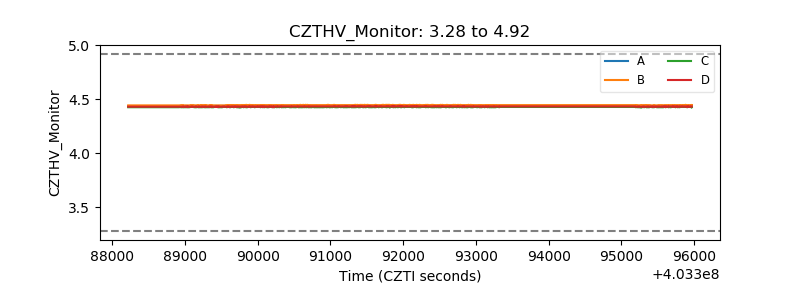 |
| D_VDD | 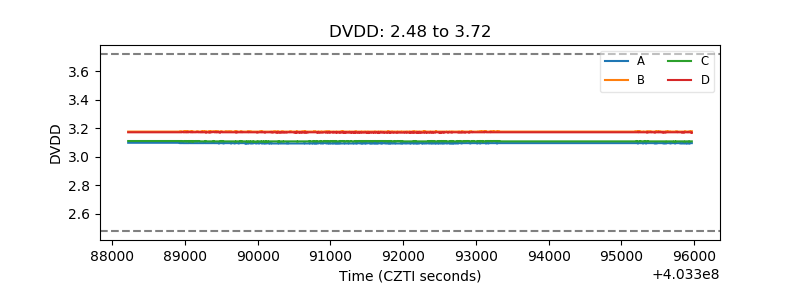 |
| Temperature 1 | 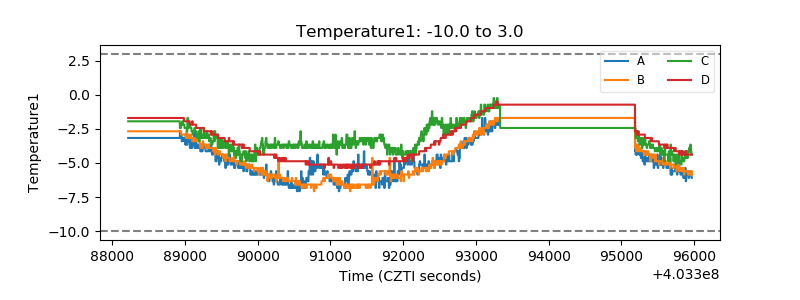 |
| Veto HV Monitor | 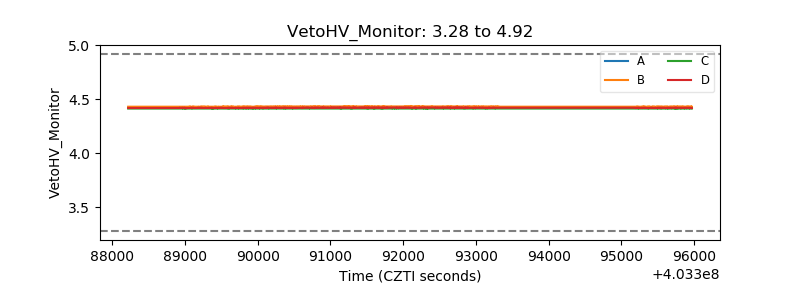 |
| Veto LLD | 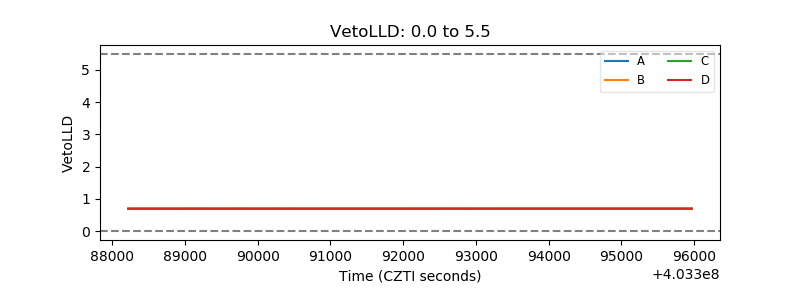 |
| Alpha Counter | 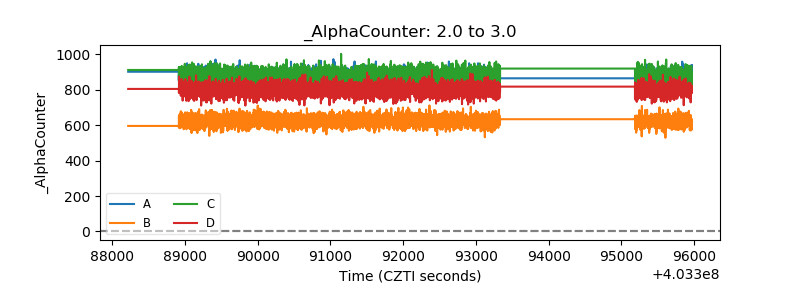 |
| _CPM_Rate | 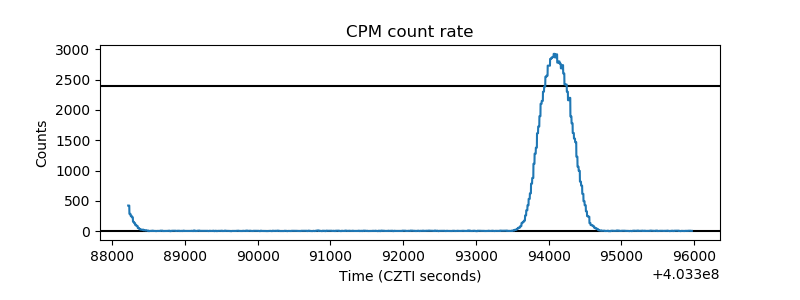 |
| CZT Counter | 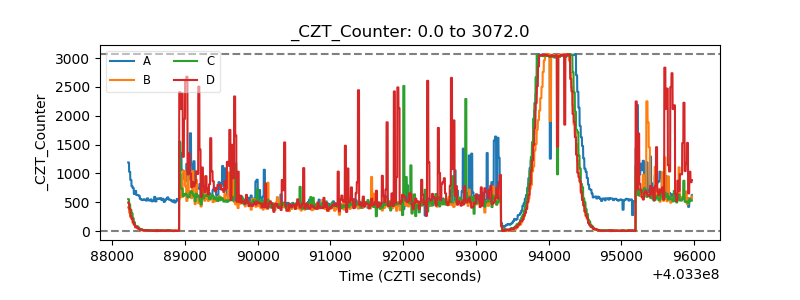 |
| +2.5 Volts monitor | 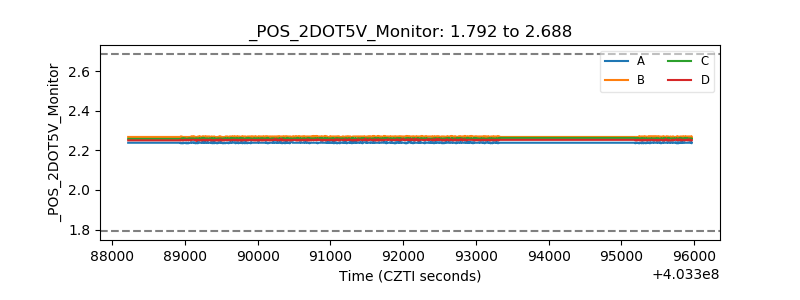 |
| +5 Volts monitor | 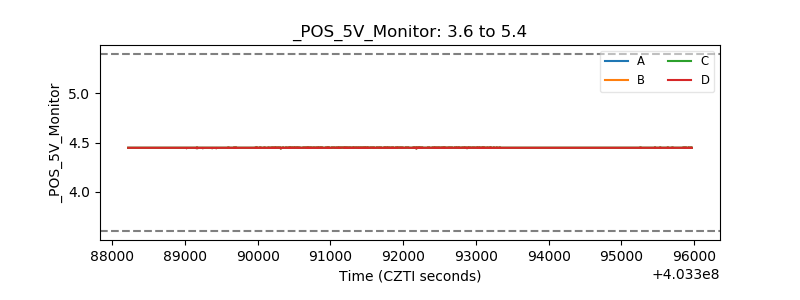 |
| _ROLL_ROT | 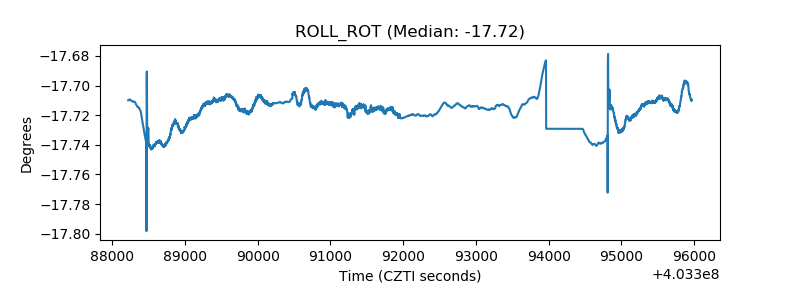 |
| _Roll_DEC | 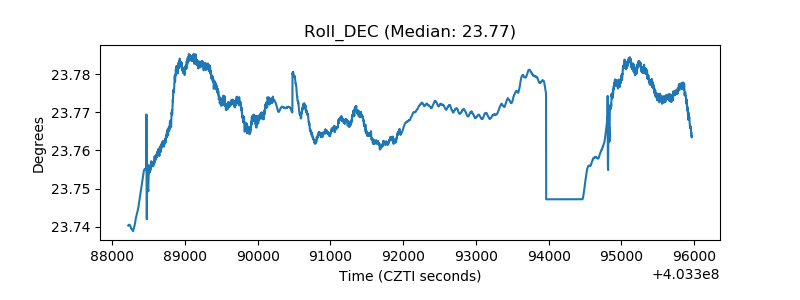 |
| _Roll_RA | 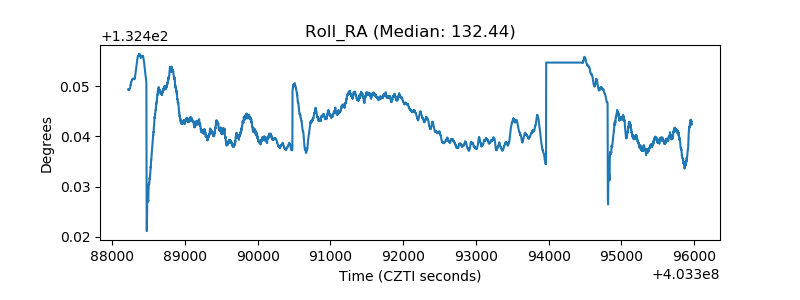 |
| Veto Counter | 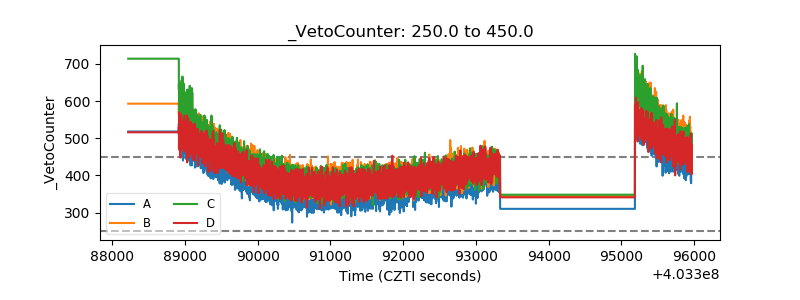 |