| Param | Original file | Final file |
|---|---|---|
| Filename | modeM0/AS1A11_047T09_9000005362_38084cztM0_level2.fits | modeM0/AS1A11_047T09_9000005362_38084cztM0_level2_quad_clean.evt |
| Size (bytes) | 391,904,640 | 96,344,640 |
| Size | 373.7 MB | 91.9 MB |
| Events in quadrant A | 3,020,432 | 665,947 |
| Events in quadrant B | 2,826,247 | 685,774 |
| Events in quadrant C | 3,540,771 | 637,943 |
| Events in quadrant D | 4,721,839 | 569,435 |
| Mode M0 | |||
|---|---|---|---|
| Quadrant | BADHDUFLAG | Total packets | Discarded packets |
| A | 0 | 12106 | 3 |
| B | 0 | 11564 | 2 |
| C | 0 | 13715 | 2 |
| D | 0 | 17581 | 2 |
| Mode SS | |||
|---|---|---|---|
| Quadrant | BADHDUFLAG | Total packets | Discarded packets |
| A | 0 | 104 | 0 |
| B | 0 | 104 | 0 |
| C | 0 | 104 | 0 |
| D | 0 | 104 | 0 |
| Mode M9 | |||
|---|---|---|---|
| Quadrant | BADHDUFLAG | Total packets | Discarded packets |
| A | 0 | 26 | 0 |
| B | 0 | 26 | 0 |
| C | 0 | 26 | 0 |
| D | 0 | 27 | 0 |
| Quadrant | Total seconds | Saturated seconds | Saturation percentage |
|---|---|---|---|
| A | 5117 | 60 | 1.172562% |
| B | 5117 | 71 | 1.387532% |
| C | 5117 | 174 | 3.400430% |
| D | 5117 | 377 | 7.367598% |
Noise dominated data is calculated using 1-second bins in cleaned event files. If a bin has >2000 counts, and if more than 50% of those come from <1% of pixels, then it is considered to be noise-dominated and hence unusable.
| Quadrant | # 1 sec bins | Bins with >0 counts | Bins with >2000 counts | High rate bins dominated by noise | Noise dominated (total time) | Noise dominated (detector-on time) | Marked lightcurve |
|---|---|---|---|---|---|---|---|
| A | 7090 | 5118 | 43 | 43 | 0.61% | 0.84% | 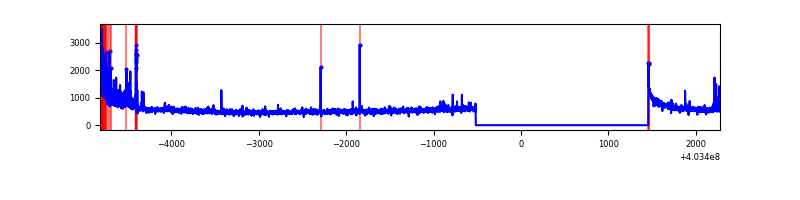 |
| B | 7090 | 5118 | 41 | 41 | 0.58% | 0.80% | 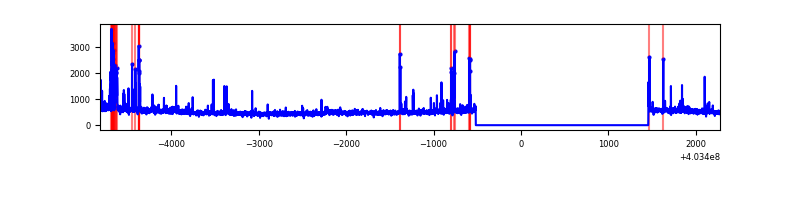 |
| C | 7090 | 5118 | 182 | 182 | 2.57% | 3.56% | 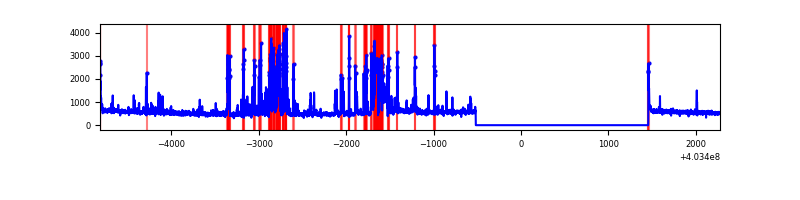 |
| D | 7090 | 5118 | 347 | 347 | 4.89% | 6.78% | 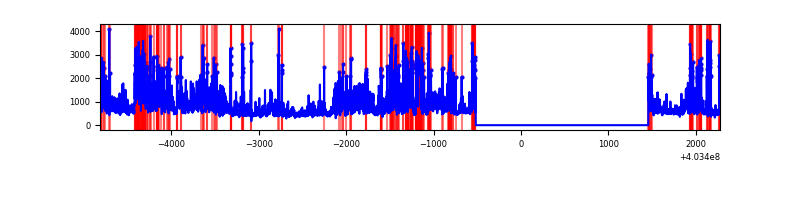 |
Top three noisy pixels from each quadrant. If the there are fewer than three noisy pixels in the level2.evt file, extra rows are filled as -1
| Pixel properties | Quadrant properties | ||||||
|---|---|---|---|---|---|---|---|
| Quadrant | DetID | PixID | Counts | Sigma | Mean | Median | Sigma |
| A | 10 | 83 | 346194 | 2711.01 | 626 | 614 | 127.5 |
| A | 12 | 16 | 98768 | 770.0 | 626 | 614 | 127.5 |
| A | 9 | 143 | 71970 | 559.77 | 626 | 614 | 127.5 |
| B | 5 | 172 | 161704 | 1358.12 | 629 | 613 | 118.6 |
| B | 0 | 229 | 75852 | 634.32 | 629 | 613 | 118.6 |
| B | 4 | 81 | 29032 | 239.59 | 629 | 613 | 118.6 |
| C | 1 | 23 | 893336 | 6286.71 | 608 | 612 | 142.0 |
| C | 15 | 214 | 208523 | 1464.14 | 608 | 612 | 142.0 |
| C | 0 | 10 | 38032 | 263.52 | 608 | 612 | 142.0 |
| D | 2 | 250 | 1317866 | 9054.26 | 591 | 574 | 145.5 |
| D | 5 | 222 | 344753 | 2365.68 | 591 | 574 | 145.5 |
| D | 13 | 138 | 197146 | 1351.12 | 591 | 574 | 145.5 |
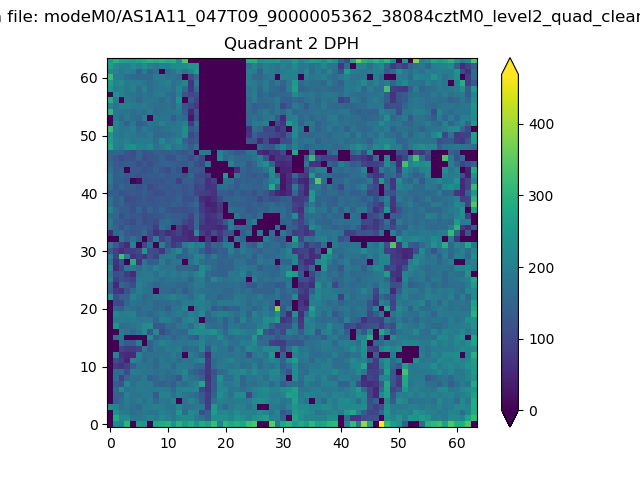
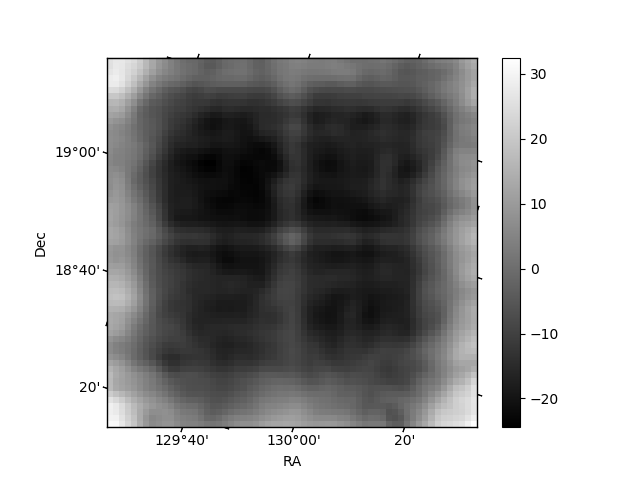
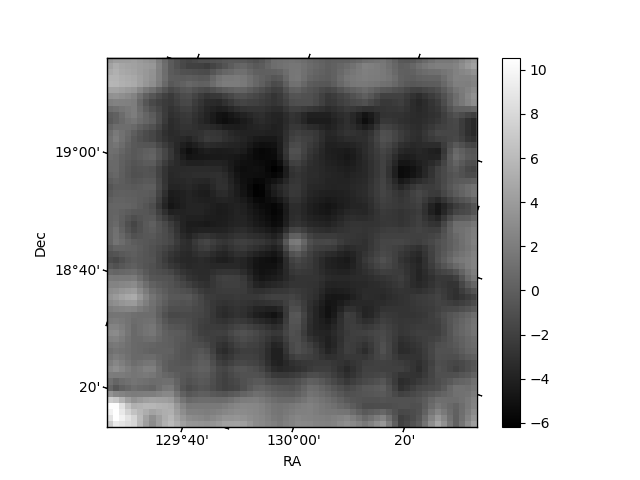
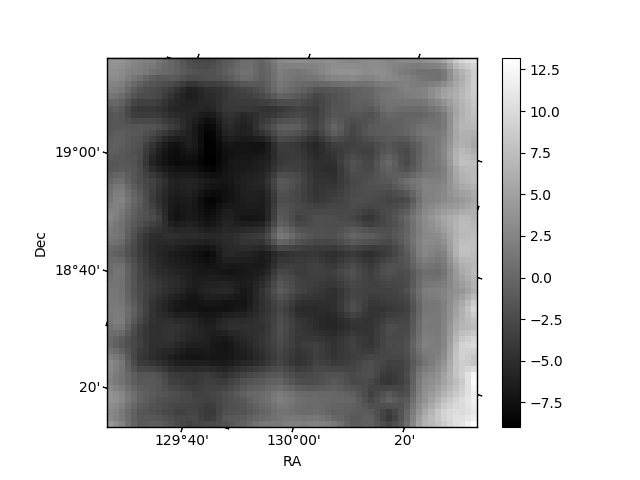
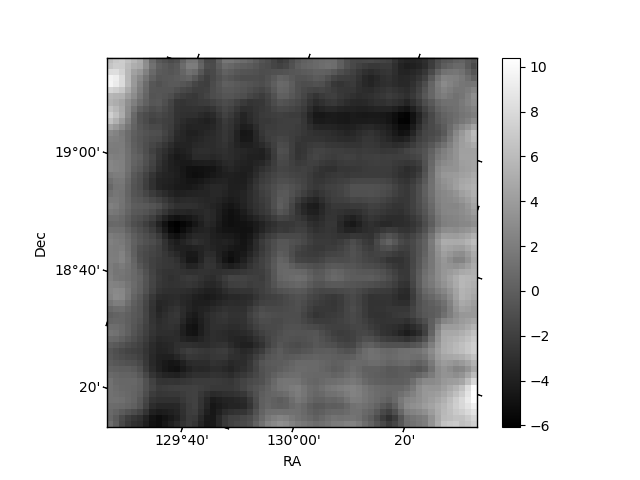
Histogram calculated using DETX and DETY for each event in the final _common_clean file
| Quadrant A | 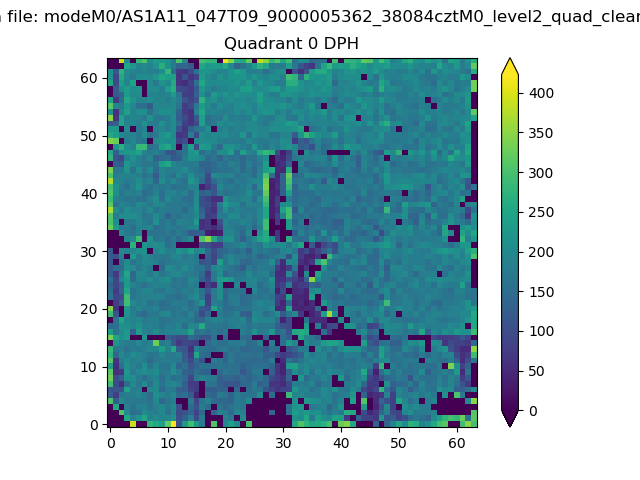 |
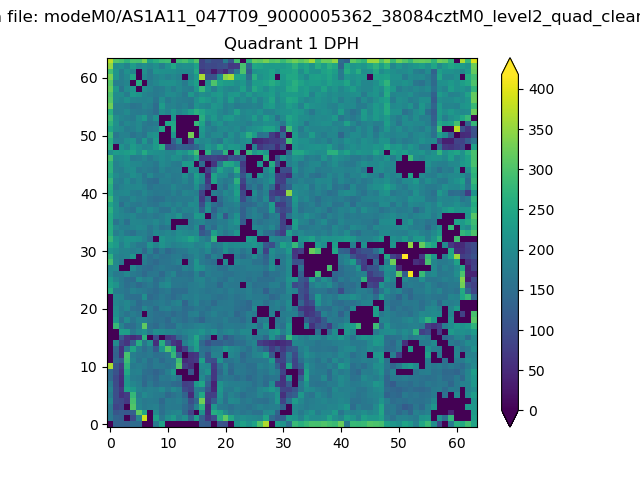 |
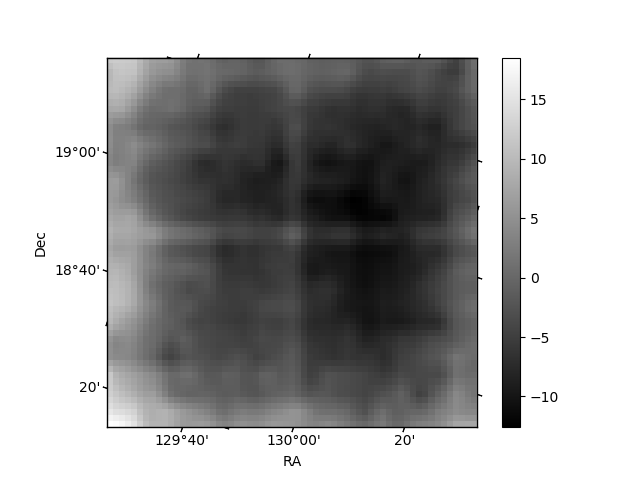
Quadrant B |
|---|---|---|---|
| Quadrant D | 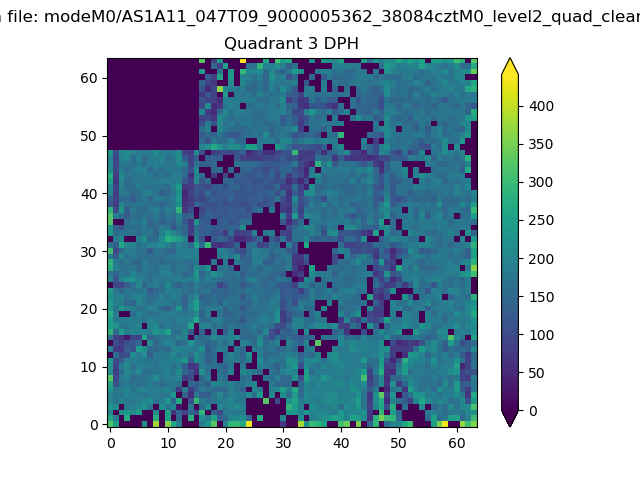 |
 |
Quadrant C |
| Plot type | Count rate plots | Images |
|---|---|---|
| Comparison with Poisson distribution Blue bars denote a histogram of data divided into 1 sec bins. Red curve is a Poisson curve with rate = median count rate of data. |
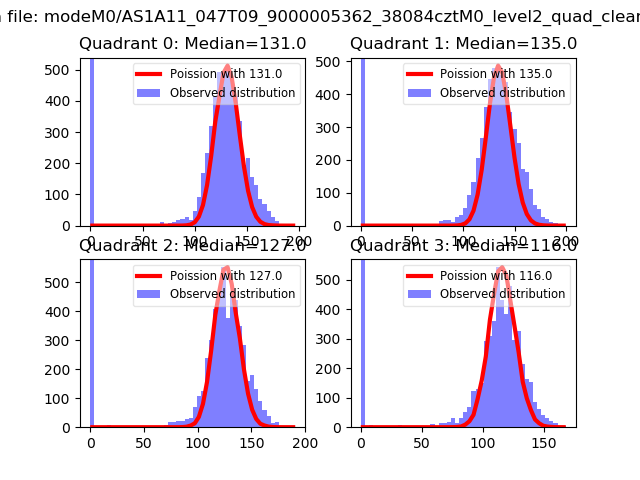 |
 |
| Quadrant-wise count rates Data is divided into 100 sec bins |
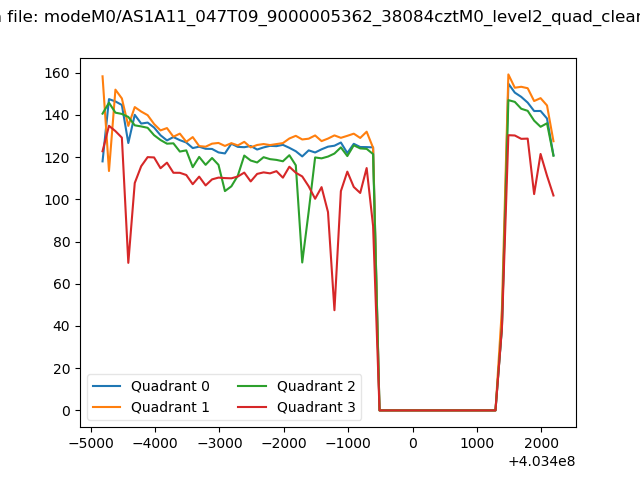 |
|
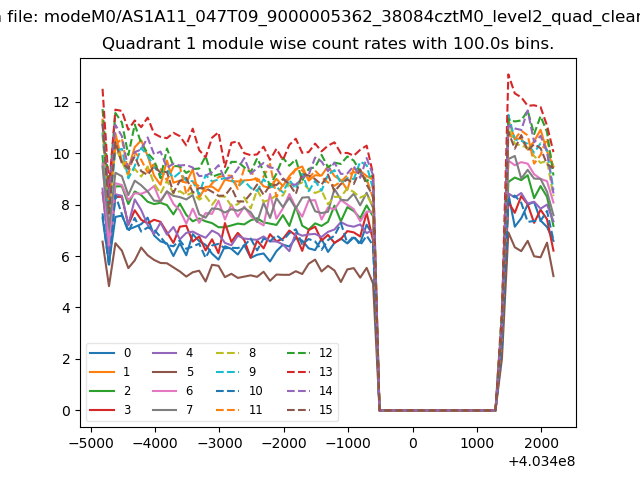
| Module-wise count rates for Quadrant A Data is divided into 100 sec bins |
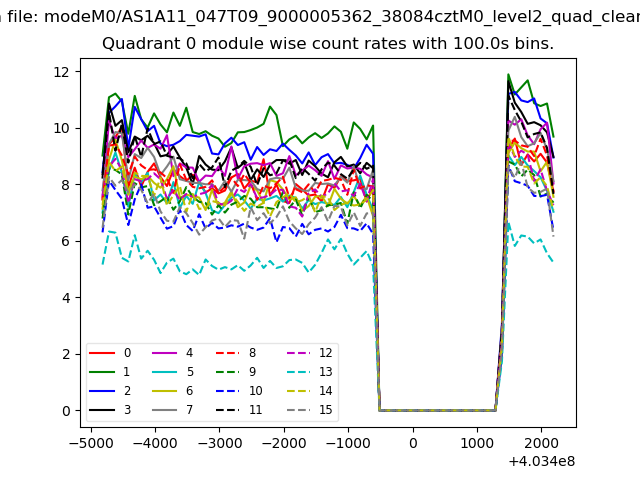 |
 |
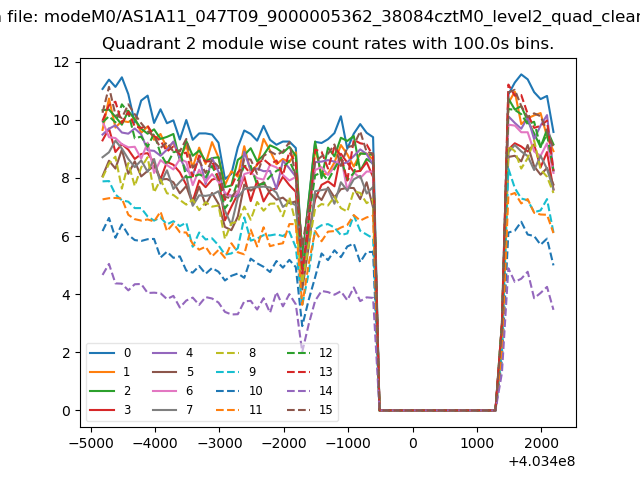
| Module-wise count rates for Quadrant B Data is divided into 100 sec bins |
 |
 |
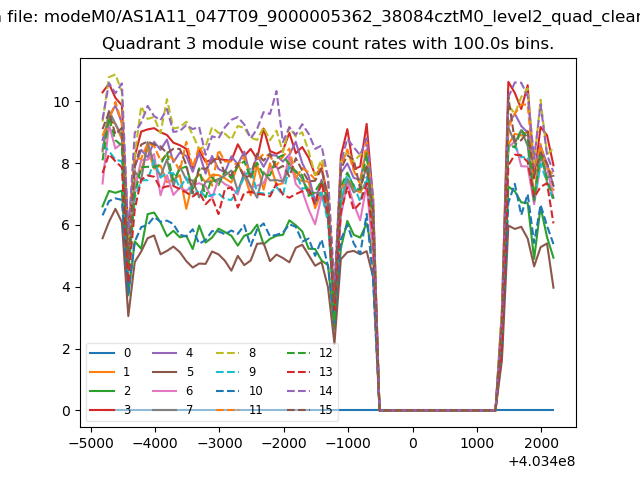
| Module-wise count rates for Quadrant C Data is divided into 100 sec bins |
 |
 |
| Module-wise count rates for Quadrant D Data is divided into 100 sec bins |
 |
 |
| Parameter | Plot |
|---|---|
| CZT HV Monitor | 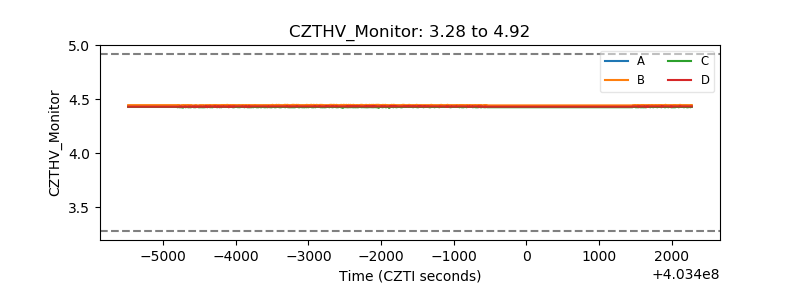 |
| D_VDD |  |
| Temperature 1 | 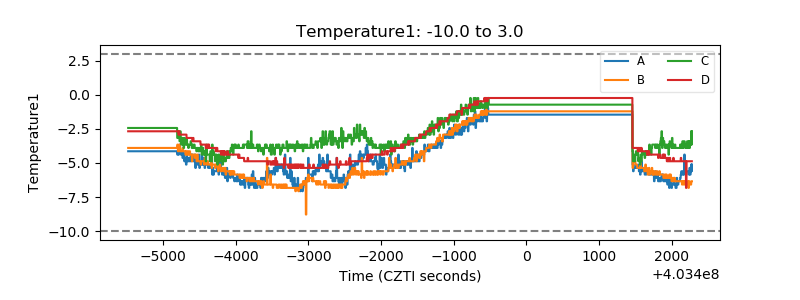 |
| Veto HV Monitor | 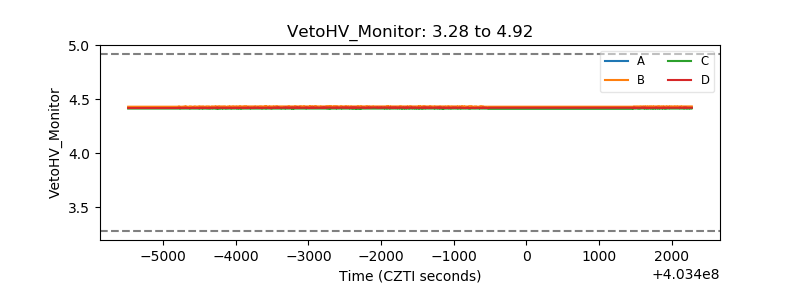 |
| Veto LLD | 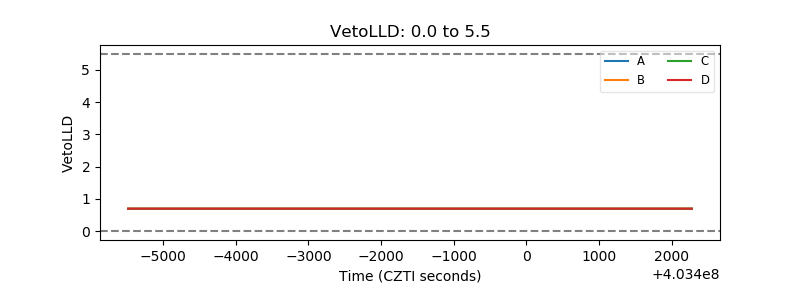 |
| Alpha Counter | 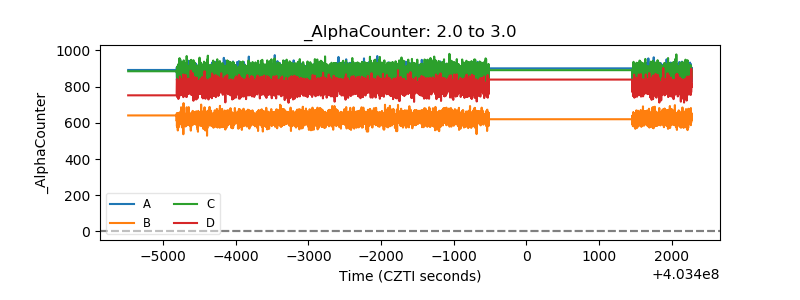 |
| _CPM_Rate | 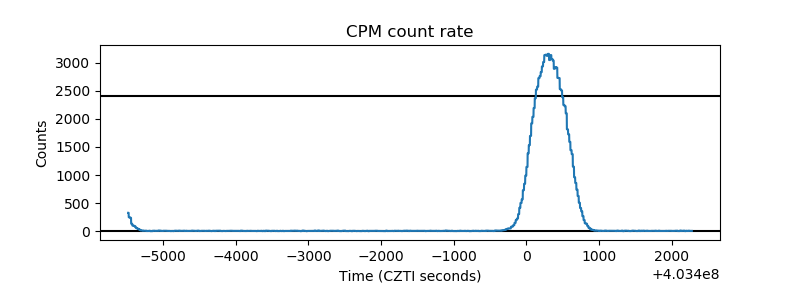 |
| CZT Counter | 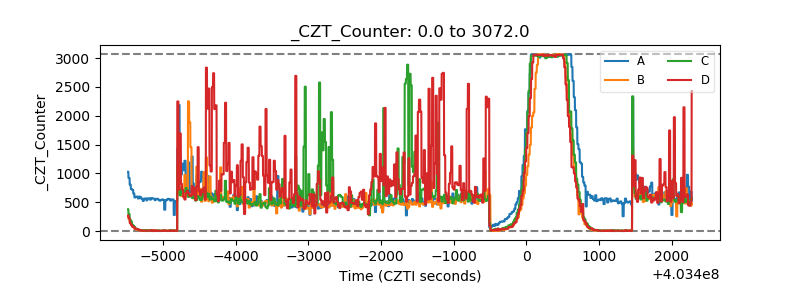 |
| +2.5 Volts monitor | 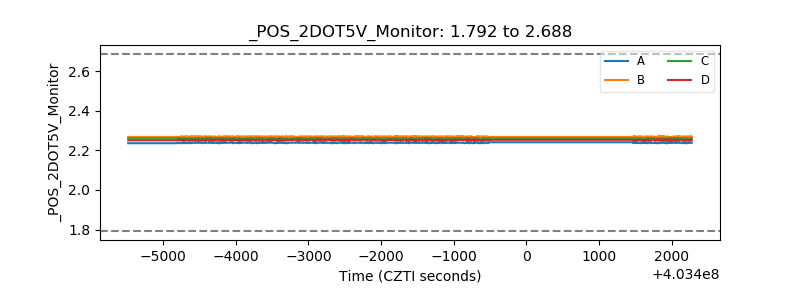 |
| +5 Volts monitor | 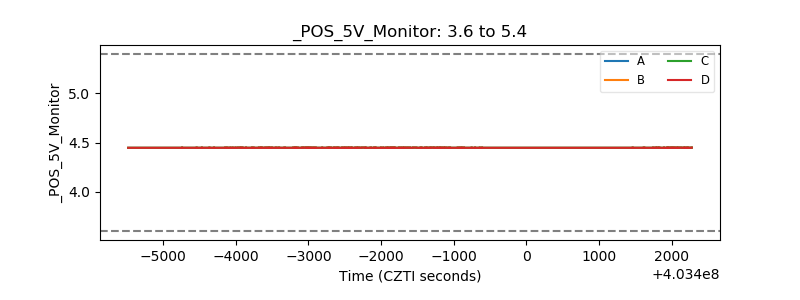 |
| _ROLL_ROT | 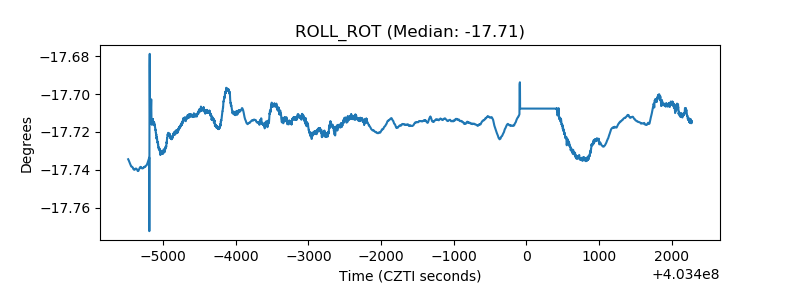 |
| _Roll_DEC | 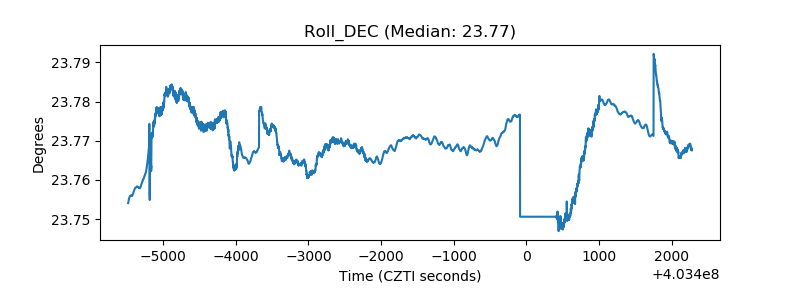 |
| _Roll_RA | 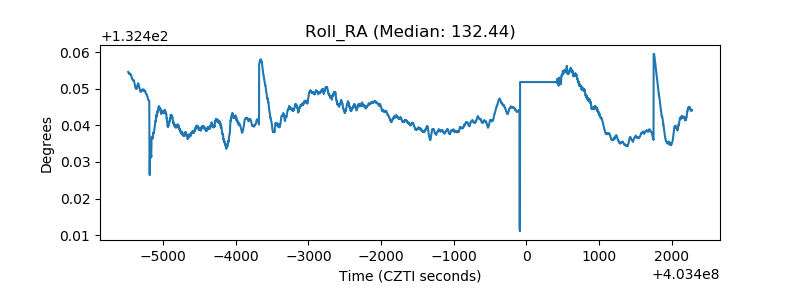 |
| Veto Counter | 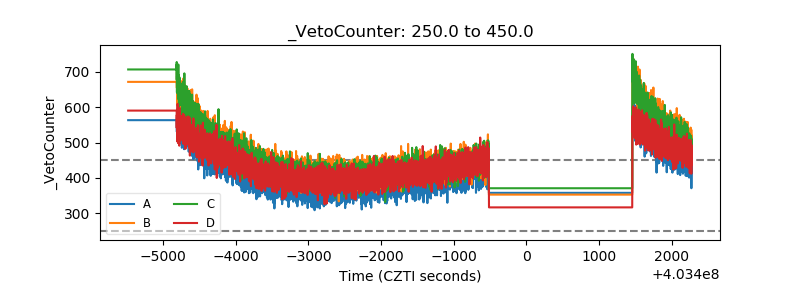 |