| Param | Original file | Final file |
|---|---|---|
| Filename | modeM0/AS1A11_047T09_9000005362_38085cztM0_level2.fits | modeM0/AS1A11_047T09_9000005362_38085cztM0_level2_quad_clean.evt |
| Size (bytes) | 340,747,200 | 96,324,480 |
| Size | 325.0 MB | 91.9 MB |
| Events in quadrant A | 2,976,451 | 667,472 |
| Events in quadrant B | 2,553,696 | 689,647 |
| Events in quadrant C | 3,059,513 | 638,904 |
| Events in quadrant D | 3,631,840 | 568,266 |
| Mode M0 | |||
|---|---|---|---|
| Quadrant | BADHDUFLAG | Total packets | Discarded packets |
| A | 0 | 12003 | 3 |
| B | 0 | 10621 | 2 |
| C | 0 | 12008 | 2 |
| D | 0 | 14171 | 2 |
| Mode SS | |||
|---|---|---|---|
| Quadrant | BADHDUFLAG | Total packets | Discarded packets |
| A | 0 | 102 | 0 |
| B | 0 | 102 | 0 |
| C | 0 | 102 | 0 |
| D | 0 | 102 | 0 |
| Mode M9 | |||
|---|---|---|---|
| Quadrant | BADHDUFLAG | Total packets | Discarded packets |
| A | 0 | 31 | 0 |
| B | 0 | 31 | 0 |
| C | 0 | 31 | 0 |
| D | 0 | 32 | 0 |
| Quadrant | Total seconds | Saturated seconds | Saturation percentage |
|---|---|---|---|
| A | 5034 | 24 | 0.476758% |
| B | 5034 | 14 | 0.278109% |
| C | 5034 | 106 | 2.105681% |
| D | 5034 | 289 | 5.740961% |
Noise dominated data is calculated using 1-second bins in cleaned event files. If a bin has >2000 counts, and if more than 50% of those come from <1% of pixels, then it is considered to be noise-dominated and hence unusable.
| Quadrant | # 1 sec bins | Bins with >0 counts | Bins with >2000 counts | High rate bins dominated by noise | Noise dominated (total time) | Noise dominated (detector-on time) | Marked lightcurve |
|---|---|---|---|---|---|---|---|
| A | 7097 | 5035 | 15 | 15 | 0.21% | 0.30% | 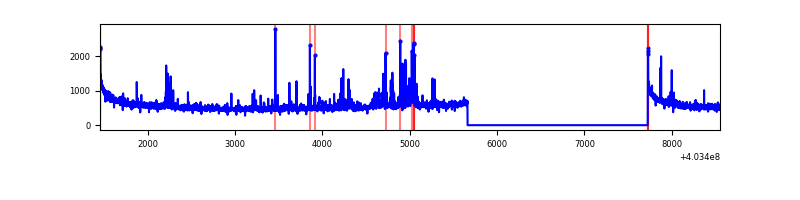 |
| B | 7097 | 5035 | 2 | 2 | 0.03% | 0.04% | 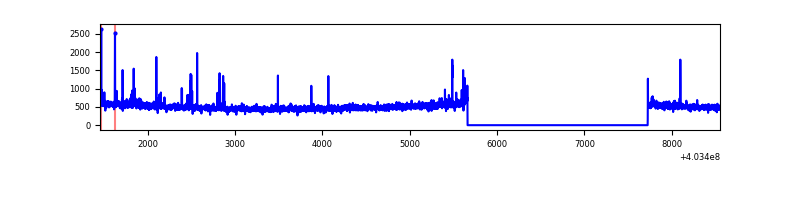 |
| C | 7097 | 5035 | 90 | 90 | 1.27% | 1.79% | 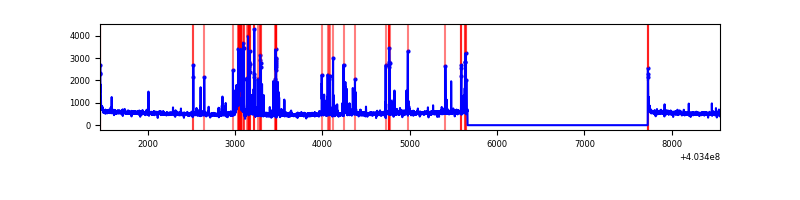 |
| D | 7097 | 5035 | 253 | 253 | 3.56% | 5.02% | 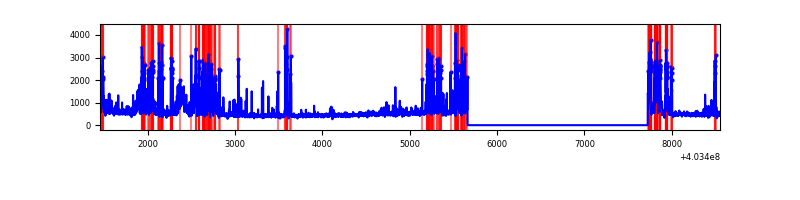 |
Top three noisy pixels from each quadrant. If the there are fewer than three noisy pixels in the level2.evt file, extra rows are filled as -1
| Pixel properties | Quadrant properties | ||||||
|---|---|---|---|---|---|---|---|
| Quadrant | DetID | PixID | Counts | Sigma | Mean | Median | Sigma |
| A | 10 | 83 | 341171 | 2720.02 | 619 | 608 | 125.2 |
| A | 12 | 16 | 104480 | 829.61 | 619 | 608 | 125.2 |
| A | 7 | 3 | 38118 | 299.59 | 619 | 608 | 125.2 |
| B | 0 | 229 | 32808 | 271.41 | 624 | 608 | 118.6 |
| B | 4 | 232 | 21470 | 175.84 | 624 | 608 | 118.6 |
| B | 4 | 81 | 19511 | 159.33 | 624 | 608 | 118.6 |
| C | 1 | 23 | 450290 | 3228.42 | 601 | 608 | 139.3 |
| C | 15 | 214 | 208240 | 1490.66 | 601 | 608 | 139.3 |
| C | 0 | 10 | 33452 | 235.8 | 601 | 608 | 139.3 |
| D | 2 | 250 | 680116 | 4799.93 | 583 | 567 | 141.6 |
| D | 13 | 249 | 201720 | 1420.83 | 583 | 567 | 141.6 |
| D | 12 | 233 | 151009 | 1062.63 | 583 | 567 | 141.6 |
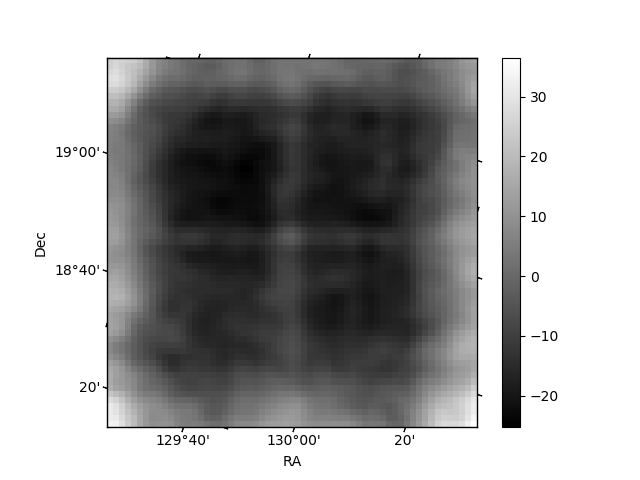
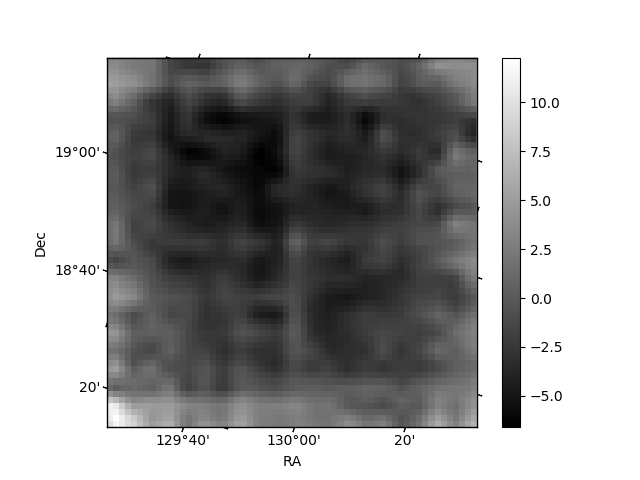
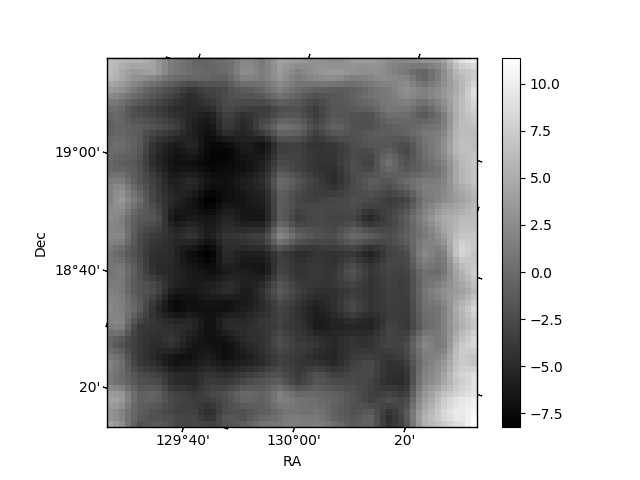
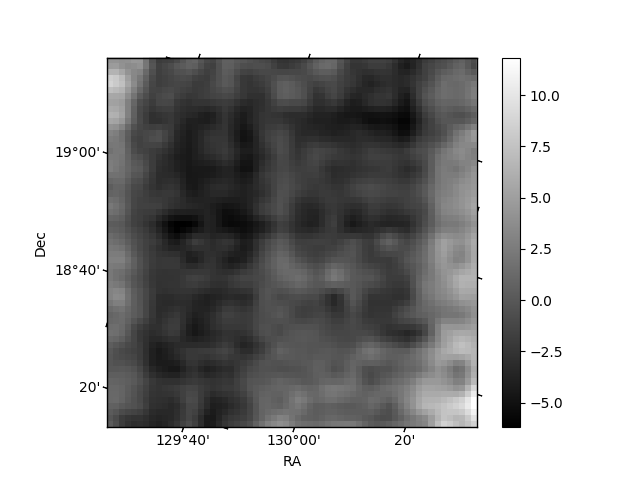
Histogram calculated using DETX and DETY for each event in the final _common_clean file
| Quadrant A | 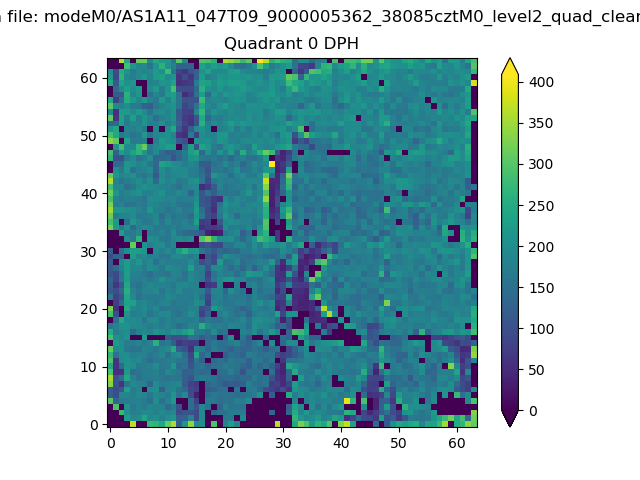 |
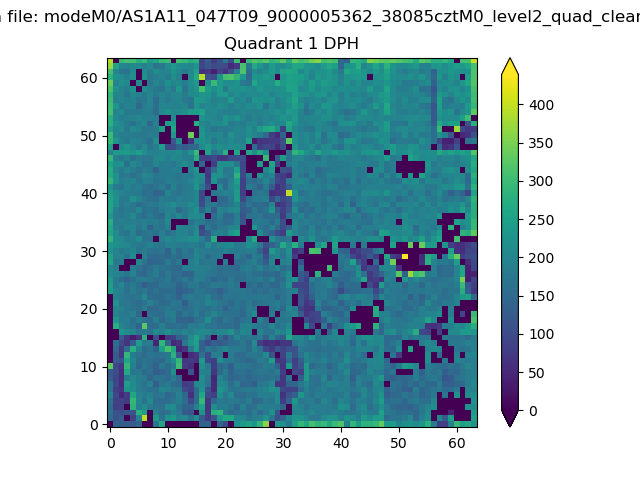 |
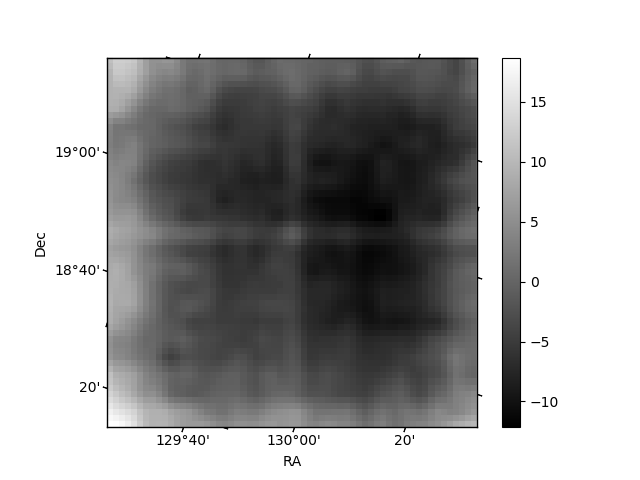
Quadrant B |
|---|---|---|---|
| Quadrant D | 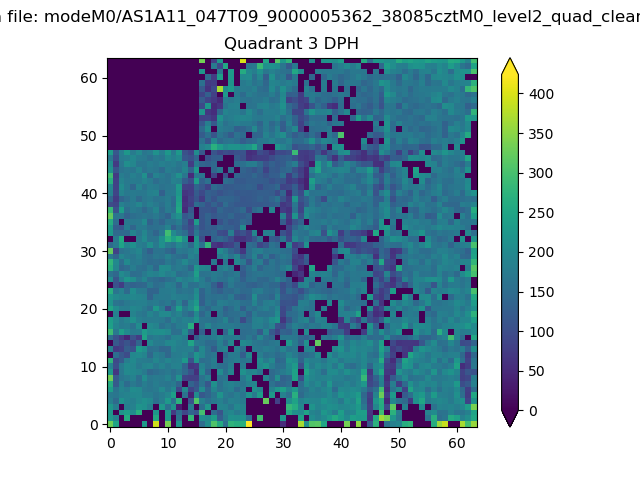 |
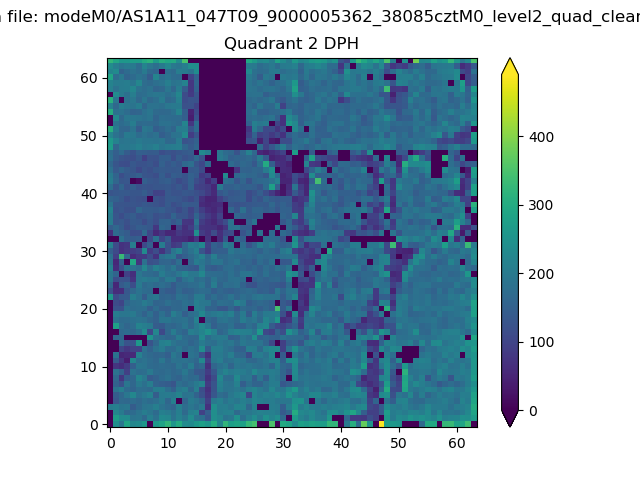 |
Quadrant C |
| Plot type | Count rate plots | Images |
|---|---|---|
| Comparison with Poisson distribution Blue bars denote a histogram of data divided into 1 sec bins. Red curve is a Poisson curve with rate = median count rate of data. |
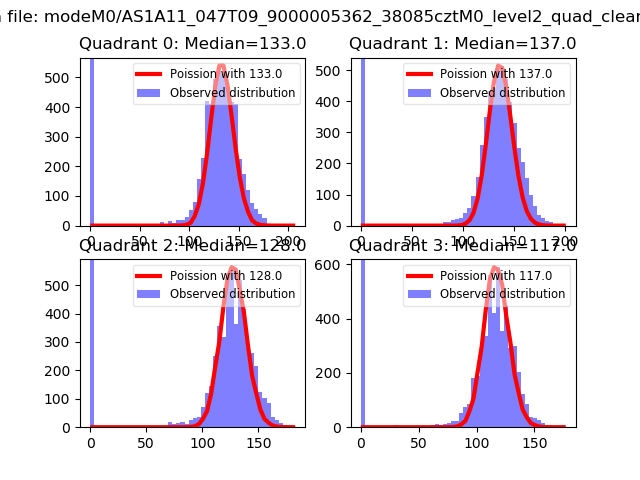 |
 |
| Quadrant-wise count rates Data is divided into 100 sec bins |
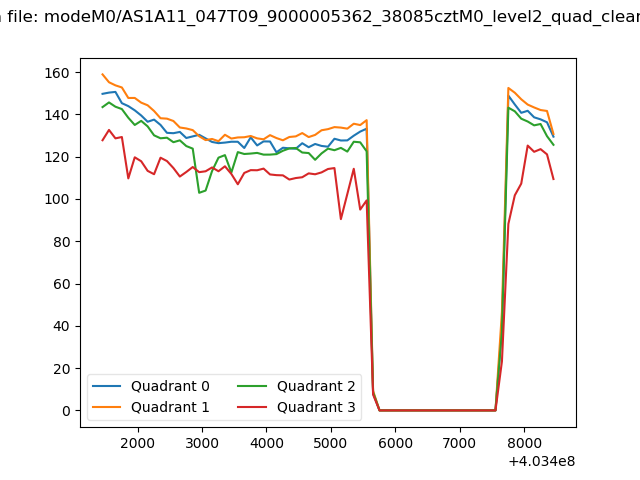 |
|
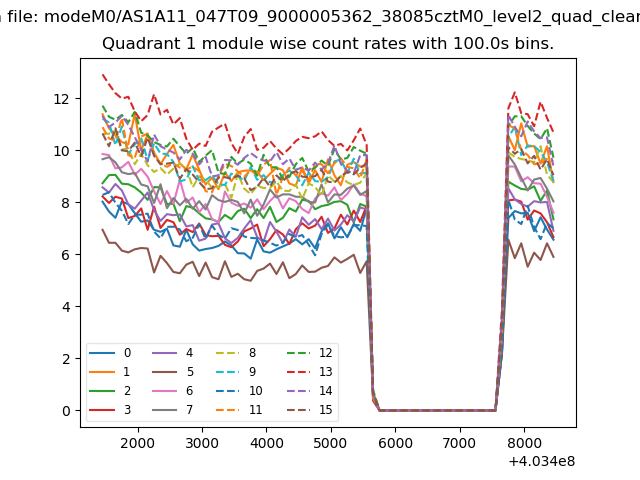
| Module-wise count rates for Quadrant A Data is divided into 100 sec bins |
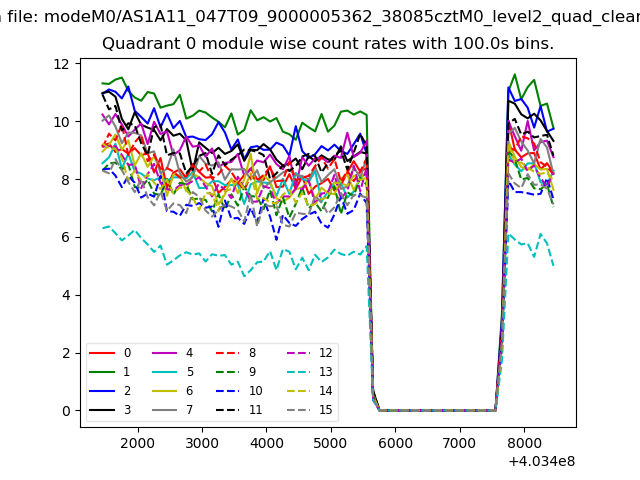 |
 |
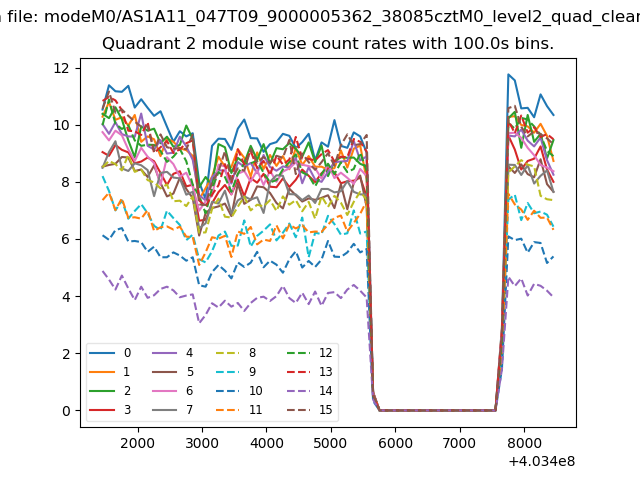
| Module-wise count rates for Quadrant B Data is divided into 100 sec bins |
 |
 |
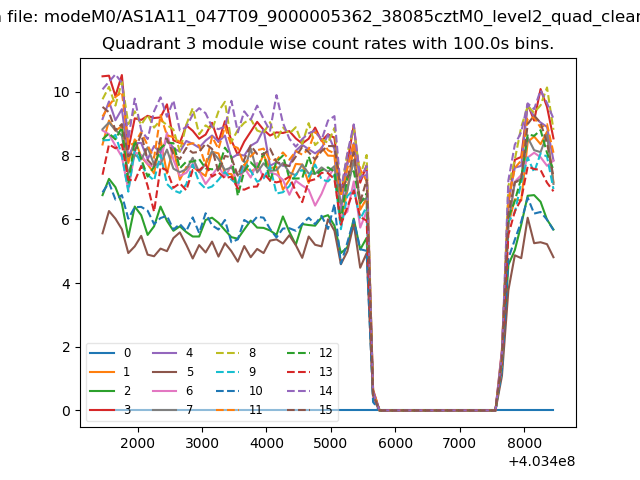
| Module-wise count rates for Quadrant C Data is divided into 100 sec bins |
 |
 |
| Module-wise count rates for Quadrant D Data is divided into 100 sec bins |
 |
 |
| Parameter | Plot |
|---|---|
| CZT HV Monitor | 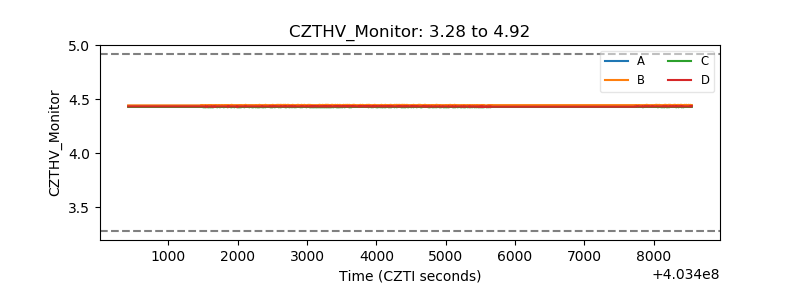 |
| D_VDD |  |
| Temperature 1 | 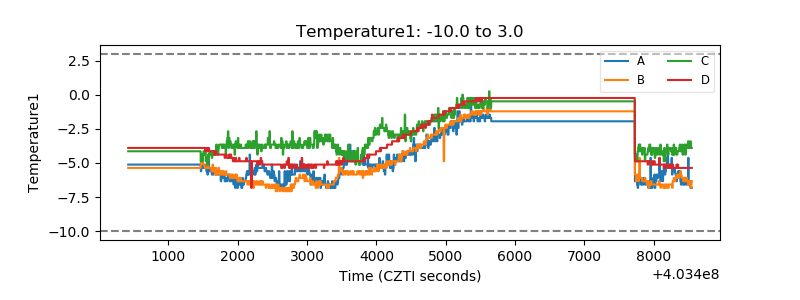 |
| Veto HV Monitor | 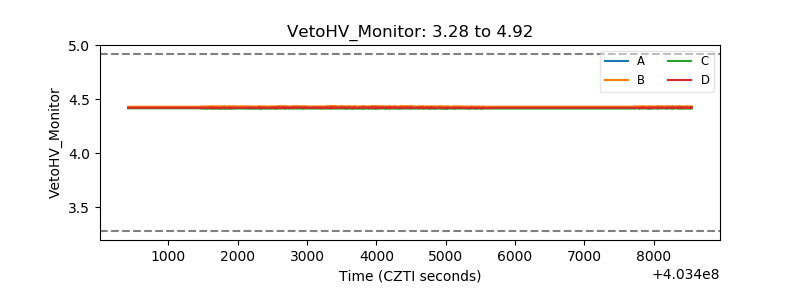 |
| Veto LLD | 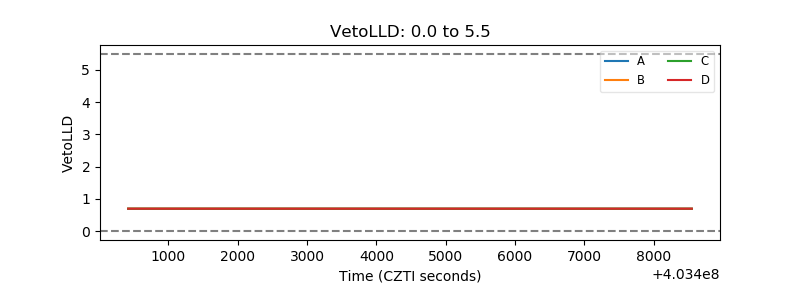 |
| Alpha Counter | 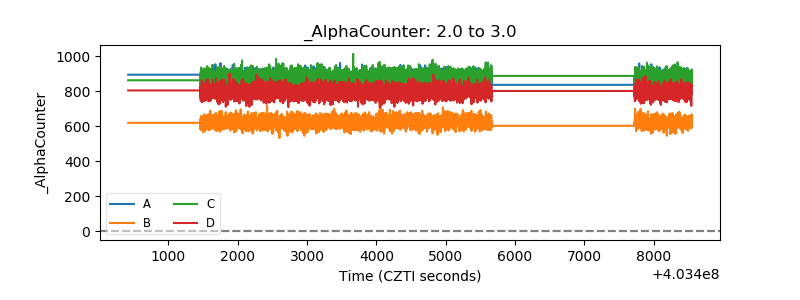 |
| _CPM_Rate | 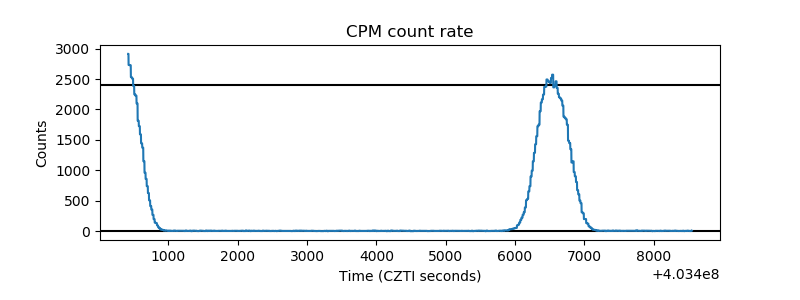 |
| CZT Counter | 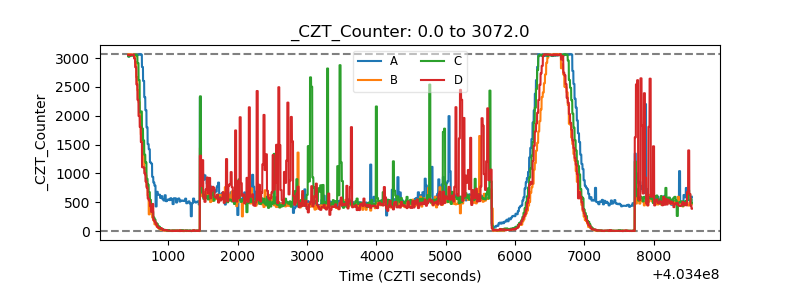 |
| +2.5 Volts monitor | 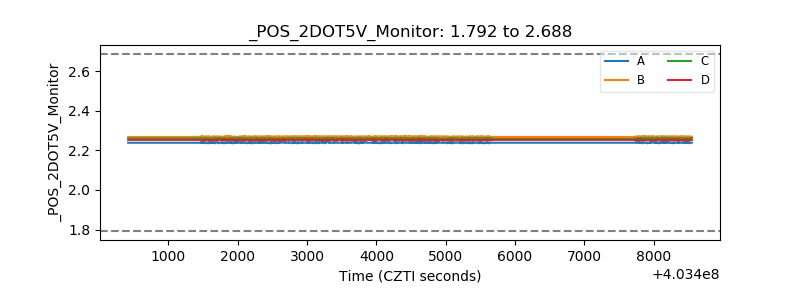 |
| +5 Volts monitor | 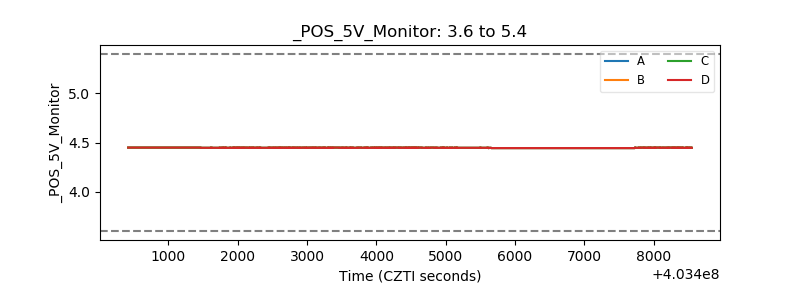 |
| _ROLL_ROT | 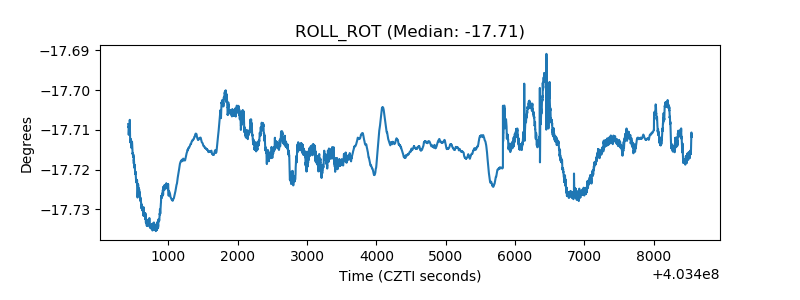 |
| _Roll_DEC | 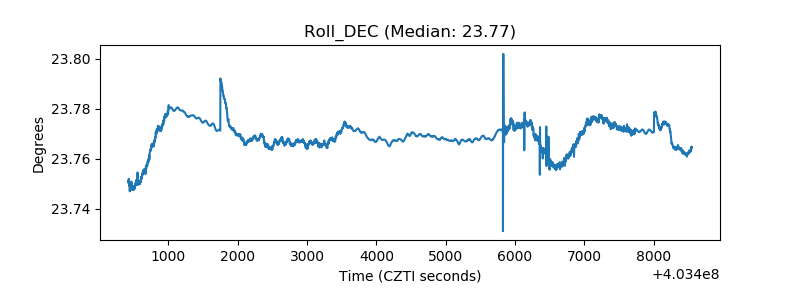 |
| _Roll_RA | 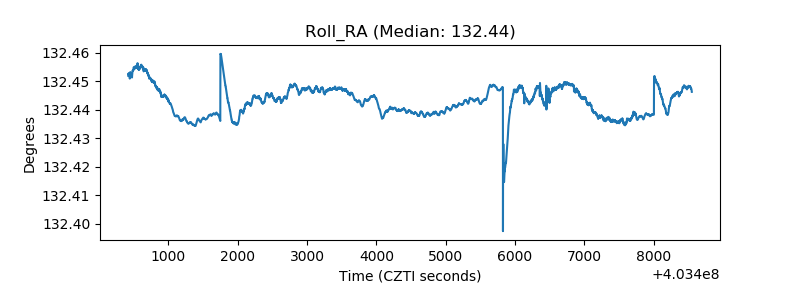 |
| Veto Counter | 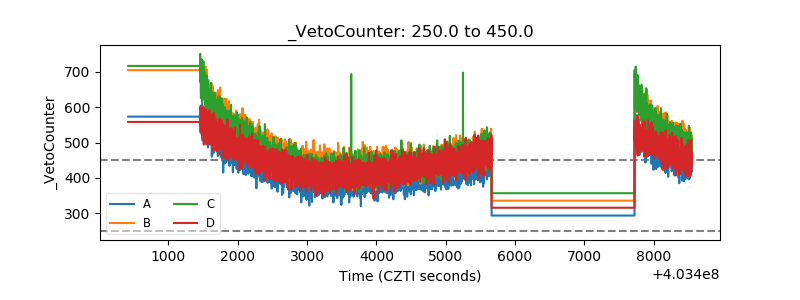 |