| Param | Original file | Final file |
|---|---|---|
| Filename | modeM0/AS1A11_047T09_9000005362_38086cztM0_level2.fits | modeM0/AS1A11_047T09_9000005362_38086cztM0_level2_quad_clean.evt |
| Size (bytes) | 619,280,640 | 171,267,840 |
| Size | 590.6 MB | 163.3 MB |
| Events in quadrant A | 5,134,638 | 1,185,854 |
| Events in quadrant B | 4,597,732 | 1,224,155 |
| Events in quadrant C | 6,118,080 | 1,115,683 |
| Events in quadrant D | 6,359,934 | 1,022,546 |
| Mode M0 | |||
|---|---|---|---|
| Quadrant | BADHDUFLAG | Total packets | Discarded packets |
| A | 0 | 20880 | 3 |
| B | 0 | 19435 | 2 |
| C | 0 | 23670 | 2 |
| D | 0 | 25082 | 2 |
| Mode SS | |||
|---|---|---|---|
| Quadrant | BADHDUFLAG | Total packets | Discarded packets |
| A | 0 | 188 | 0 |
| B | 0 | 188 | 0 |
| C | 0 | 188 | 0 |
| D | 0 | 188 | 0 |
| Mode M9 | |||
|---|---|---|---|
| Quadrant | BADHDUFLAG | Total packets | Discarded packets |
| A | 0 | 42 | 0 |
| B | 0 | 42 | 0 |
| C | 0 | 42 | 0 |
| D | 0 | 42 | 0 |
| Quadrant | Total seconds | Saturated seconds | Saturation percentage |
|---|---|---|---|
| A | 9202 | 29 | 0.315149% |
| B | 9202 | 32 | 0.347750% |
| C | 9202 | 391 | 4.249076% |
| D | 9202 | 392 | 4.259943% |
Noise dominated data is calculated using 1-second bins in cleaned event files. If a bin has >2000 counts, and if more than 50% of those come from <1% of pixels, then it is considered to be noise-dominated and hence unusable.
| Quadrant | # 1 sec bins | Bins with >0 counts | Bins with >2000 counts | High rate bins dominated by noise | Noise dominated (total time) | Noise dominated (detector-on time) | Marked lightcurve |
|---|---|---|---|---|---|---|---|
| A | 13388 | 9204 | 17 | 17 | 0.13% | 0.18% | 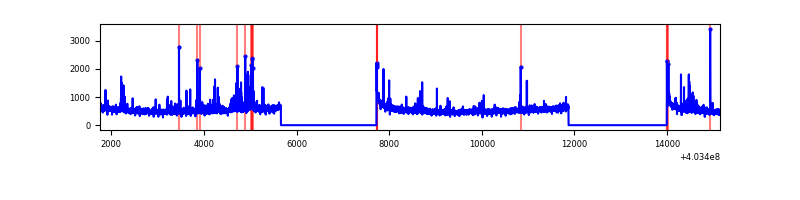 |
| B | 13388 | 9204 | 13 | 13 | 0.10% | 0.14% | 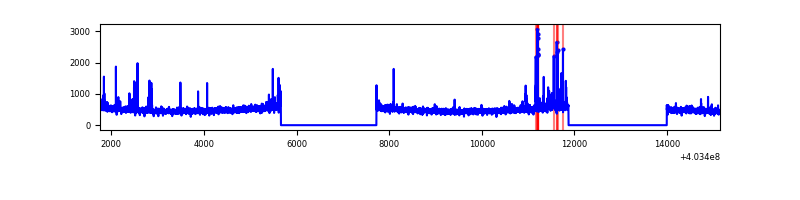 |
| C | 13388 | 9204 | 345 | 345 | 2.58% | 3.75% |  |
| D | 13388 | 9204 | 358 | 358 | 2.67% | 3.89% | 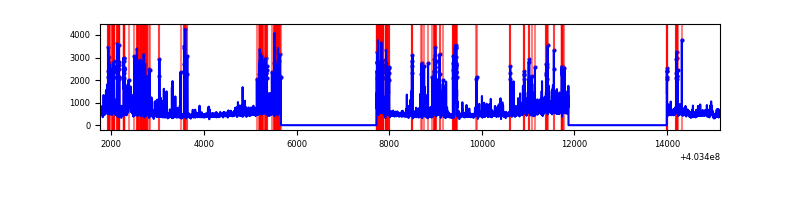 |
Top three noisy pixels from each quadrant. If the there are fewer than three noisy pixels in the level2.evt file, extra rows are filled as -1
| Pixel properties | Quadrant properties | ||||||
|---|---|---|---|---|---|---|---|
| Quadrant | DetID | PixID | Counts | Sigma | Mean | Median | Sigma |
| A | 10 | 83 | 517288 | 2309.12 | 1108 | 1088 | 223.5 |
| A | 12 | 16 | 141422 | 627.76 | 1108 | 1088 | 223.5 |
| A | 9 | 143 | 46538 | 203.31 | 1108 | 1088 | 223.5 |
| B | 0 | 229 | 110254 | 520.48 | 1112 | 1084 | 209.7 |
| B | 0 | 230 | 38514 | 178.45 | 1112 | 1084 | 209.7 |
| B | 4 | 232 | 26903 | 123.1 | 1112 | 1084 | 209.7 |
| C | 1 | 23 | 1543474 | 6340.61 | 1059 | 1069 | 243.3 |
| C | 15 | 214 | 367681 | 1507.09 | 1059 | 1069 | 243.3 |
| C | 0 | 10 | 33836 | 134.7 | 1059 | 1069 | 243.3 |
| D | 2 | 250 | 1041724 | 4074.09 | 1053 | 1023 | 255.4 |
| D | 13 | 249 | 293004 | 1143.03 | 1053 | 1023 | 255.4 |
| D | 1 | 52 | 224299 | 874.07 | 1053 | 1023 | 255.4 |
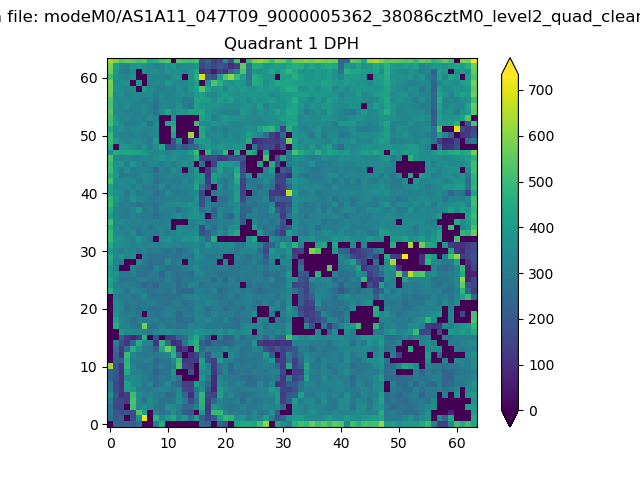
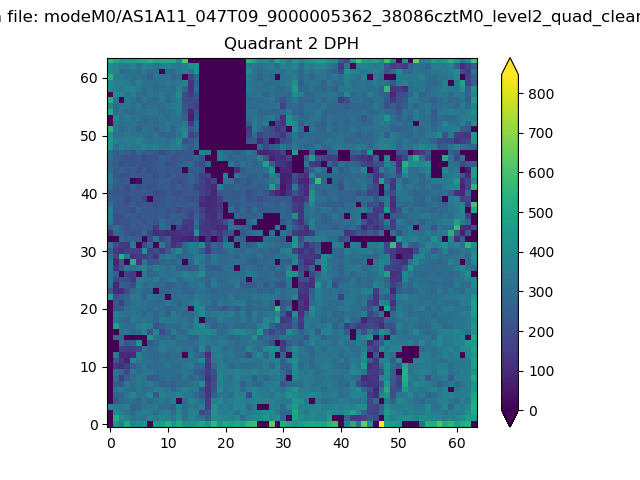
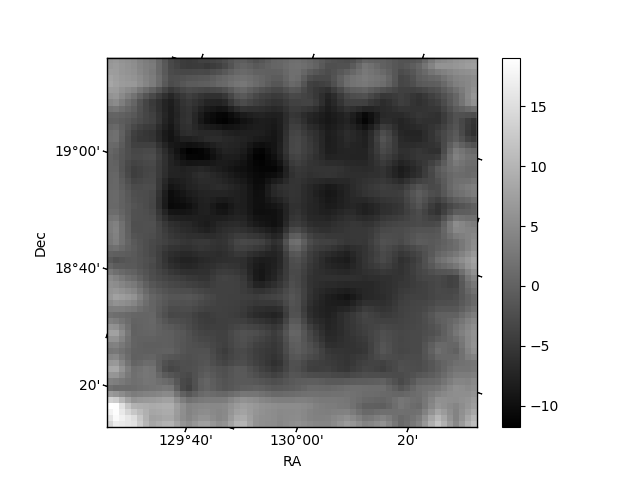
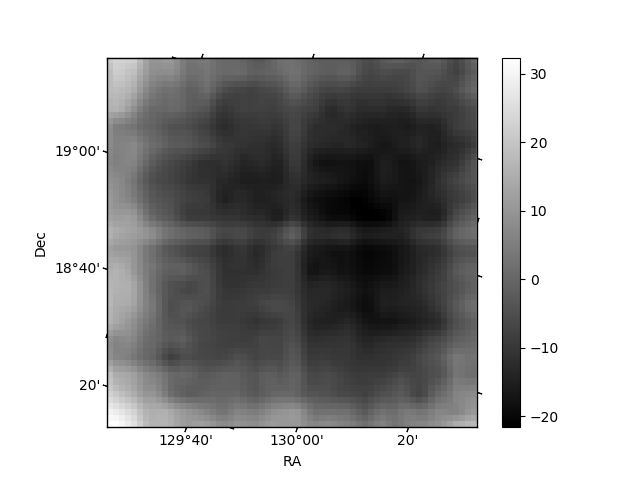
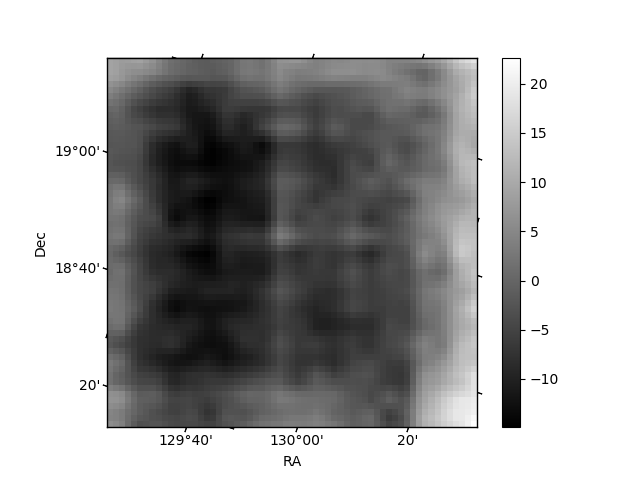
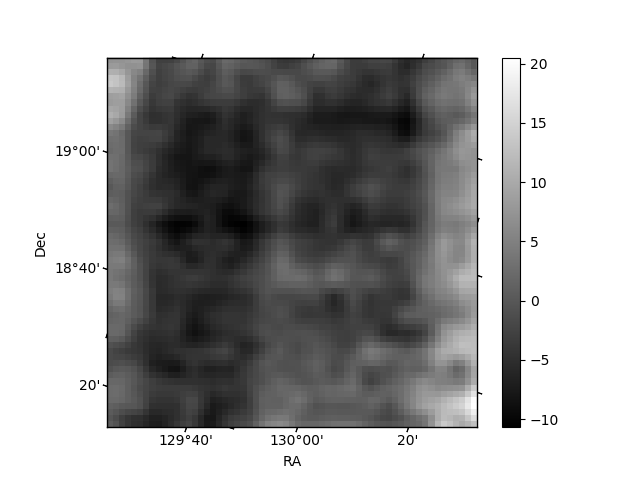
Histogram calculated using DETX and DETY for each event in the final _common_clean file
| Quadrant A | 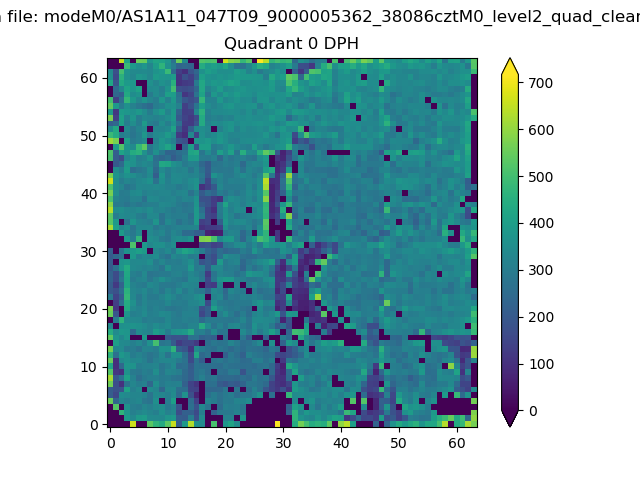 |
 |
Quadrant B |
|---|---|---|---|
| Quadrant D | 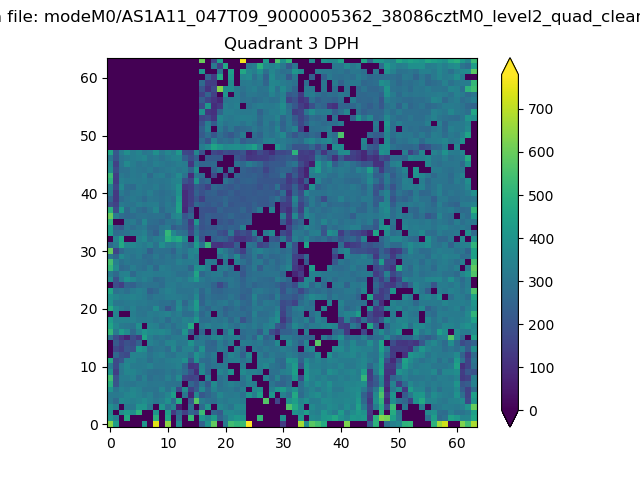 |
 |
Quadrant C |
| Plot type | Count rate plots | Images |
|---|---|---|
| Comparison with Poisson distribution Blue bars denote a histogram of data divided into 1 sec bins. Red curve is a Poisson curve with rate = median count rate of data. |
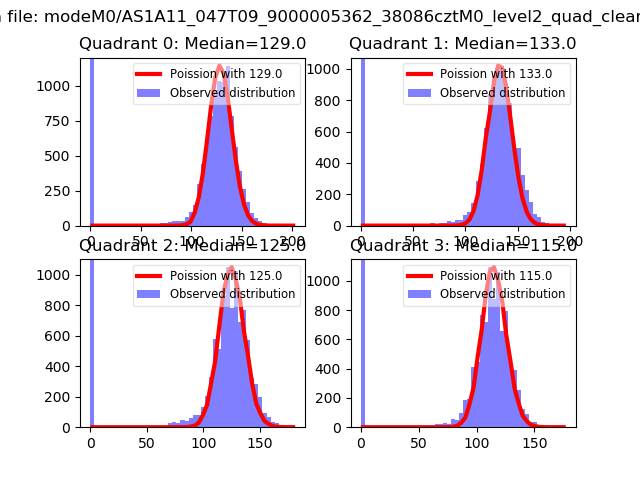 |
 |
| Quadrant-wise count rates Data is divided into 100 sec bins |
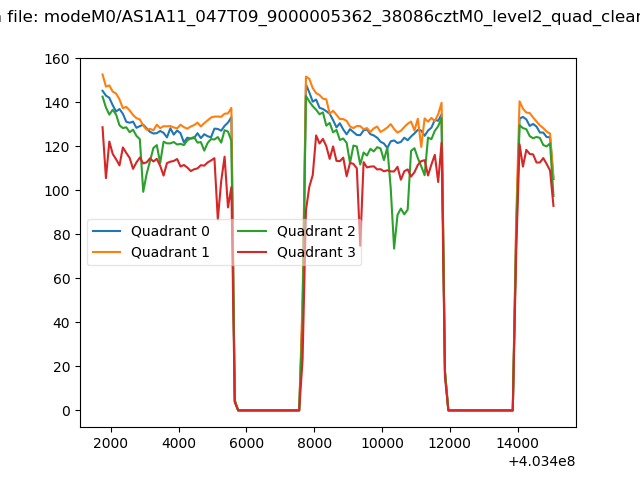 |
|
| Module-wise count rates for Quadrant A Data is divided into 100 sec bins |
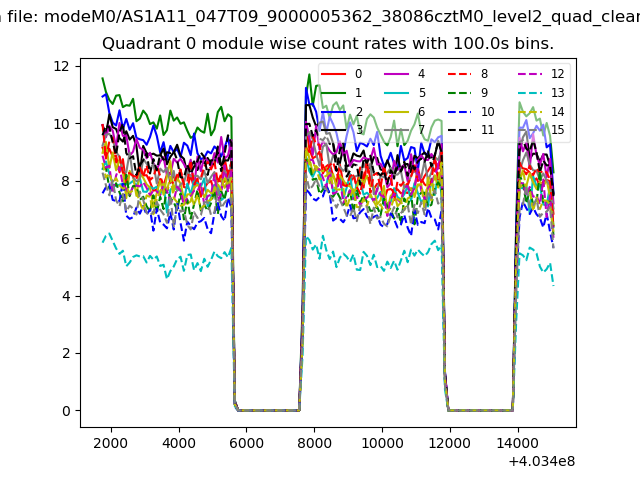 |
 |
| Module-wise count rates for Quadrant B Data is divided into 100 sec bins |
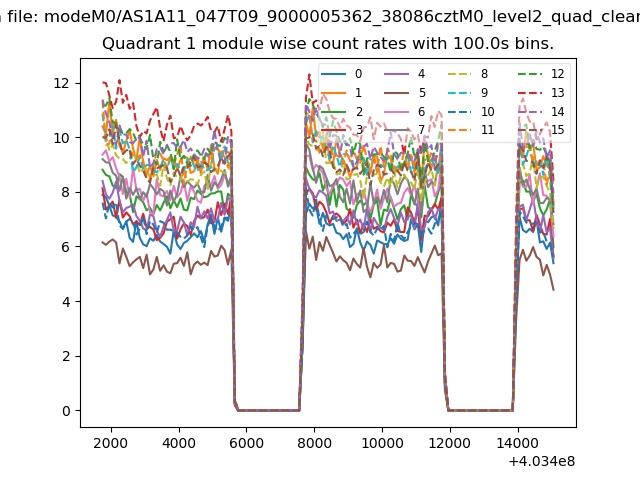 |
 |
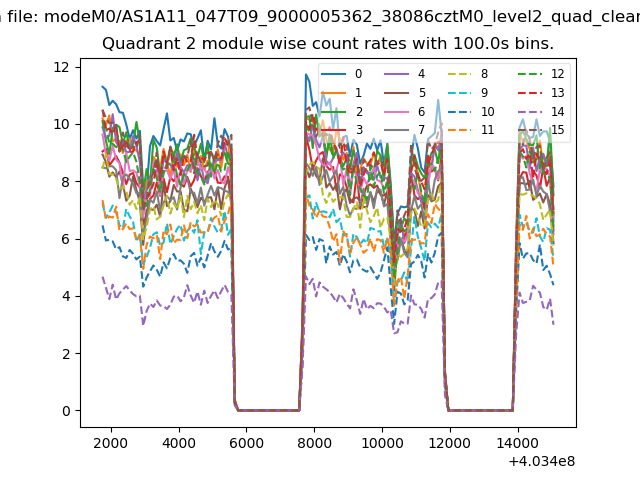
| Module-wise count rates for Quadrant C Data is divided into 100 sec bins |
 |
 |
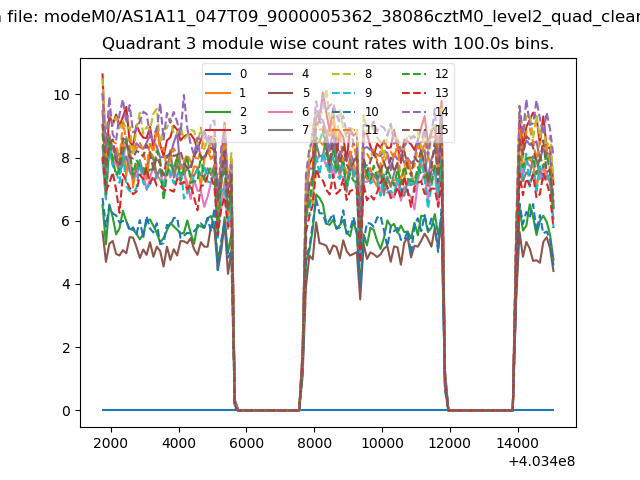
| Module-wise count rates for Quadrant D Data is divided into 100 sec bins |
 |
 |
| Parameter | Plot |
|---|---|
| CZT HV Monitor | 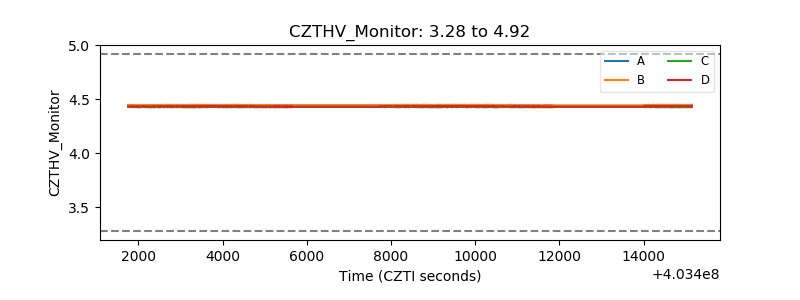 |
| D_VDD | 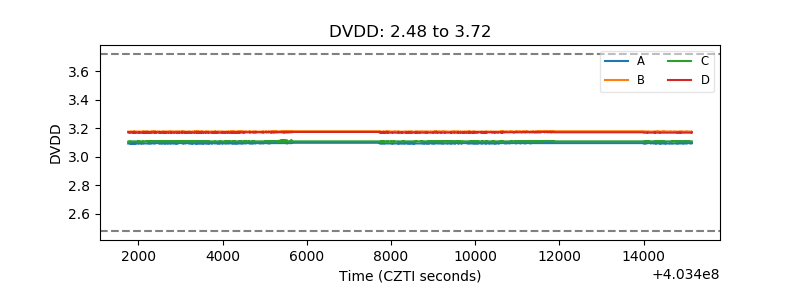 |
| Temperature 1 | 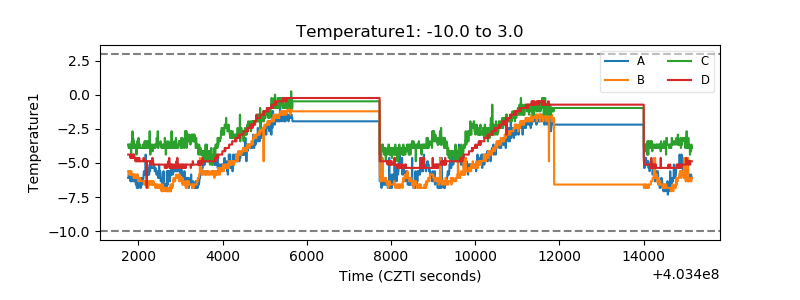 |
| Veto HV Monitor | 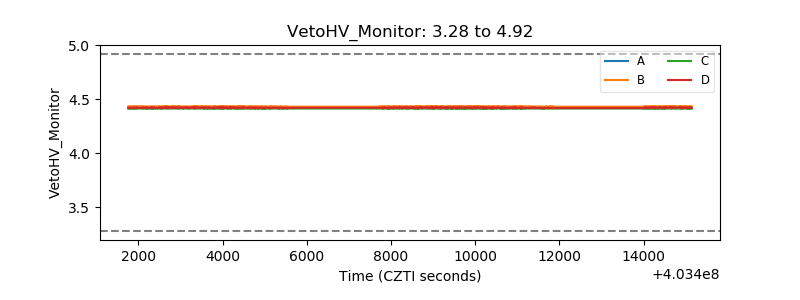 |
| Veto LLD | 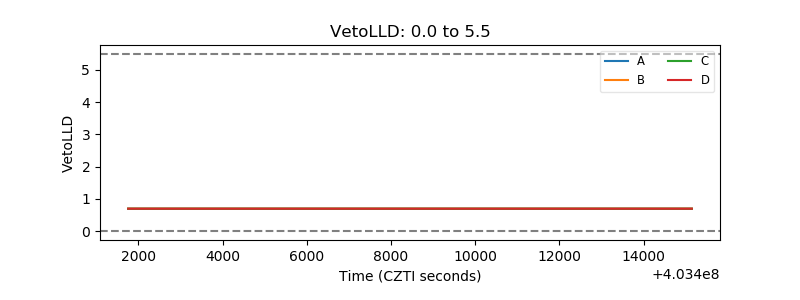 |
| Alpha Counter | 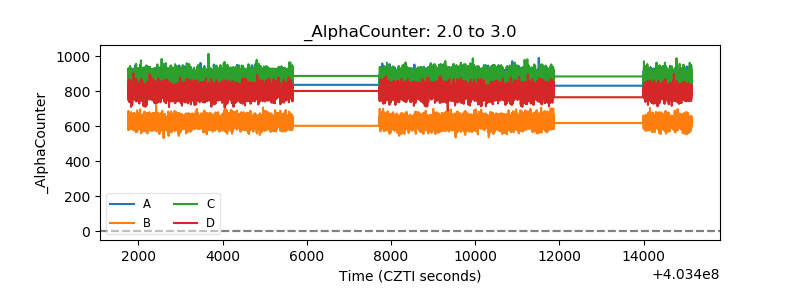 |
| _CPM_Rate | 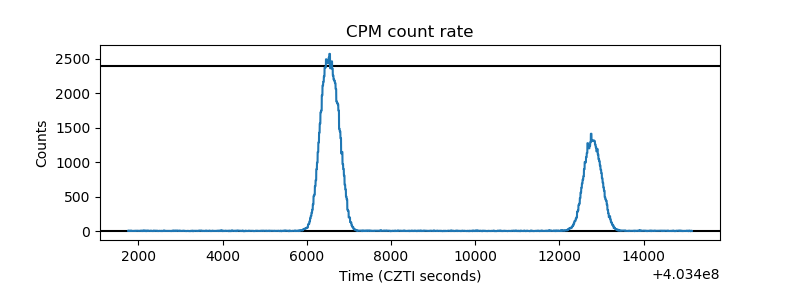 |
| CZT Counter | 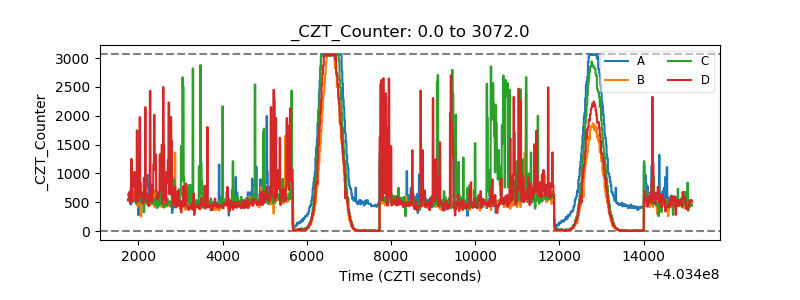 |
| +2.5 Volts monitor | 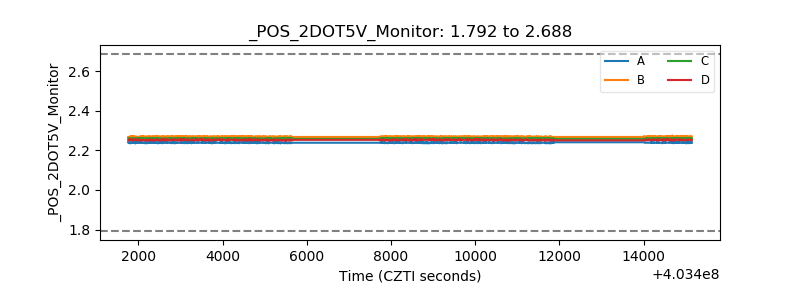 |
| +5 Volts monitor | 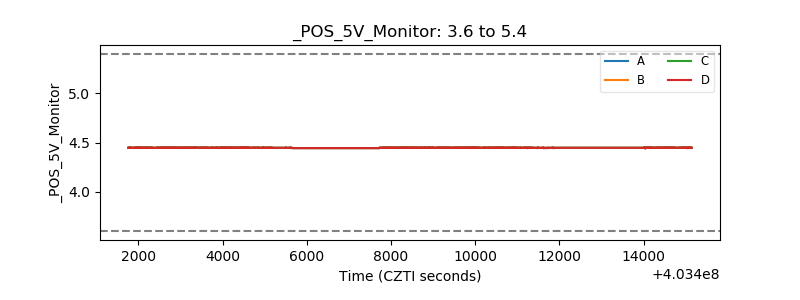 |
| _ROLL_ROT | 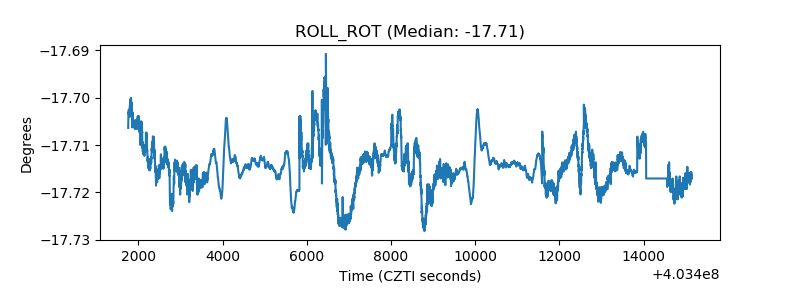 |
| _Roll_DEC | 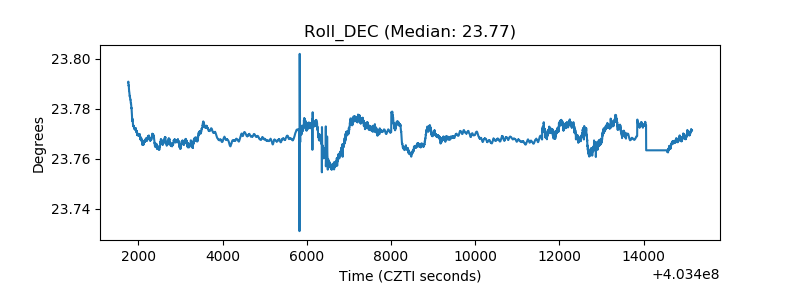 |
| _Roll_RA |  |
| Veto Counter | 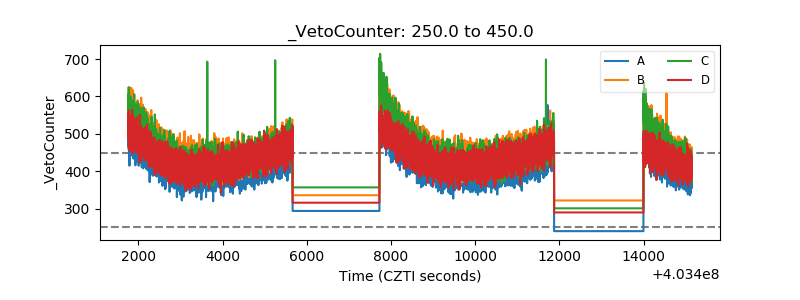 |