| Param | Original file | Final file |
|---|---|---|
| Filename | modeM0/AS1A11_047T09_9000005362_38088cztM0_level2.fits | modeM0/AS1A11_047T09_9000005362_38088cztM0_level2_quad_clean.evt |
| Size (bytes) | 349,384,320 | 91,203,840 |
| Size | 333.2 MB | 87.0 MB |
| Events in quadrant A | 2,949,604 | 621,611 |
| Events in quadrant B | 2,828,334 | 628,813 |
| Events in quadrant C | 2,838,265 | 601,964 |
| Events in quadrant D | 3,907,692 | 541,342 |
| Mode M0 | |||
|---|---|---|---|
| Quadrant | BADHDUFLAG | Total packets | Discarded packets |
| A | 0 | 11921 | 2 |
| B | 0 | 11890 | 1 |
| C | 0 | 11564 | 1 |
| D | 0 | 15274 | 1 |
| Mode SS | |||
|---|---|---|---|
| Quadrant | BADHDUFLAG | Total packets | Discarded packets |
| A | 0 | 106 | 0 |
| B | 0 | 106 | 0 |
| C | 0 | 106 | 0 |
| D | 0 | 106 | 0 |
| Mode M9 | |||
|---|---|---|---|
| Quadrant | BADHDUFLAG | Total packets | Discarded packets |
| A | 0 | 20 | 0 |
| B | 0 | 20 | 0 |
| C | 0 | 20 | 0 |
| D | 0 | 20 | 0 |
| Quadrant | Total seconds | Saturated seconds | Saturation percentage |
|---|---|---|---|
| A | 5257 | 26 | 0.494579% |
| B | 5257 | 102 | 1.940270% |
| C | 5257 | 20 | 0.380445% |
| D | 5257 | 297 | 5.649610% |
Noise dominated data is calculated using 1-second bins in cleaned event files. If a bin has >2000 counts, and if more than 50% of those come from <1% of pixels, then it is considered to be noise-dominated and hence unusable.
| Quadrant | # 1 sec bins | Bins with >0 counts | Bins with >2000 counts | High rate bins dominated by noise | Noise dominated (total time) | Noise dominated (detector-on time) | Marked lightcurve |
|---|---|---|---|---|---|---|---|
| A | 7199 | 5258 | 19 | 19 | 0.26% | 0.36% | 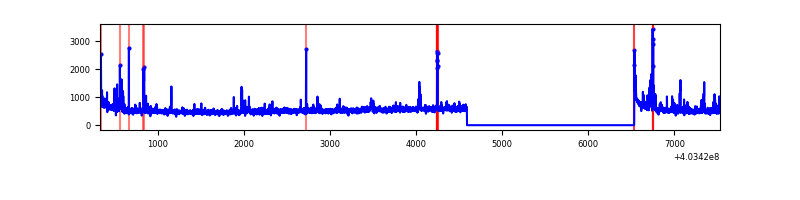 |
| B | 7199 | 5258 | 70 | 70 | 0.97% | 1.33% | 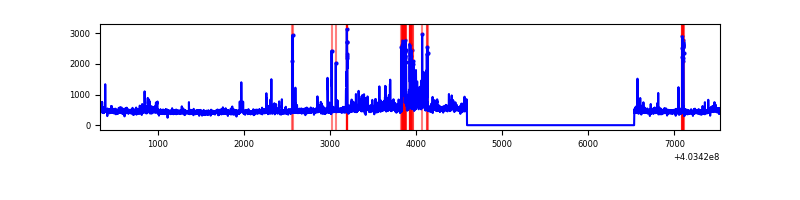 |
| C | 7199 | 5258 | 18 | 18 | 0.25% | 0.34% | 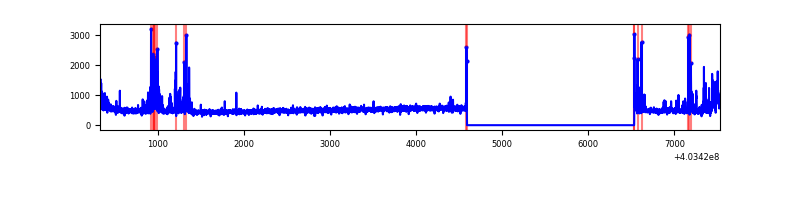 |
| D | 7199 | 5258 | 240 | 240 | 3.33% | 4.56% | 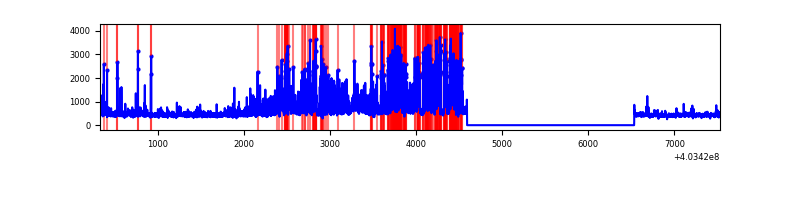 |
Top three noisy pixels from each quadrant. If the there are fewer than three noisy pixels in the level2.evt file, extra rows are filled as -1
| Pixel properties | Quadrant properties | ||||||
|---|---|---|---|---|---|---|---|
| Quadrant | DetID | PixID | Counts | Sigma | Mean | Median | Sigma |
| A | 10 | 83 | 333974 | 2703.42 | 612 | 601 | 123.3 |
| A | 9 | 143 | 67972 | 546.33 | 612 | 601 | 123.3 |
| A | 12 | 16 | 53581 | 429.63 | 612 | 601 | 123.3 |
| B | 0 | 229 | 159224 | 1361.69 | 602 | 586 | 116.5 |
| B | 15 | 85 | 140161 | 1198.06 | 602 | 586 | 116.5 |
| B | 5 | 172 | 91850 | 783.38 | 602 | 586 | 116.5 |
| C | 1 | 23 | 223794 | 1624.27 | 591 | 595 | 137.4 |
| C | 15 | 214 | 219407 | 1592.34 | 591 | 595 | 137.4 |
| C | 5 | 250 | 39059 | 279.91 | 591 | 595 | 137.4 |
| D | 5 | 222 | 1319272 | 9132.39 | 584 | 568 | 144.4 |
| D | 13 | 249 | 124646 | 859.27 | 584 | 568 | 144.4 |
| D | 7 | 223 | 54406 | 372.84 | 584 | 568 | 144.4 |
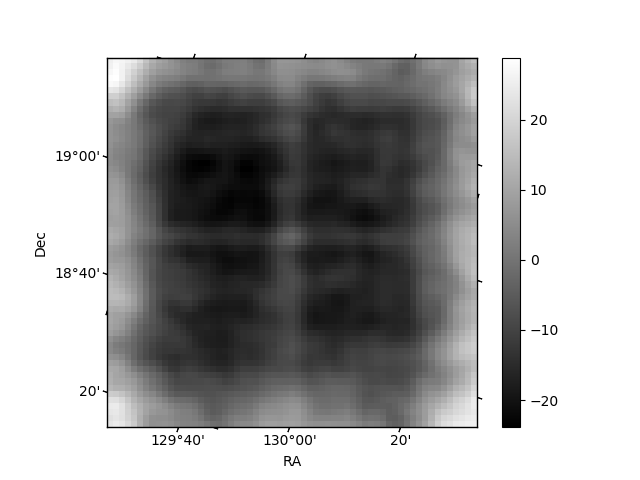
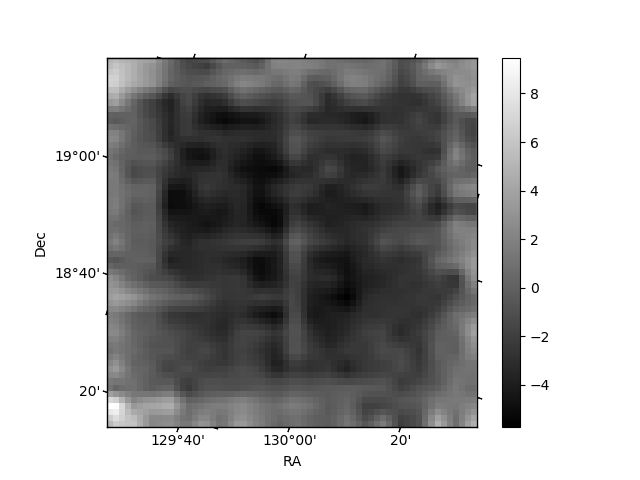
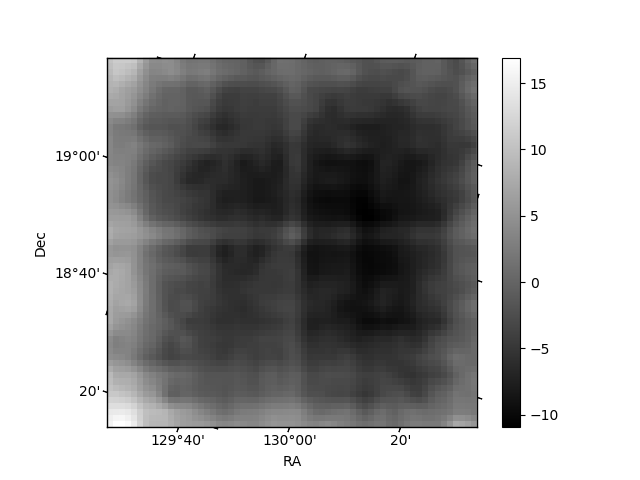
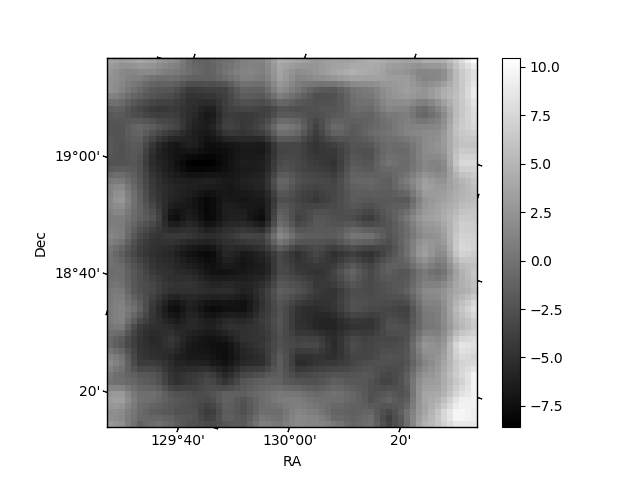
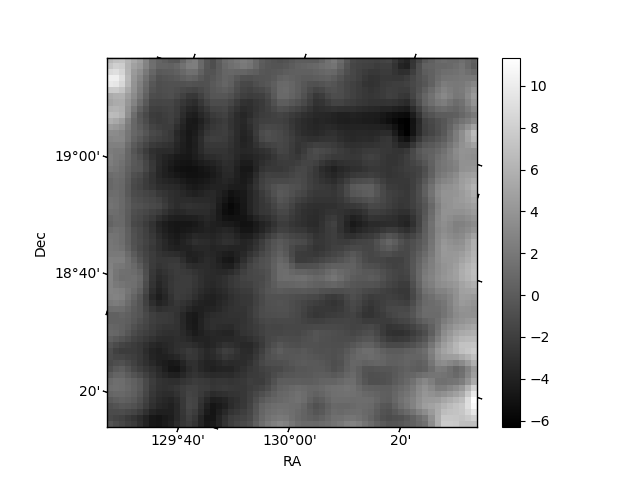
Histogram calculated using DETX and DETY for each event in the final _common_clean file
| Quadrant A | 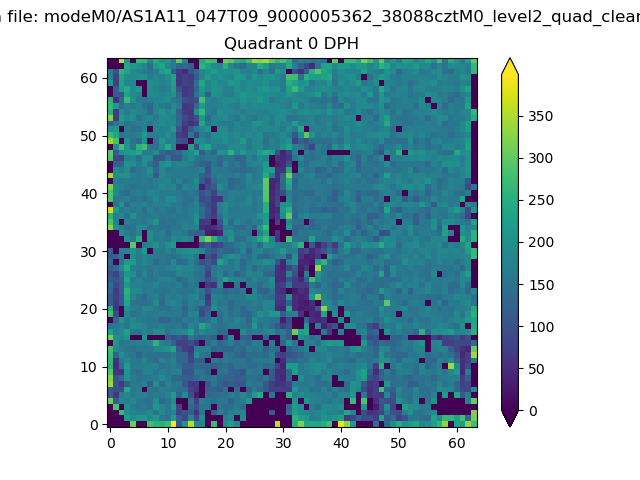 |
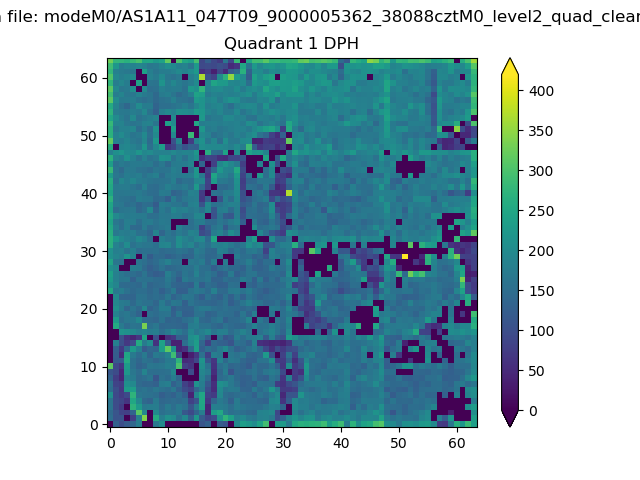 |
Quadrant B |
|---|---|---|---|
| Quadrant D | 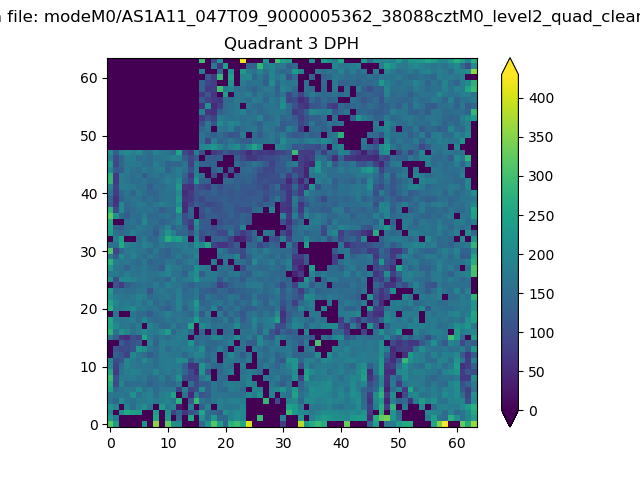 |
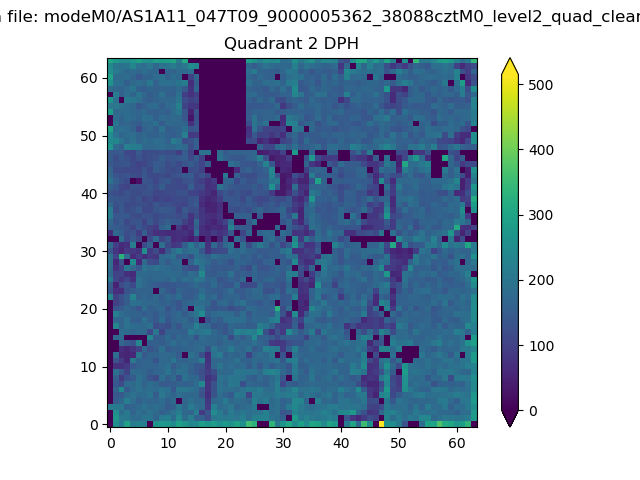 |
Quadrant C |
| Plot type | Count rate plots | Images |
|---|---|---|
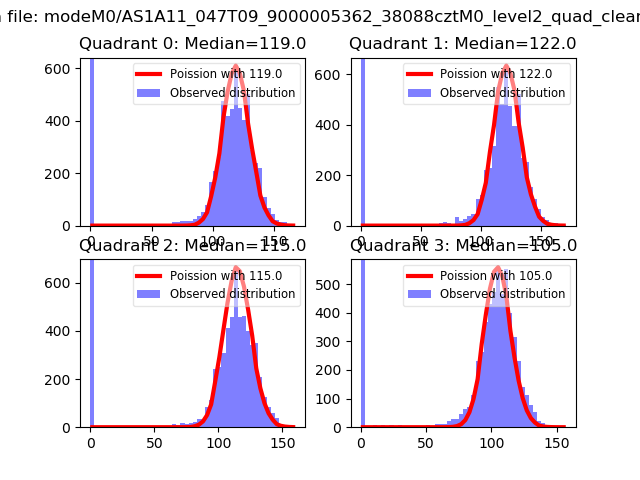
| Comparison with Poisson distribution Blue bars denote a histogram of data divided into 1 sec bins. Red curve is a Poisson curve with rate = median count rate of data. |
 |
 |
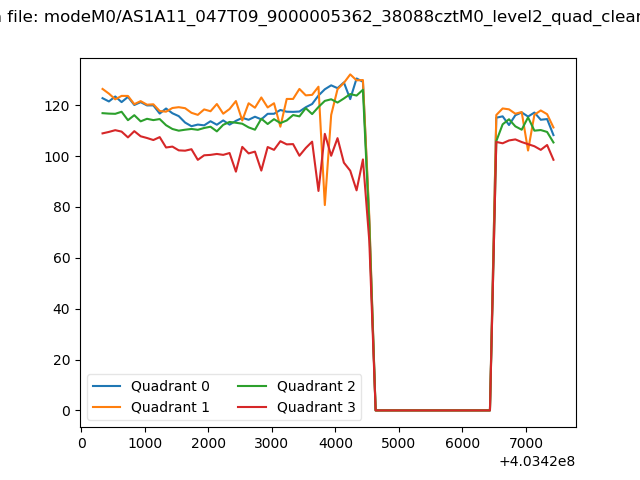
| Quadrant-wise count rates Data is divided into 100 sec bins |
 |
|
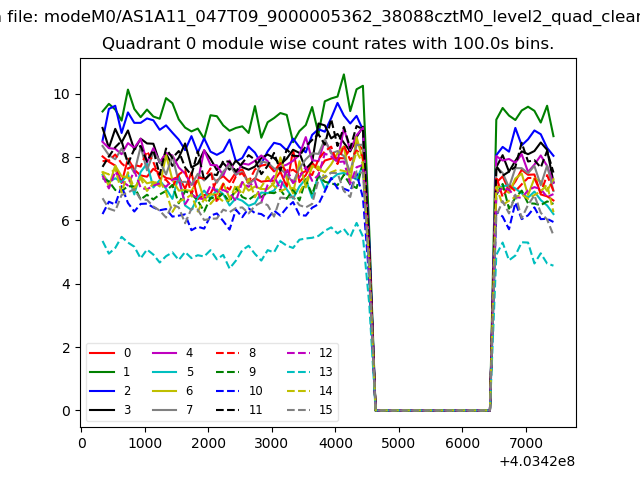
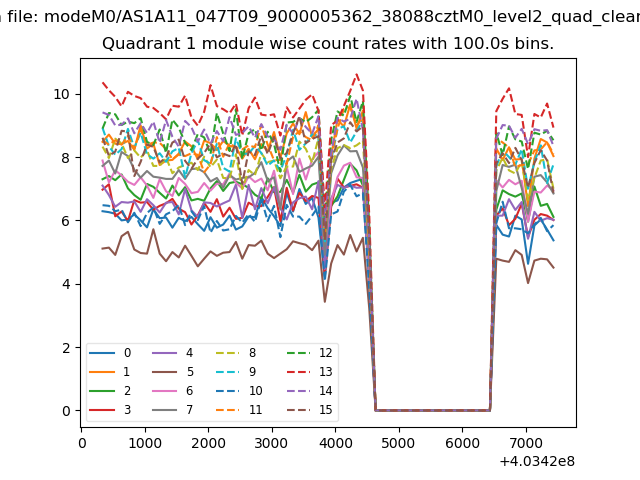
| Module-wise count rates for Quadrant A Data is divided into 100 sec bins |
 |
 |
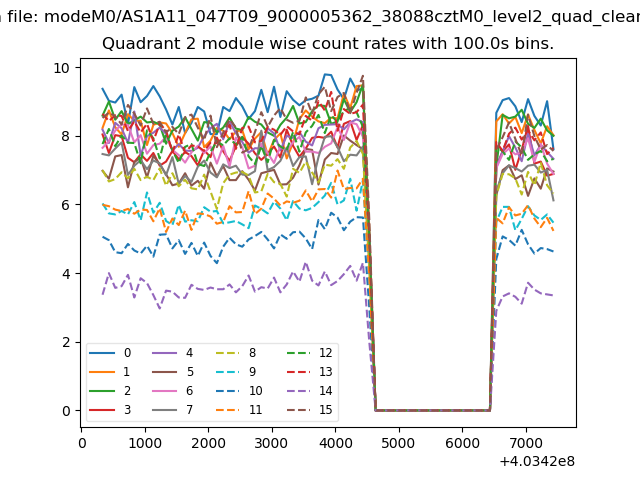
| Module-wise count rates for Quadrant B Data is divided into 100 sec bins |
 |
 |
| Module-wise count rates for Quadrant C Data is divided into 100 sec bins |
 |
 |
| Module-wise count rates for Quadrant D Data is divided into 100 sec bins |
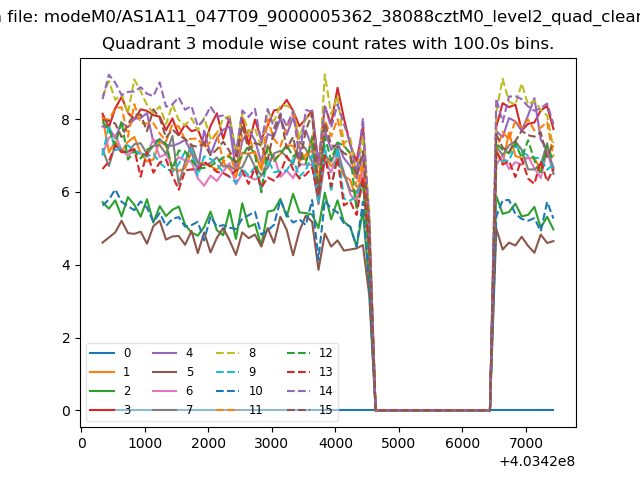 |
 |
| Parameter | Plot |
|---|---|
| CZT HV Monitor | 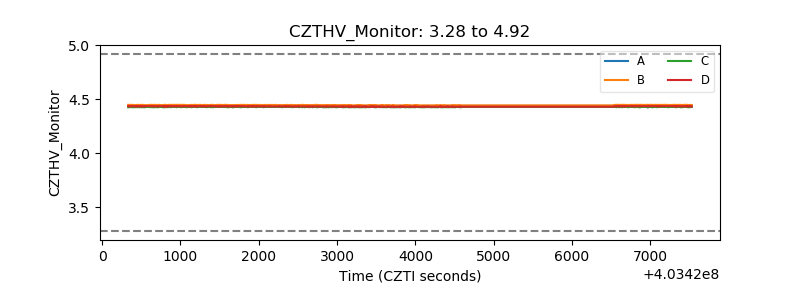 |
| D_VDD | 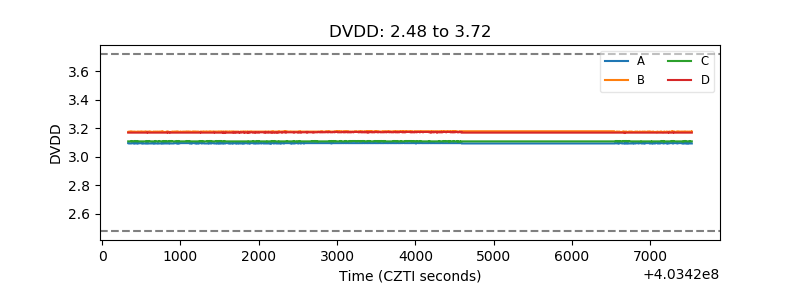 |
| Temperature 1 | 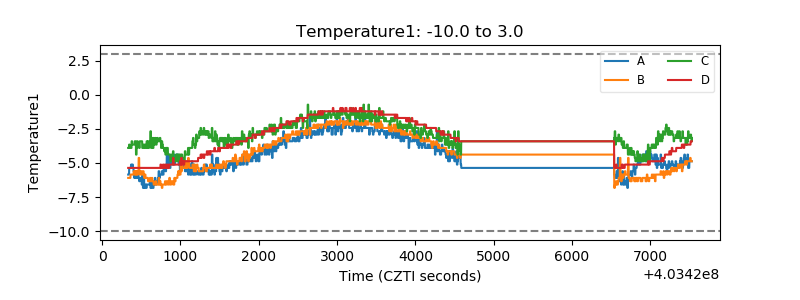 |
| Veto HV Monitor | 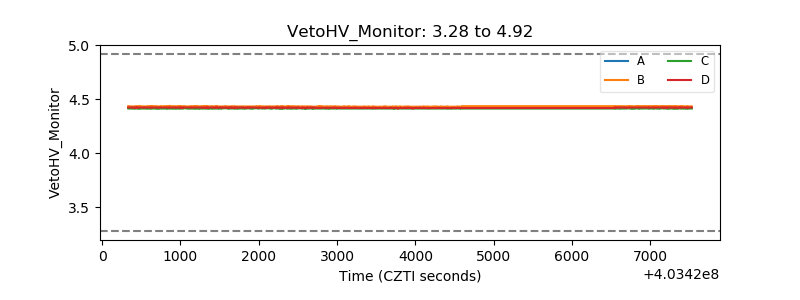 |
| Veto LLD | 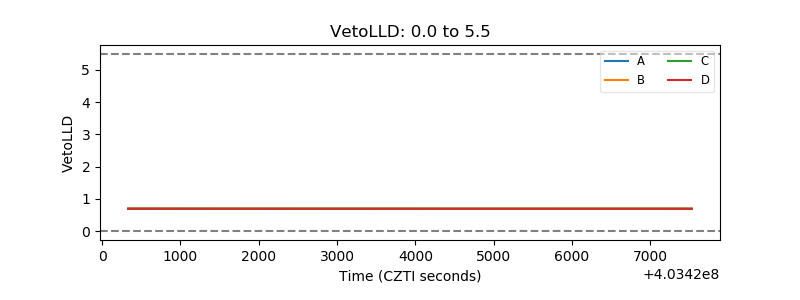 |
| Alpha Counter | 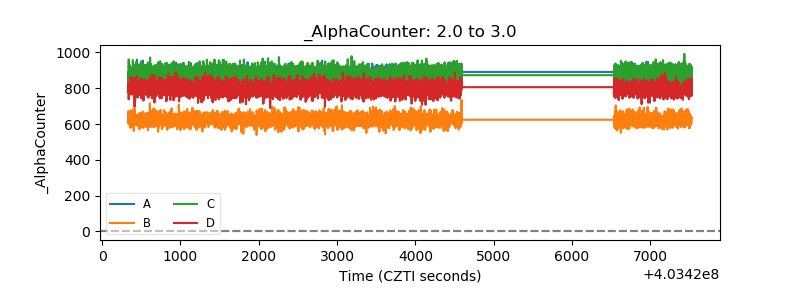 |
| _CPM_Rate | 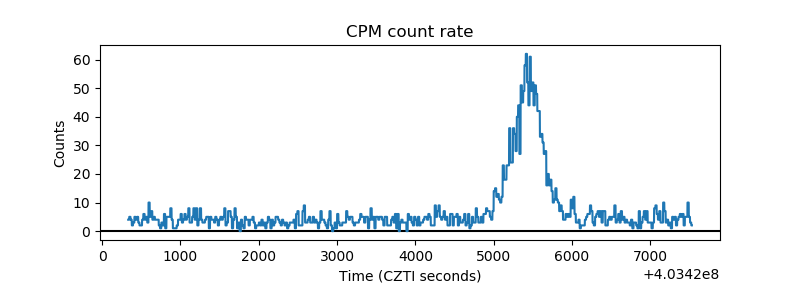 |
| CZT Counter | 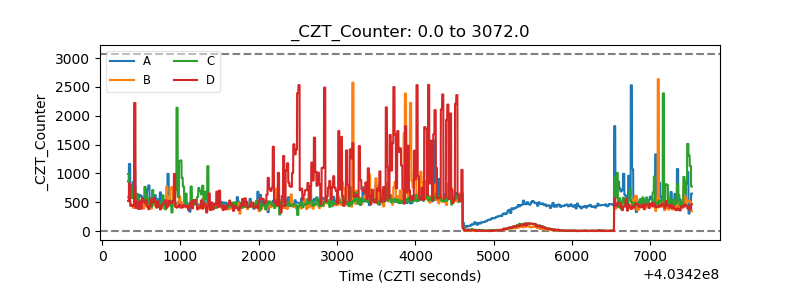 |
| +2.5 Volts monitor |  |
| +5 Volts monitor | 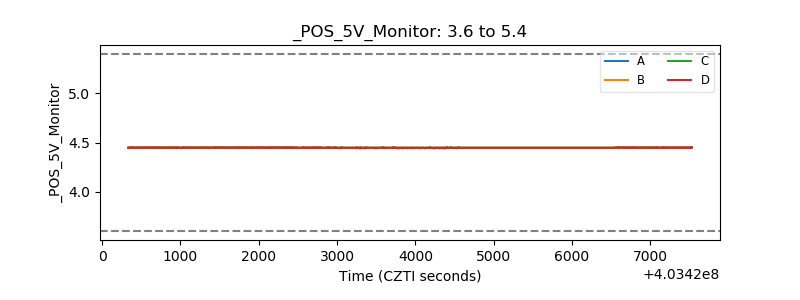 |
| _ROLL_ROT | 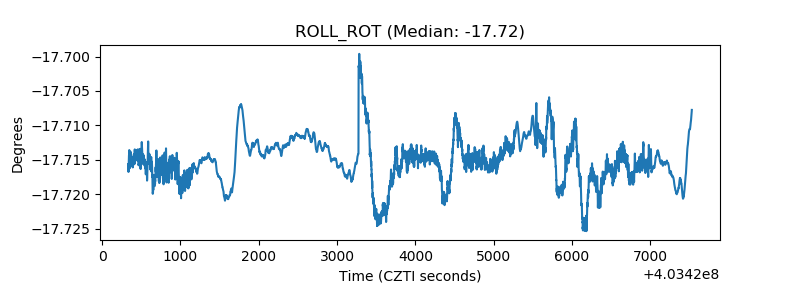 |
| _Roll_DEC | 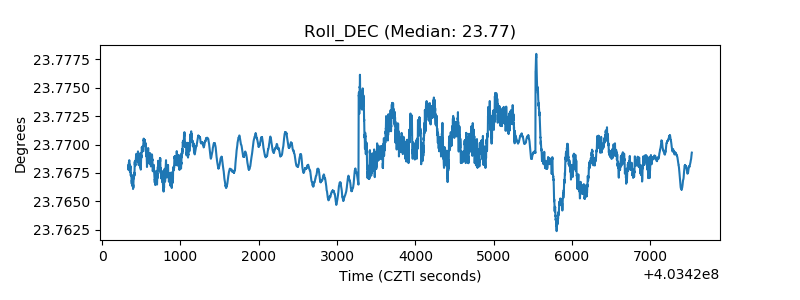 |
| _Roll_RA | 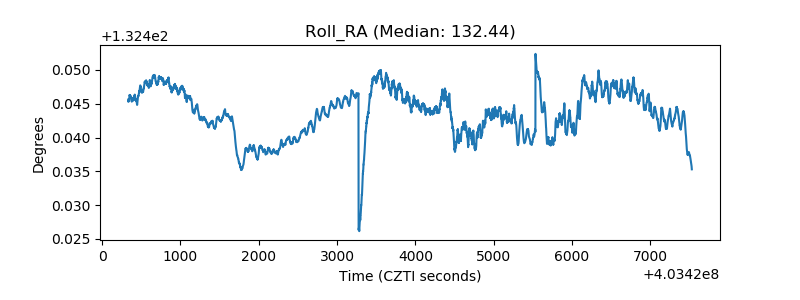 |
| Veto Counter | 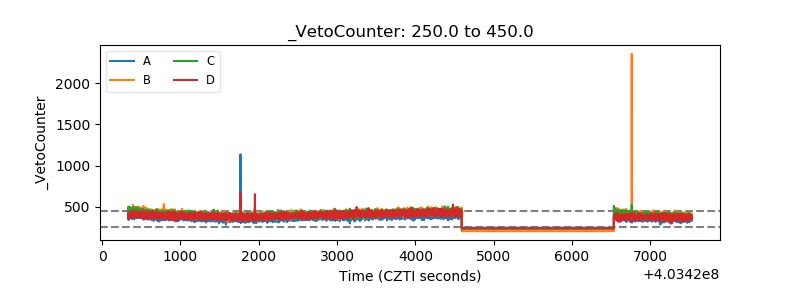 |