| Param | Original file | Final file |
|---|---|---|
| Filename | modeM0/AS1A11_047T09_9000005362_38089cztM0_level2.fits | modeM0/AS1A11_047T09_9000005362_38089cztM0_level2_quad_clean.evt |
| Size (bytes) | 385,908,480 | 94,023,360 |
| Size | 368.0 MB | 89.7 MB |
| Events in quadrant A | 3,056,819 | 641,732 |
| Events in quadrant B | 3,049,796 | 651,641 |
| Events in quadrant C | 3,661,035 | 620,593 |
| Events in quadrant D | 4,085,239 | 543,996 |
| Mode M0 | |||
|---|---|---|---|
| Quadrant | BADHDUFLAG | Total packets | Discarded packets |
| A | 0 | 12261 | 3 |
| B | 0 | 12589 | 2 |
| C | 0 | 14384 | 2 |
| D | 0 | 15903 | 2 |
| Mode SS | |||
|---|---|---|---|
| Quadrant | BADHDUFLAG | Total packets | Discarded packets |
| A | 0 | 114 | 0 |
| B | 0 | 114 | 0 |
| C | 0 | 114 | 0 |
| D | 0 | 114 | 0 |
| Mode M9 | |||
|---|---|---|---|
| Quadrant | BADHDUFLAG | Total packets | Discarded packets |
| A | 0 | 16 | 0 |
| B | 0 | 16 | 0 |
| C | 0 | 16 | 0 |
| D | 0 | 16 | 0 |
| Quadrant | Total seconds | Saturated seconds | Saturation percentage |
|---|---|---|---|
| A | 5556 | 24 | 0.431965% |
| B | 5556 | 100 | 1.799856% |
| C | 5556 | 79 | 1.421886% |
| D | 5556 | 421 | 7.577394% |
Noise dominated data is calculated using 1-second bins in cleaned event files. If a bin has >2000 counts, and if more than 50% of those come from <1% of pixels, then it is considered to be noise-dominated and hence unusable.
| Quadrant | # 1 sec bins | Bins with >0 counts | Bins with >2000 counts | High rate bins dominated by noise | Noise dominated (total time) | Noise dominated (detector-on time) | Marked lightcurve |
|---|---|---|---|---|---|---|---|
| A | 7169 | 5557 | 13 | 13 | 0.18% | 0.23% | 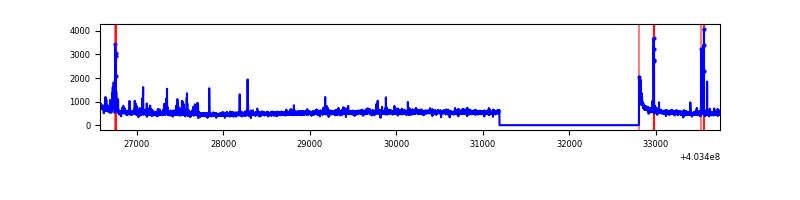 |
| B | 7169 | 5557 | 67 | 67 | 0.93% | 1.21% | 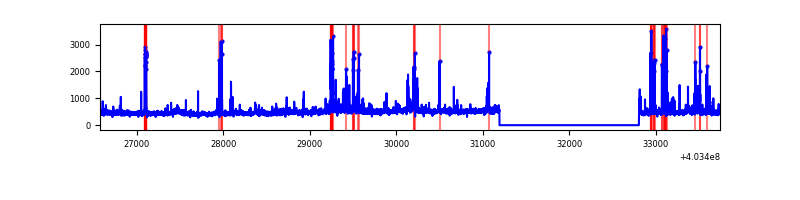 |
| C | 7169 | 5557 | 101 | 101 | 1.41% | 1.82% | 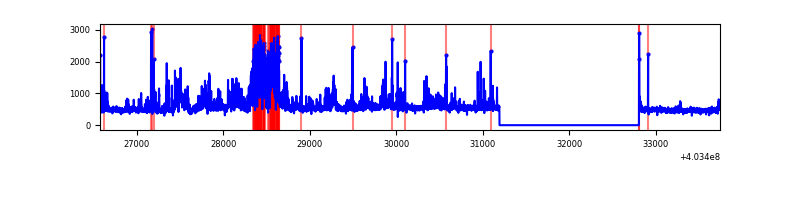 |
| D | 7169 | 5557 | 371 | 371 | 5.18% | 6.68% | 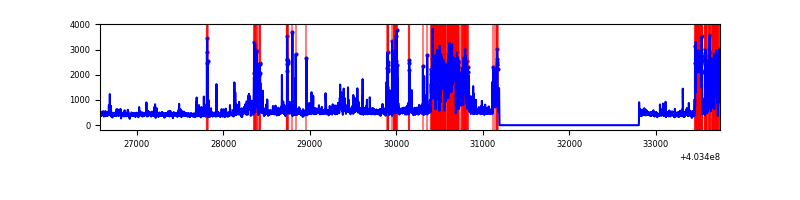 |
Top three noisy pixels from each quadrant. If the there are fewer than three noisy pixels in the level2.evt file, extra rows are filled as -1
| Pixel properties | Quadrant properties | ||||||
|---|---|---|---|---|---|---|---|
| Quadrant | DetID | PixID | Counts | Sigma | Mean | Median | Sigma |
| A | 10 | 83 | 362590 | 2771.22 | 646 | 634 | 130.6 |
| A | 9 | 143 | 73960 | 561.4 | 646 | 634 | 130.6 |
| A | 7 | 3 | 48752 | 368.4 | 646 | 634 | 130.6 |
| B | 0 | 229 | 294353 | 2375.93 | 637 | 620 | 123.6 |
| B | 5 | 172 | 99658 | 801.09 | 637 | 620 | 123.6 |
| B | 12 | 18 | 37366 | 297.23 | 637 | 620 | 123.6 |
| C | 1 | 23 | 855033 | 5856.95 | 625 | 627 | 145.9 |
| C | 15 | 214 | 232775 | 1591.37 | 625 | 627 | 145.9 |
| C | 14 | 254 | 64279 | 436.33 | 625 | 627 | 145.9 |
| D | 1 | 52 | 794068 | 5295.69 | 614 | 598 | 149.8 |
| D | 12 | 2 | 411996 | 2745.71 | 614 | 598 | 149.8 |
| D | 7 | 223 | 130229 | 865.17 | 614 | 598 | 149.8 |
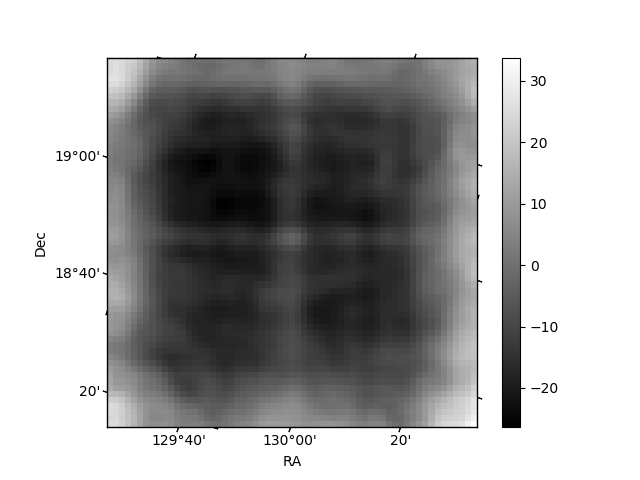
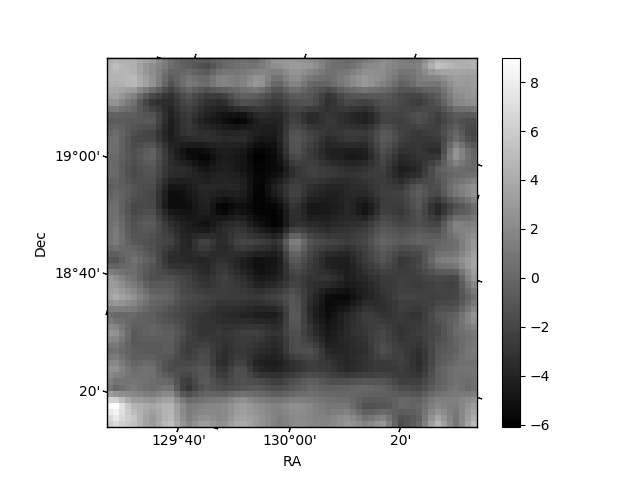
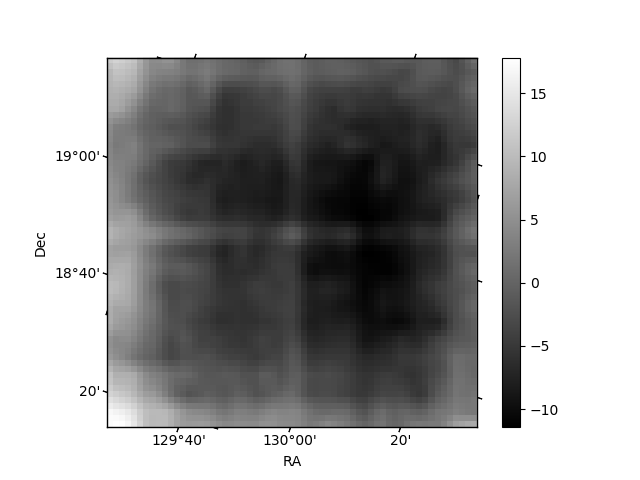
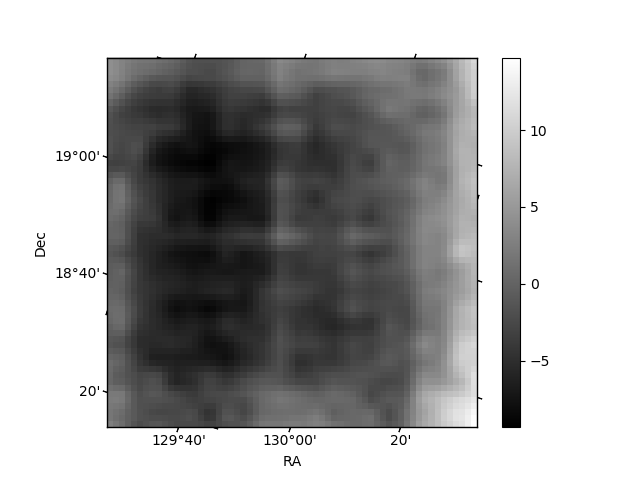
Histogram calculated using DETX and DETY for each event in the final _common_clean file
| Quadrant A | 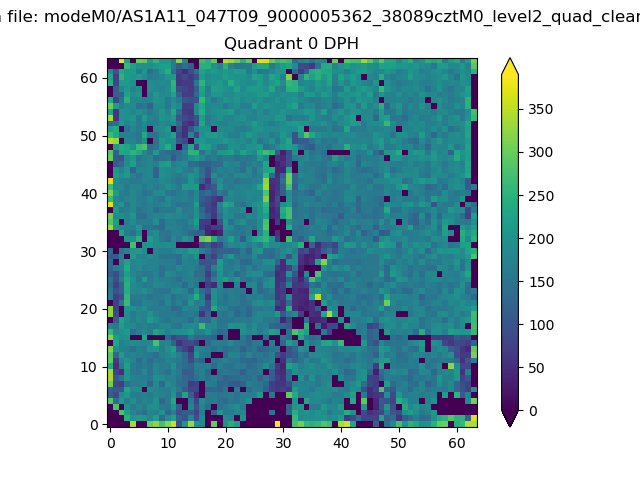 |
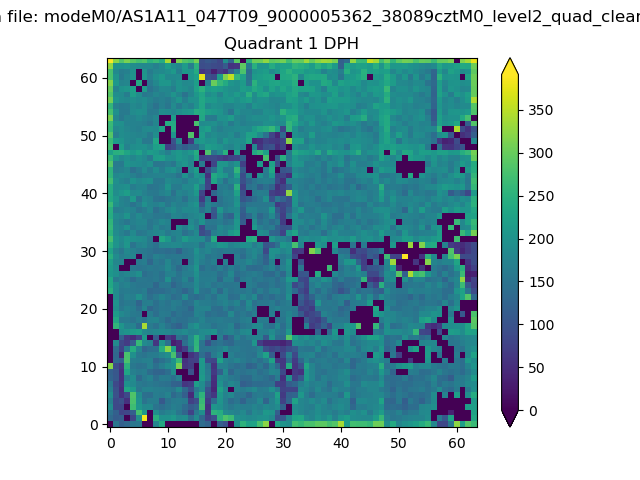 |
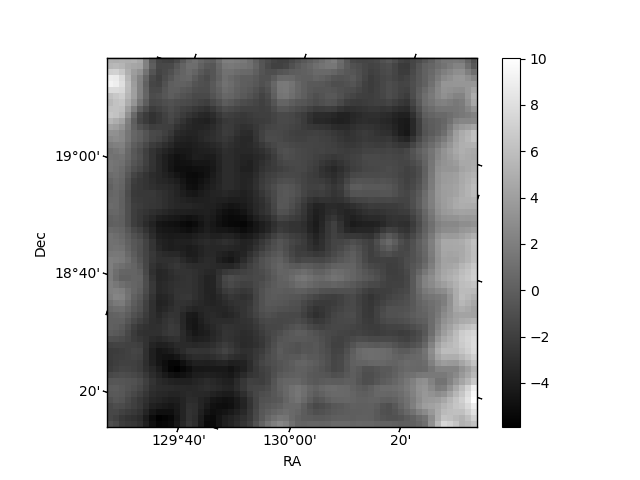
Quadrant B |
|---|---|---|---|
| Quadrant D | 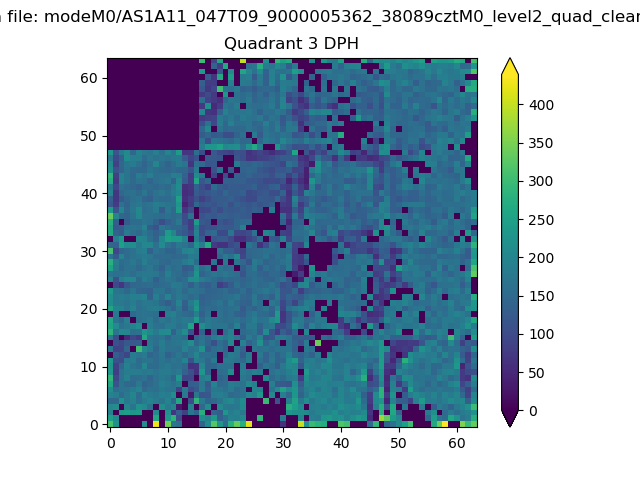 |
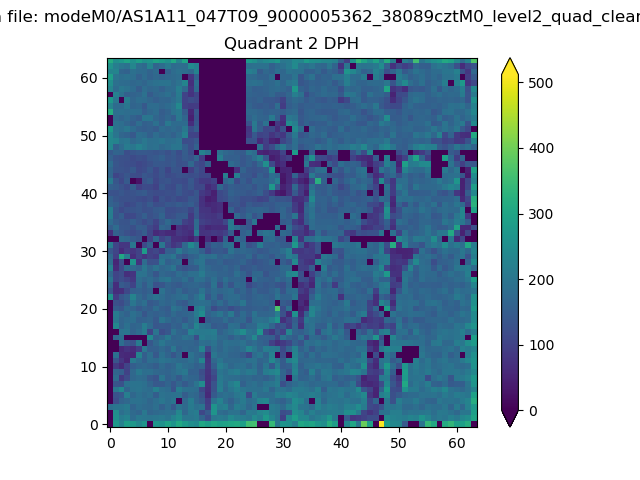 |
Quadrant C |
| Plot type | Count rate plots | Images |
|---|---|---|
| Comparison with Poisson distribution Blue bars denote a histogram of data divided into 1 sec bins. Red curve is a Poisson curve with rate = median count rate of data. |
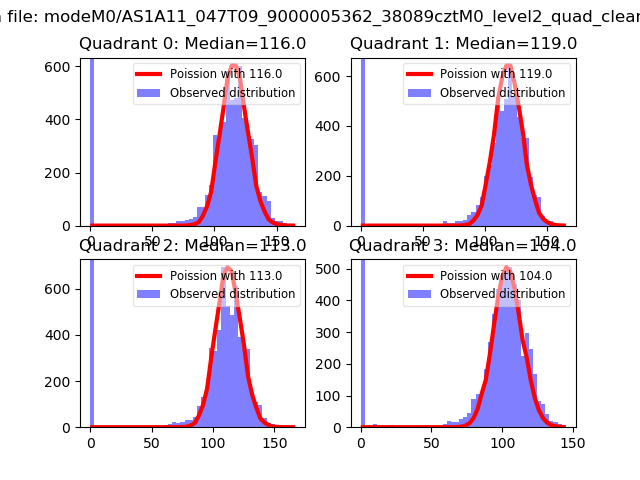 |
 |
| Quadrant-wise count rates Data is divided into 100 sec bins |
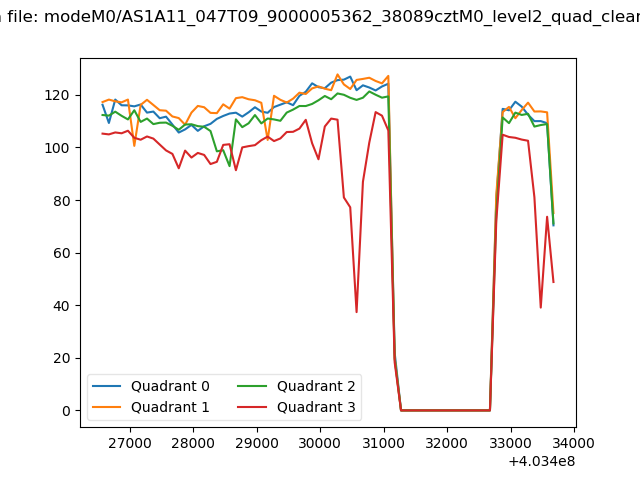 |
|
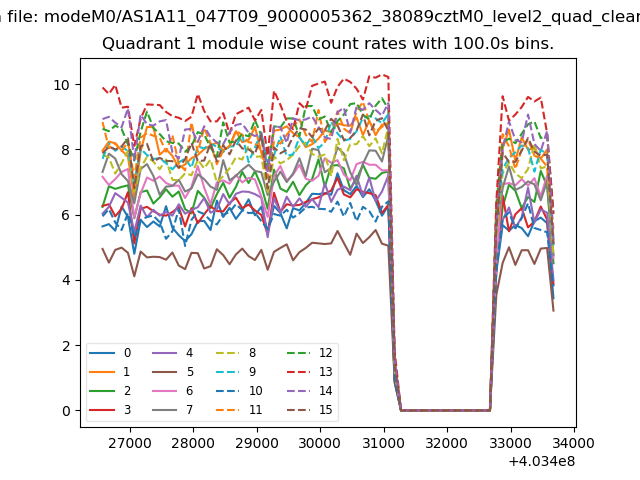
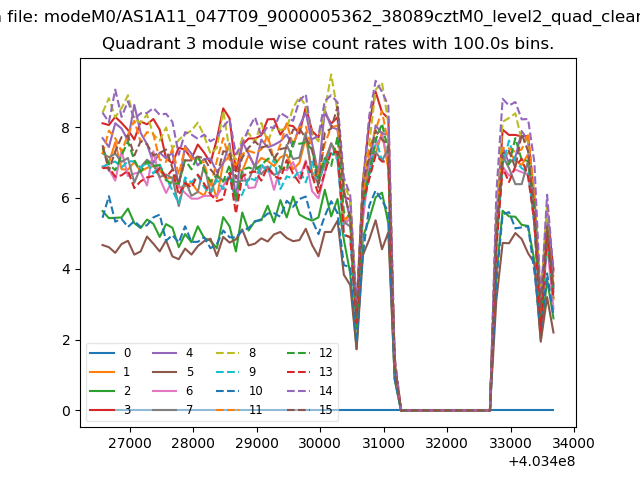
| Module-wise count rates for Quadrant A Data is divided into 100 sec bins |
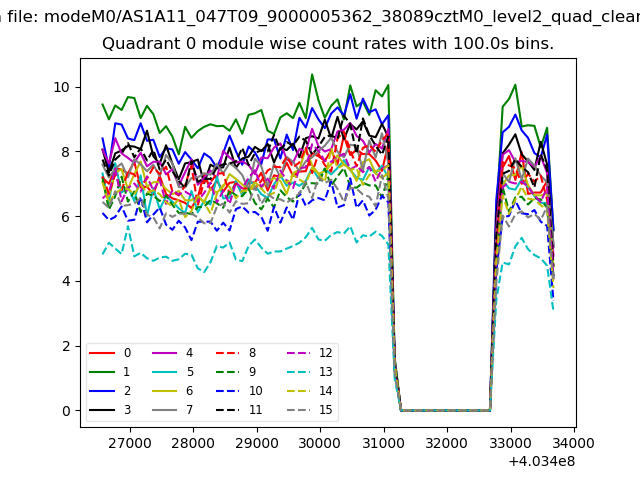 |
 |
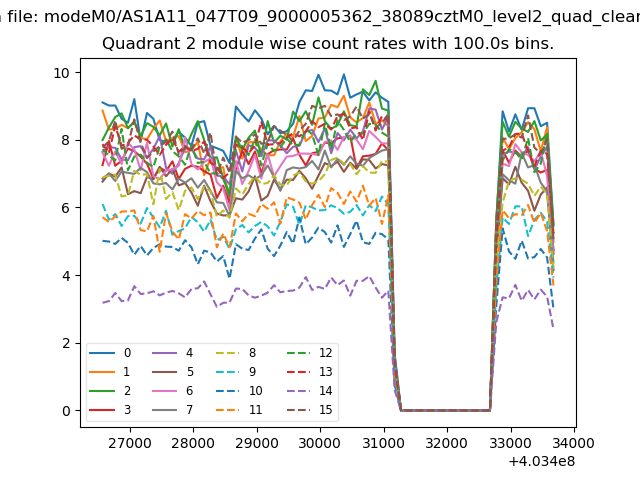
| Module-wise count rates for Quadrant B Data is divided into 100 sec bins |
 |
 |
| Module-wise count rates for Quadrant C Data is divided into 100 sec bins |
 |
 |
| Module-wise count rates for Quadrant D Data is divided into 100 sec bins |
 |
 |
| Parameter | Plot |
|---|---|
| CZT HV Monitor | 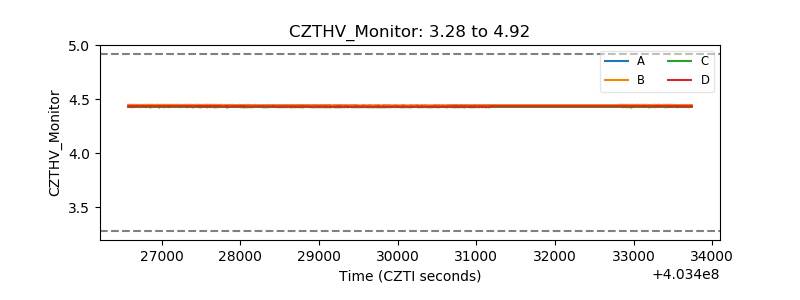 |
| D_VDD | 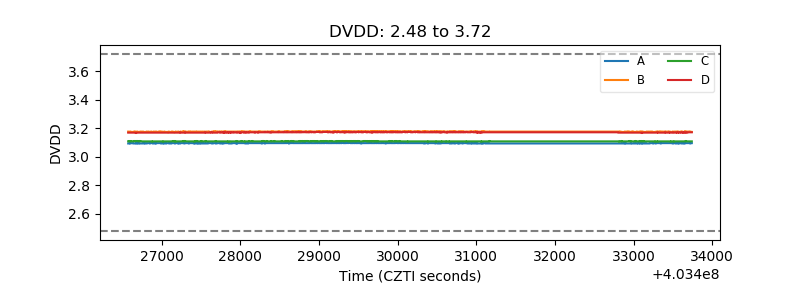 |
| Temperature 1 | 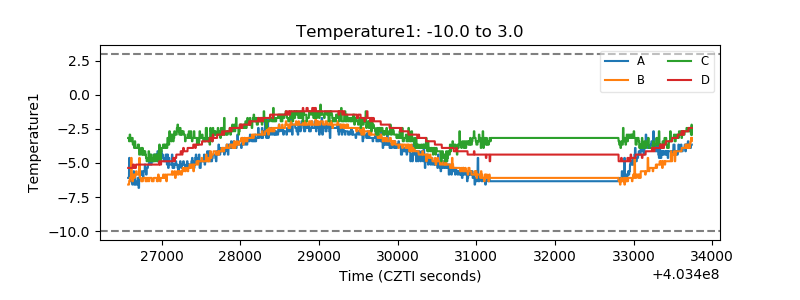 |
| Veto HV Monitor | 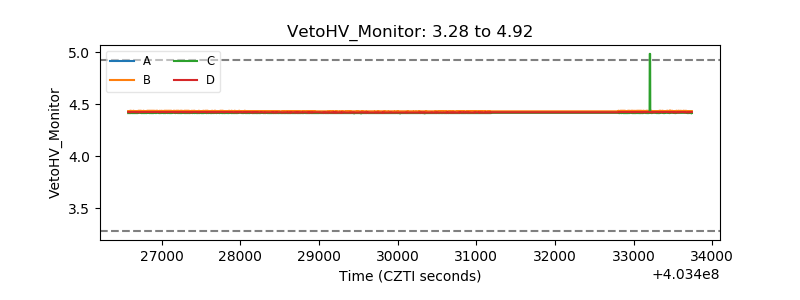 |
| Veto LLD | 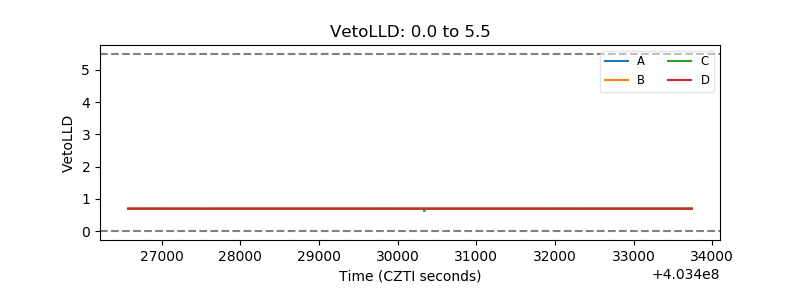 |
| Alpha Counter | 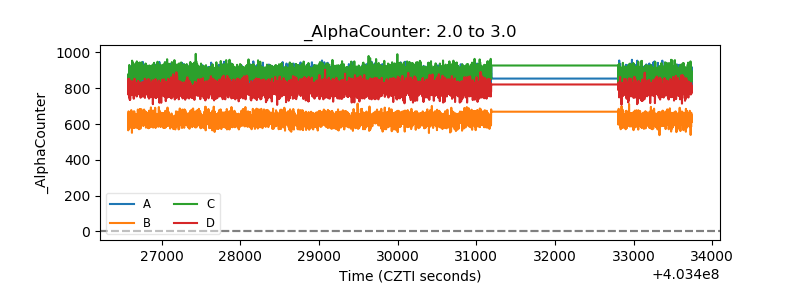 |
| _CPM_Rate | 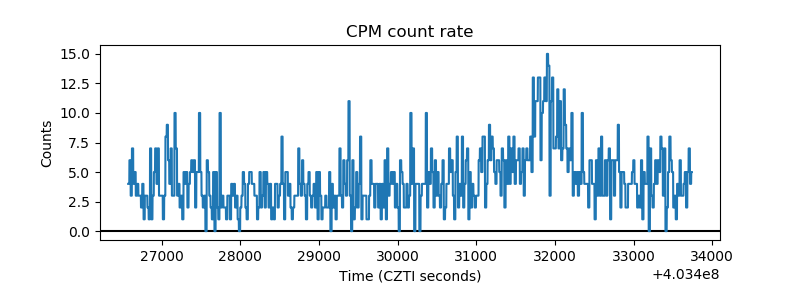 |
| CZT Counter | 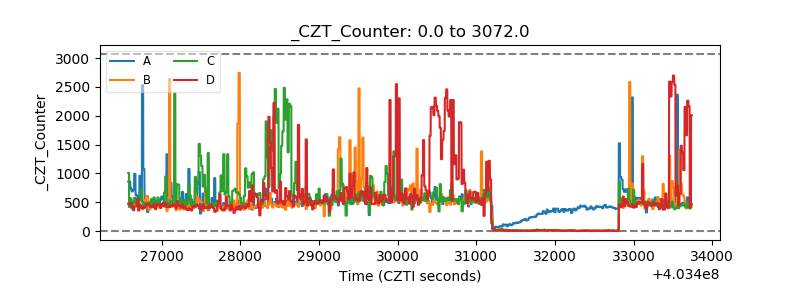 |
| +2.5 Volts monitor | 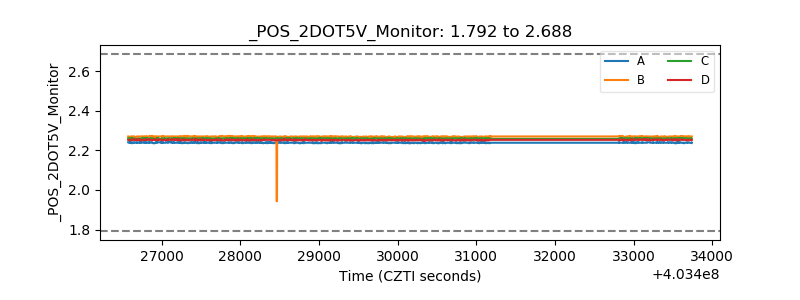 |
| +5 Volts monitor | 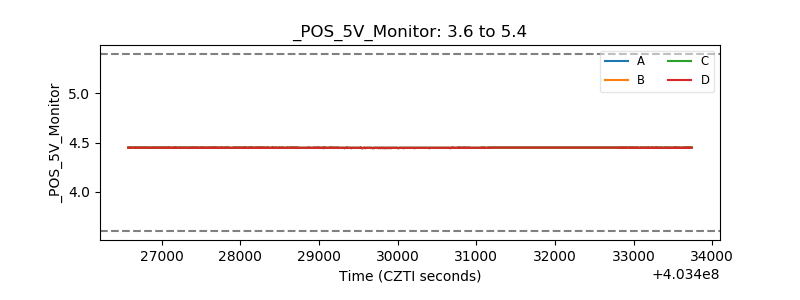 |
| _ROLL_ROT | 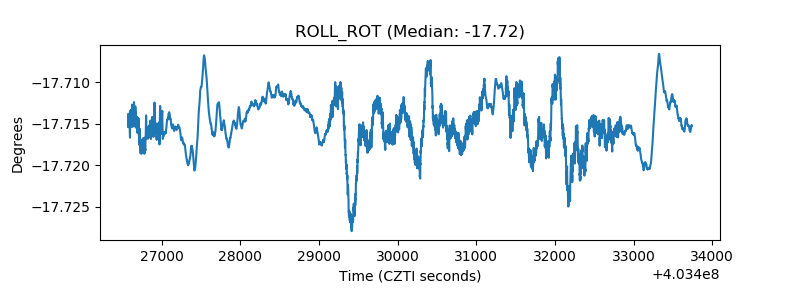 |
| _Roll_DEC | 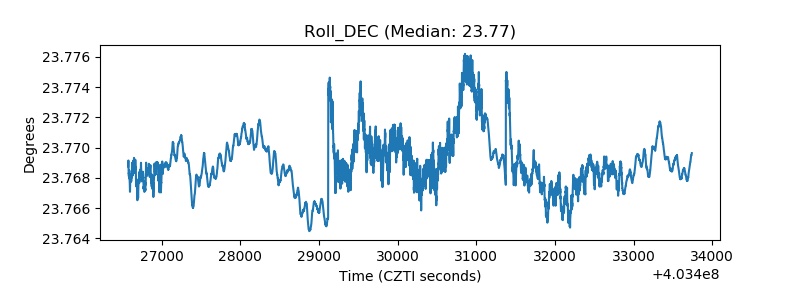 |
| _Roll_RA | 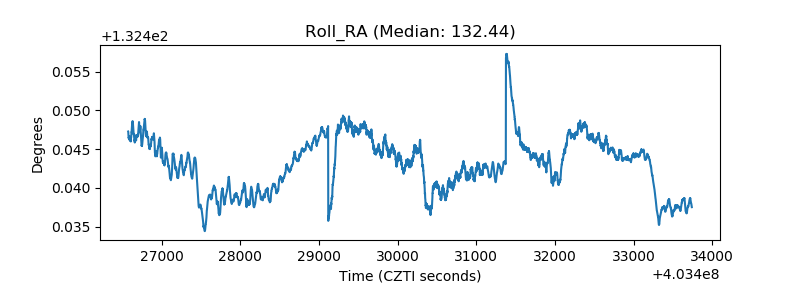 |
| Veto Counter | 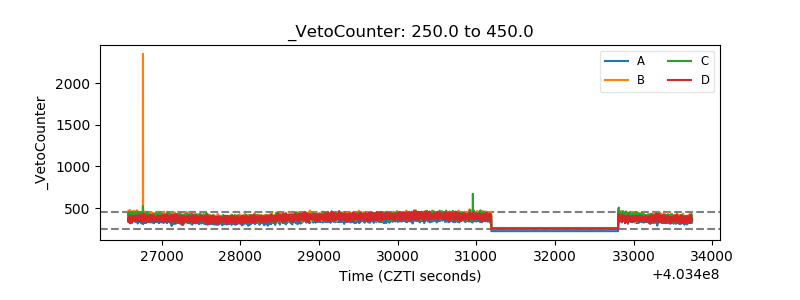 |