| Param | Original file | Final file |
|---|---|---|
| Filename | modeM0/AS1A11_047T09_9000005362_38093cztM0_level2.fits | modeM0/AS1A11_047T09_9000005362_38093cztM0_level2_quad_clean.evt |
| Size (bytes) | 319,155,840 | 72,889,920 |
| Size | 304.4 MB | 69.5 MB |
| Events in quadrant A | 2,494,578 | 502,362 |
| Events in quadrant B | 3,051,383 | 471,894 |
| Events in quadrant C | 2,711,754 | 475,473 |
| Events in quadrant D | 3,211,165 | 445,919 |
| Mode M0 | |||
|---|---|---|---|
| Quadrant | BADHDUFLAG | Total packets | Discarded packets |
| A | 0 | 9962 | 23 |
| B | 0 | 11870 | 3 |
| C | 0 | 10652 | 15 |
| D | 0 | 12459 | 42 |
| Mode SS | |||
|---|---|---|---|
| Quadrant | BADHDUFLAG | Total packets | Discarded packets |
| A | 0 | 88 | 0 |
| B | 0 | 88 | 0 |
| C | 0 | 88 | 0 |
| D | 0 | 88 | 0 |
| Mode M9 | |||
|---|---|---|---|
| Quadrant | BADHDUFLAG | Total packets | Discarded packets |
| A | 0 | 3 | 0 |
| B | 0 | 3 | 0 |
| C | 0 | 3 | 0 |
| D | 0 | 4 | 0 |
| Quadrant | Total seconds | Saturated seconds | Saturation percentage |
|---|---|---|---|
| A | 4423 | 36 | 0.813927% |
| B | 4435 | 399 | 8.996618% |
| C | 4429 | 141 | 3.183563% |
| D | 4421 | 128 | 2.895273% |
Noise dominated data is calculated using 1-second bins in cleaned event files. If a bin has >2000 counts, and if more than 50% of those come from <1% of pixels, then it is considered to be noise-dominated and hence unusable.
| Quadrant | # 1 sec bins | Bins with >0 counts | Bins with >2000 counts | High rate bins dominated by noise | Noise dominated (total time) | Noise dominated (detector-on time) | Marked lightcurve |
|---|---|---|---|---|---|---|---|
| A | 4437 | 4431 | 19 | 19 | 0.43% | 0.43% | 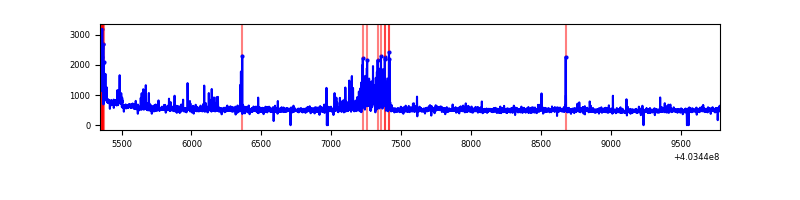 |
| B | 4437 | 4437 | 337 | 337 | 7.60% | 7.60% | 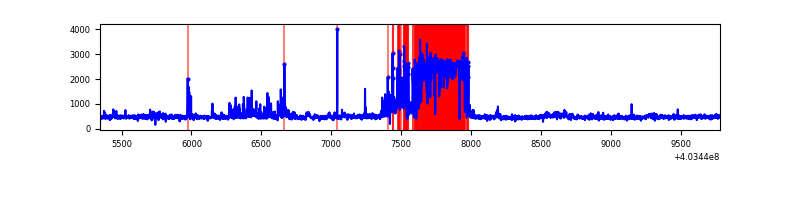 |
| C | 4437 | 4434 | 120 | 120 | 2.70% | 2.71% | 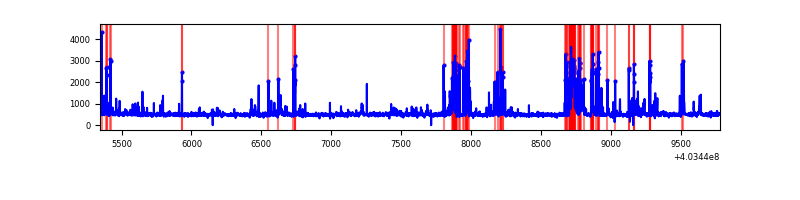 |
| D | 4437 | 4433 | 129 | 129 | 2.91% | 2.91% | 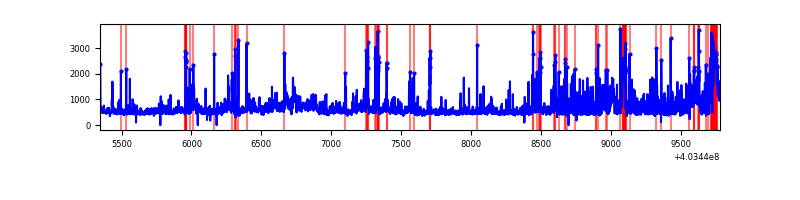 |
Top three noisy pixels from each quadrant. If the there are fewer than three noisy pixels in the level2.evt file, extra rows are filled as -1
| Pixel properties | Quadrant properties | ||||||
|---|---|---|---|---|---|---|---|
| Quadrant | DetID | PixID | Counts | Sigma | Mean | Median | Sigma |
| A | 10 | 83 | 264625 | 2509.15 | 512 | 501 | 105.3 |
| A | 12 | 16 | 145176 | 1374.4 | 512 | 501 | 105.3 |
| A | 9 | 143 | 42978 | 403.53 | 512 | 501 | 105.3 |
| B | 5 | 172 | 964937 | 10011.18 | 488 | 475 | 96.3 |
| B | 0 | 229 | 73131 | 754.17 | 488 | 475 | 96.3 |
| B | 0 | 189 | 39178 | 401.74 | 488 | 475 | 96.3 |
| C | 1 | 23 | 503837 | 4266.48 | 495 | 499 | 118.0 |
| C | 15 | 214 | 182271 | 1540.76 | 495 | 499 | 118.0 |
| C | 5 | 250 | 52563 | 441.31 | 495 | 499 | 118.0 |
| D | 1 | 52 | 529026 | 4353.5 | 494 | 480 | 121.4 |
| D | 2 | 250 | 291228 | 2394.82 | 494 | 480 | 121.4 |
| D | 12 | 227 | 96257 | 788.89 | 494 | 480 | 121.4 |
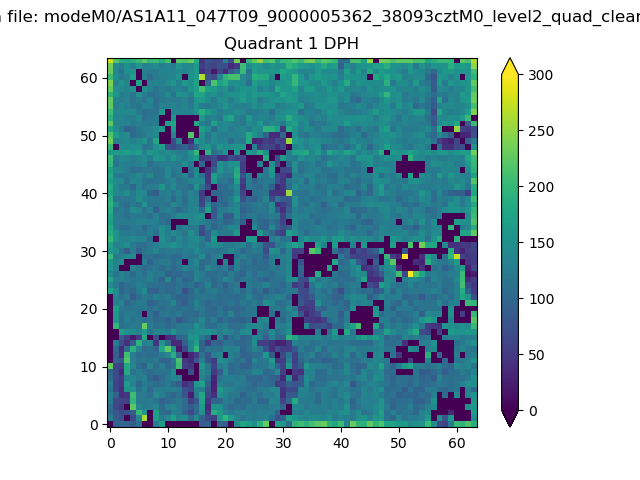
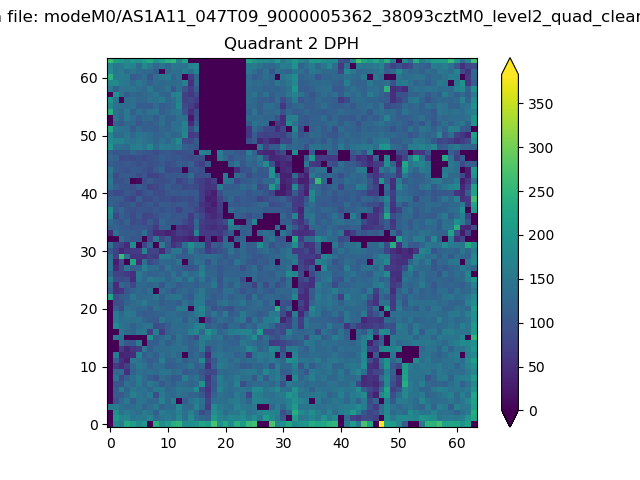
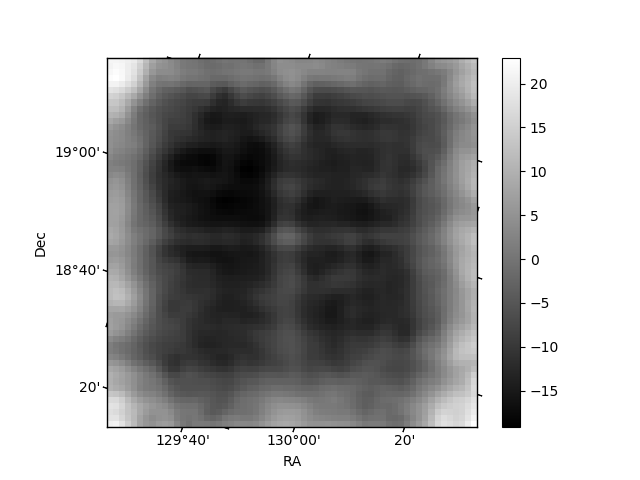
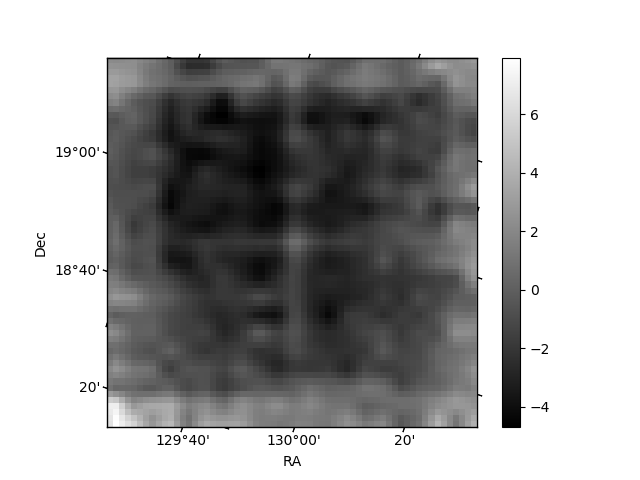
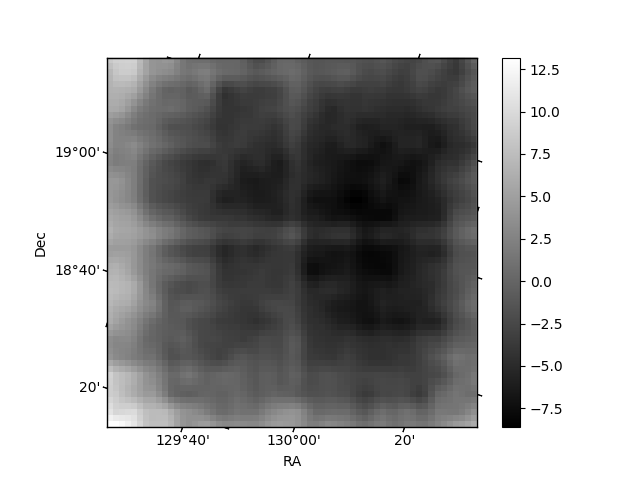
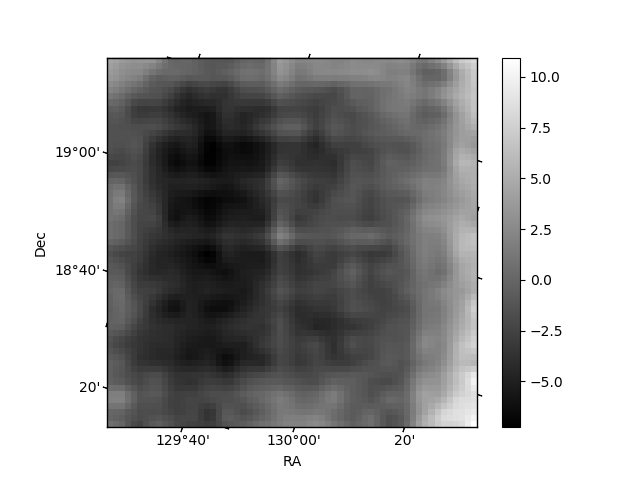
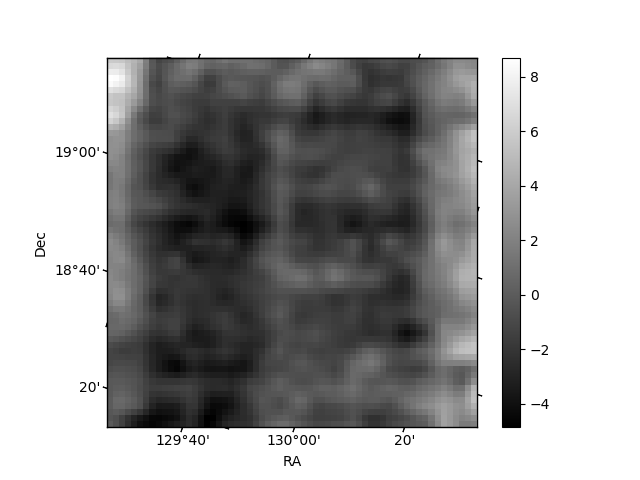
Histogram calculated using DETX and DETY for each event in the final _common_clean file
| Quadrant A |  |
 |
Quadrant B |
|---|---|---|---|
| Quadrant D | 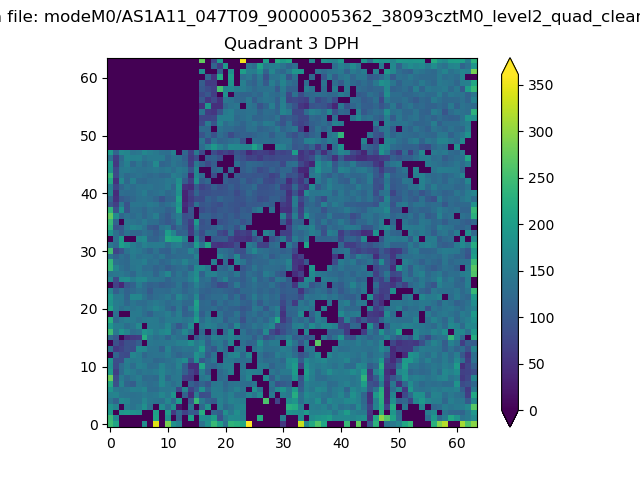 |
 |
Quadrant C |
| Plot type | Count rate plots | Images |
|---|---|---|
| Comparison with Poisson distribution Blue bars denote a histogram of data divided into 1 sec bins. Red curve is a Poisson curve with rate = median count rate of data. |
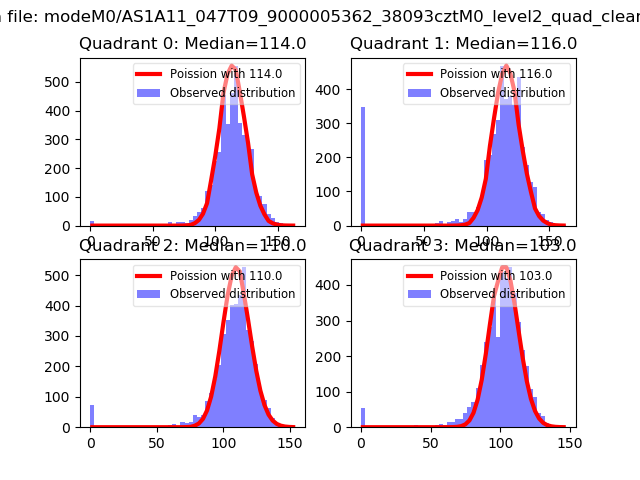 |
 |
| Quadrant-wise count rates Data is divided into 100 sec bins |
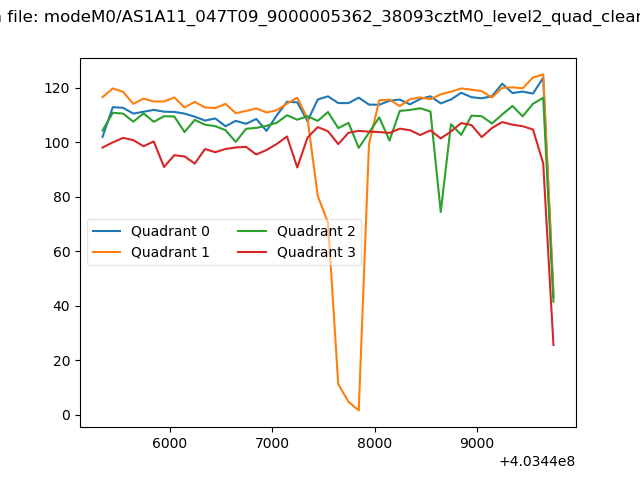 |
|
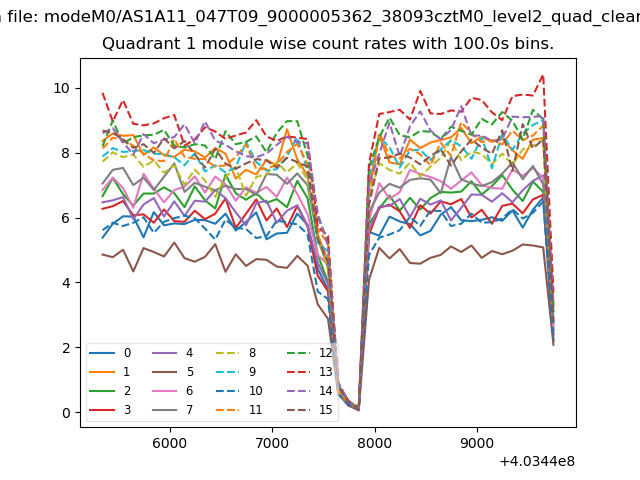
| Module-wise count rates for Quadrant A Data is divided into 100 sec bins |
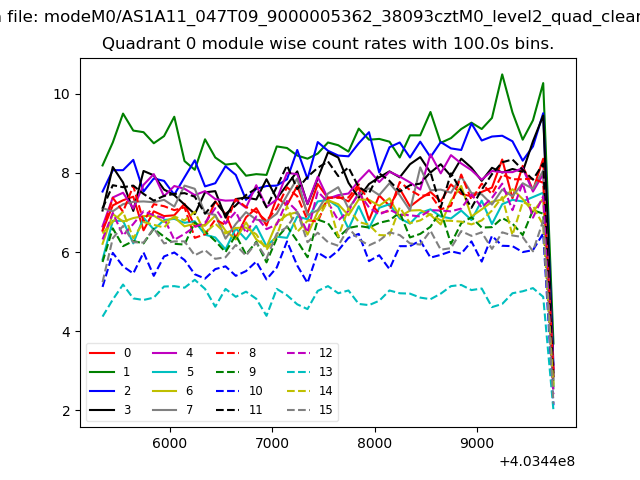 |
 |
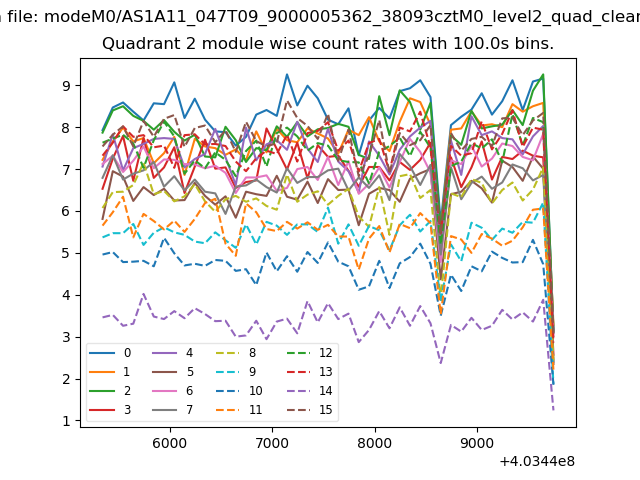
| Module-wise count rates for Quadrant B Data is divided into 100 sec bins |
 |
 |
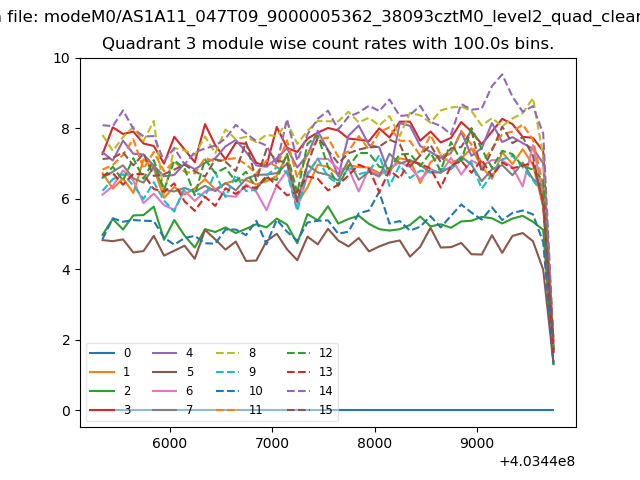
| Module-wise count rates for Quadrant C Data is divided into 100 sec bins |
 |
 |
| Module-wise count rates for Quadrant D Data is divided into 100 sec bins |
 |
 |
| Parameter | Plot |
|---|---|
| CZT HV Monitor | 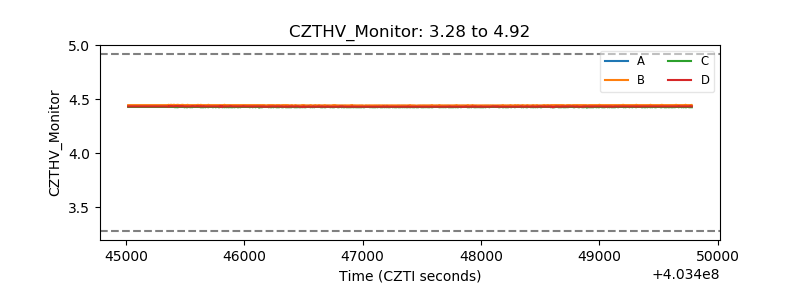 |
| D_VDD | 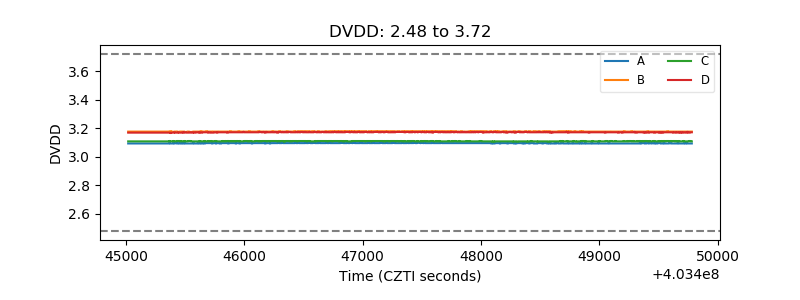 |
| Temperature 1 | 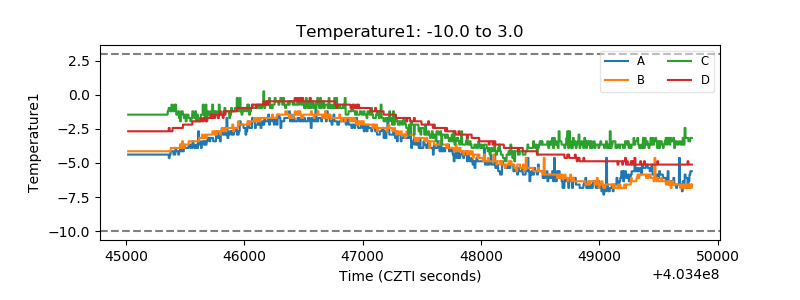 |
| Veto HV Monitor | 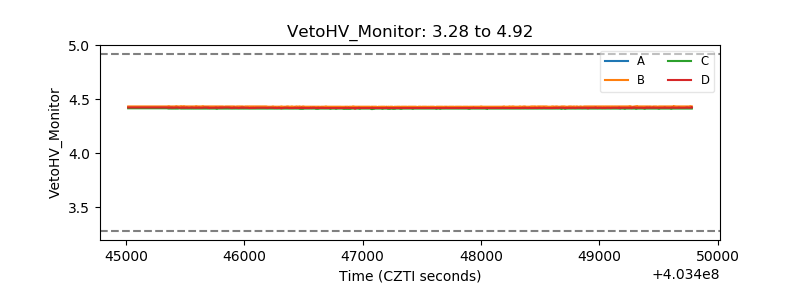 |
| Veto LLD | 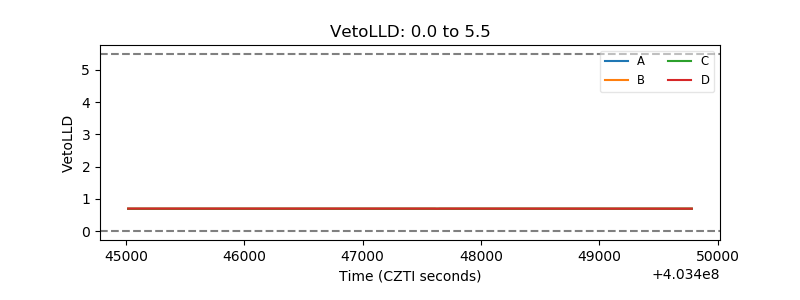 |
| Alpha Counter | 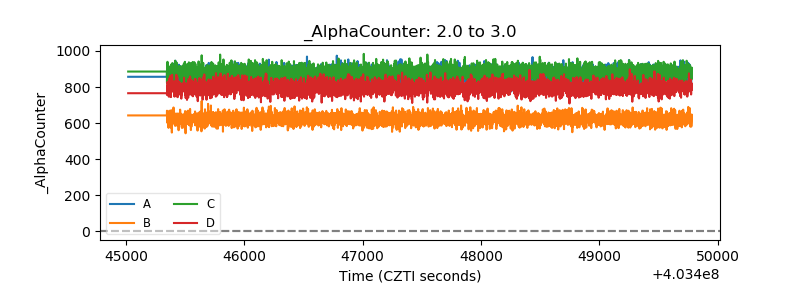 |
| _CPM_Rate | 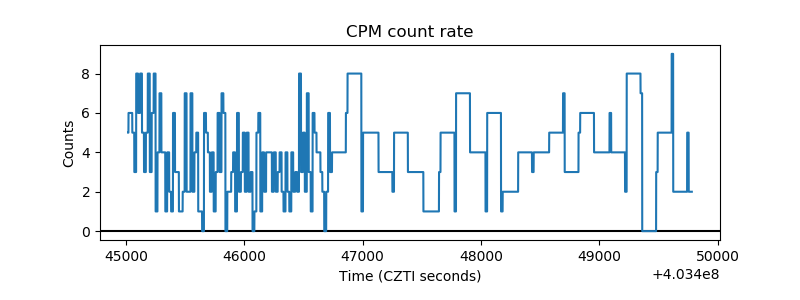 |
| CZT Counter | 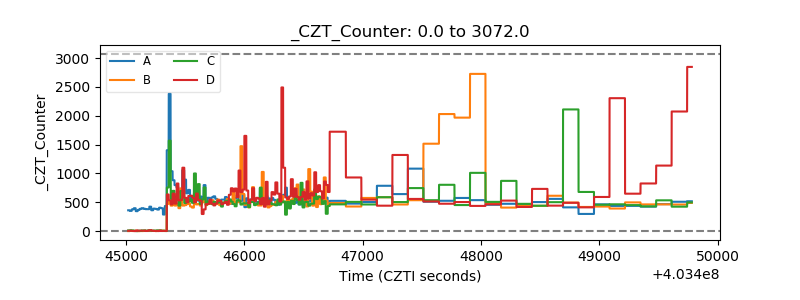 |
| +2.5 Volts monitor | 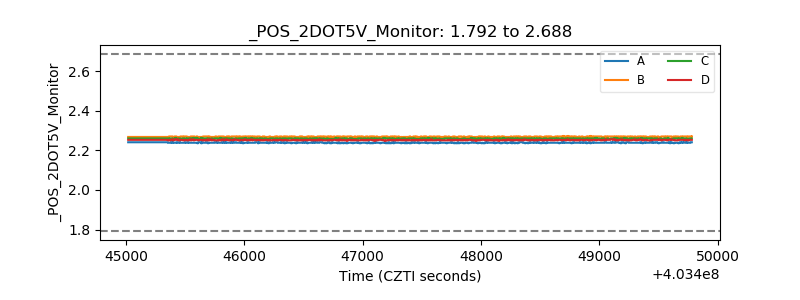 |
| +5 Volts monitor | 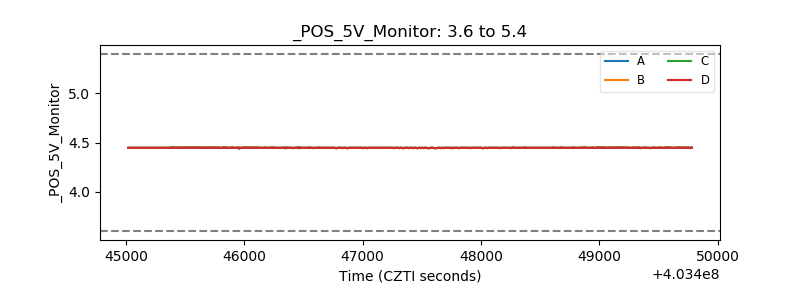 |
| _ROLL_ROT | 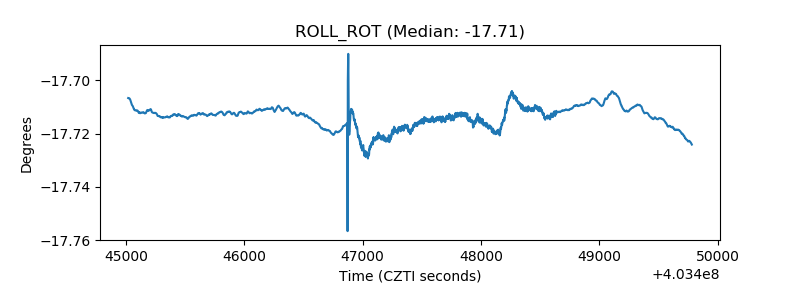 |
| _Roll_DEC | 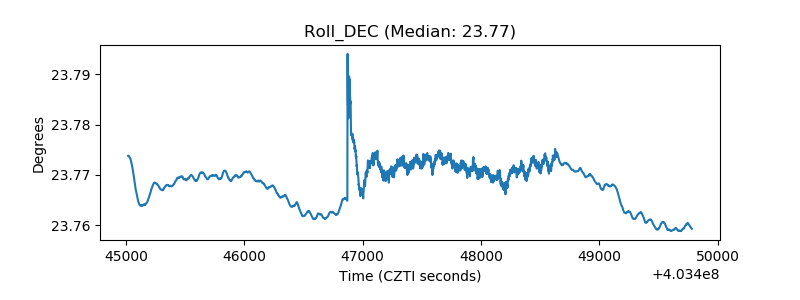 |
| _Roll_RA | 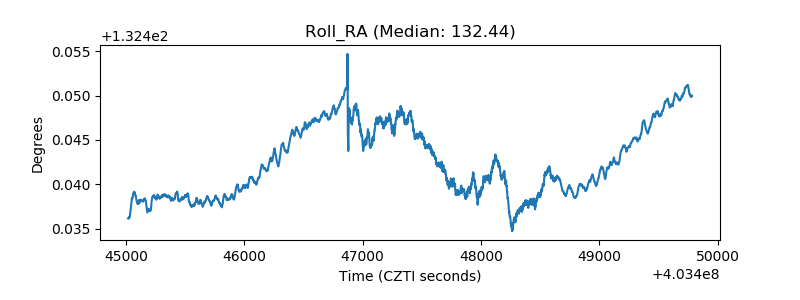 |
| Veto Counter | 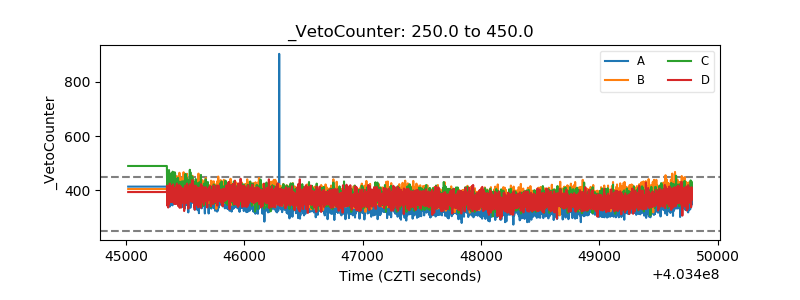 |