| Param | Original file | Final file |
|---|---|---|
| Filename | modeM0/AS1A11_047T09_9000005362_38094cztM0_level2.fits | modeM0/AS1A11_047T09_9000005362_38094cztM0_level2_quad_clean.evt |
| Size (bytes) | 818,164,800 | 193,832,640 |
| Size | 780.3 MB | 184.9 MB |
| Events in quadrant A | 6,255,876 | 1,348,000 |
| Events in quadrant B | 7,499,268 | 1,281,894 |
| Events in quadrant C | 7,590,167 | 1,247,981 |
| Events in quadrant D | 8,038,376 | 1,184,485 |
| Mode M0 | |||
|---|---|---|---|
| Quadrant | BADHDUFLAG | Total packets | Discarded packets |
| A | 0 | 25474 | 7 |
| B | 0 | 29797 | 3 |
| C | 0 | 29535 | 3 |
| D | 0 | 31677 | 11 |
| Mode SS | |||
|---|---|---|---|
| Quadrant | BADHDUFLAG | Total packets | Discarded packets |
| A | 0 | 240 | 0 |
| B | 0 | 240 | 0 |
| C | 0 | 240 | 0 |
| D | 0 | 240 | 0 |
| Mode M9 | |||
|---|---|---|---|
| Quadrant | BADHDUFLAG | Total packets | Discarded packets |
| A | 0 | 43 | 0 |
| B | 0 | 43 | 0 |
| C | 0 | 43 | 0 |
| D | 0 | 43 | 0 |
| Quadrant | Total seconds | Saturated seconds | Saturation percentage |
|---|---|---|---|
| A | 11650 | 35 | 0.300429% |
| B | 11652 | 694 | 5.956059% |
| C | 11652 | 487 | 4.179540% |
| D | 11648 | 358 | 3.073489% |
Noise dominated data is calculated using 1-second bins in cleaned event files. If a bin has >2000 counts, and if more than 50% of those come from <1% of pixels, then it is considered to be noise-dominated and hence unusable.
| Quadrant | # 1 sec bins | Bins with >0 counts | Bins with >2000 counts | High rate bins dominated by noise | Noise dominated (total time) | Noise dominated (detector-on time) | Marked lightcurve |
|---|---|---|---|---|---|---|---|
| A | 15982 | 11654 | 11 | 11 | 0.07% | 0.09% | 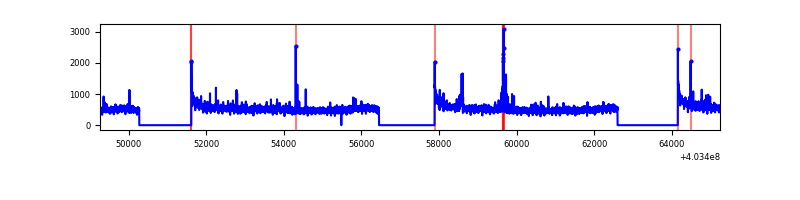 |
| B | 15982 | 11655 | 550 | 550 | 3.44% | 4.72% | 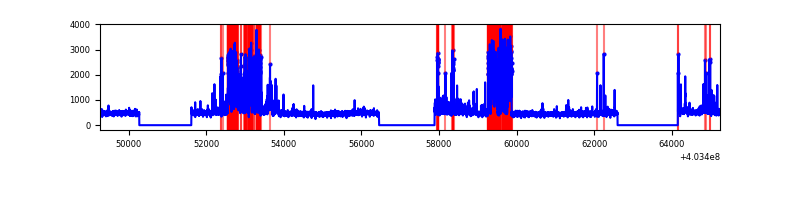 |
| C | 15982 | 11655 | 419 | 419 | 2.62% | 3.60% | 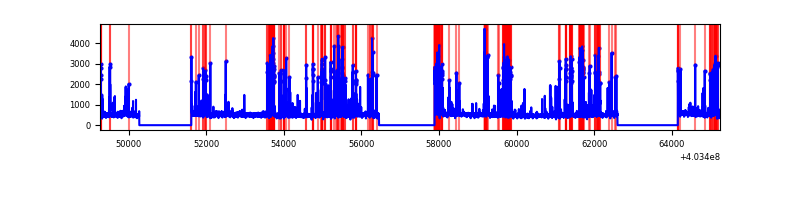 |
| D | 15982 | 11654 | 325 | 325 | 2.03% | 2.79% | 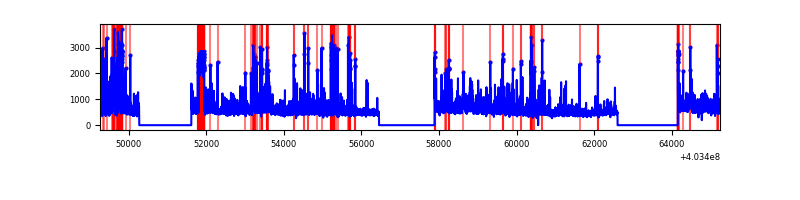 |
Top three noisy pixels from each quadrant. If the there are fewer than three noisy pixels in the level2.evt file, extra rows are filled as -1
| Pixel properties | Quadrant properties | ||||||
|---|---|---|---|---|---|---|---|
| Quadrant | DetID | PixID | Counts | Sigma | Mean | Median | Sigma |
| A | 10 | 83 | 739367 | 2675.83 | 1365 | 1337 | 275.8 |
| A | 9 | 254 | 59532 | 210.99 | 1365 | 1337 | 275.8 |
| A | 15 | 223 | 47815 | 168.51 | 1365 | 1337 | 275.8 |
| B | 5 | 172 | 1899327 | 7458.5 | 1323 | 1285 | 254.5 |
| B | 0 | 229 | 242290 | 947.05 | 1323 | 1285 | 254.5 |
| B | 0 | 189 | 87229 | 337.72 | 1323 | 1285 | 254.5 |
| C | 1 | 23 | 1733982 | 5711.97 | 1301 | 1309 | 303.3 |
| C | 15 | 214 | 474934 | 1561.36 | 1301 | 1309 | 303.3 |
| C | 10 | 22 | 71477 | 231.32 | 1301 | 1309 | 303.3 |
| D | 1 | 52 | 929734 | 2905.94 | 1309 | 1274 | 319.5 |
| D | 12 | 233 | 548571 | 1712.96 | 1309 | 1274 | 319.5 |
| D | 2 | 250 | 378646 | 1181.12 | 1309 | 1274 | 319.5 |
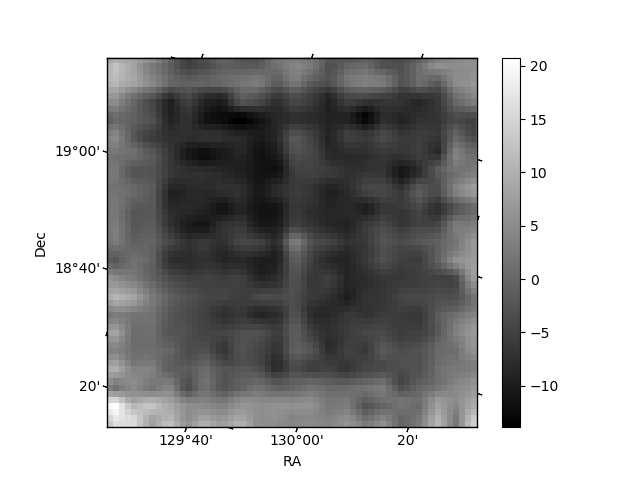
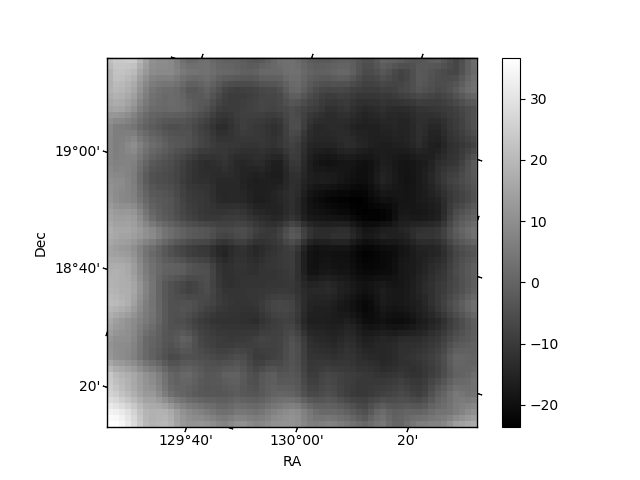
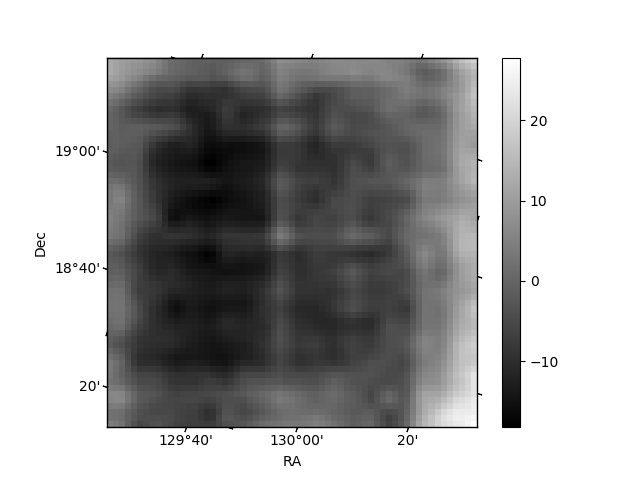
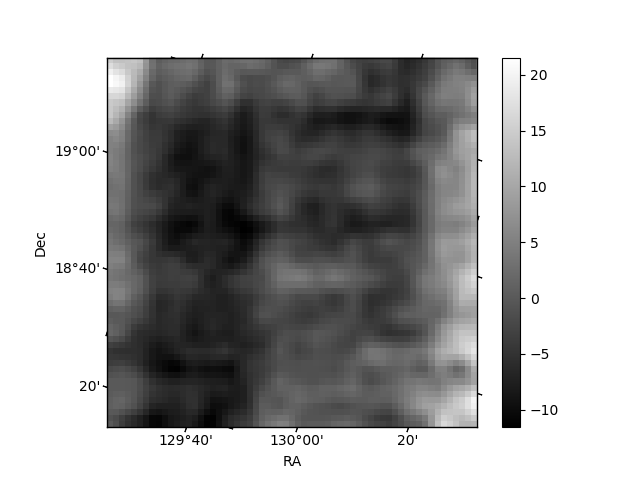
Histogram calculated using DETX and DETY for each event in the final _common_clean file
| Quadrant A | 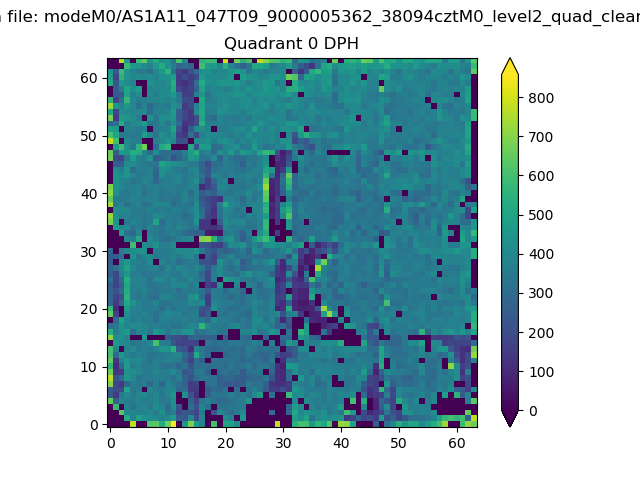 |
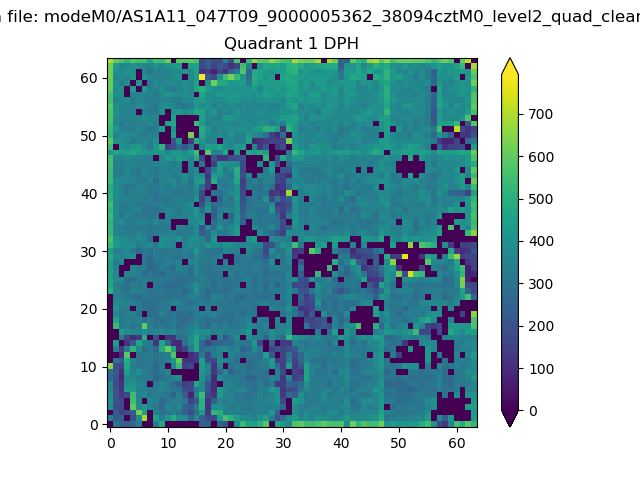 |
Quadrant B |
|---|---|---|---|
| Quadrant D | 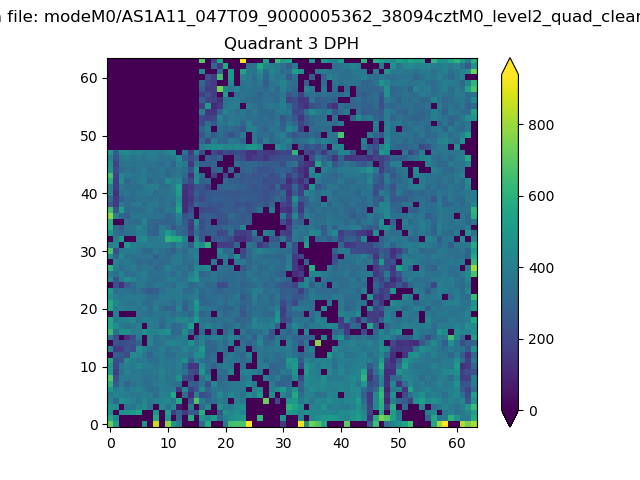 |
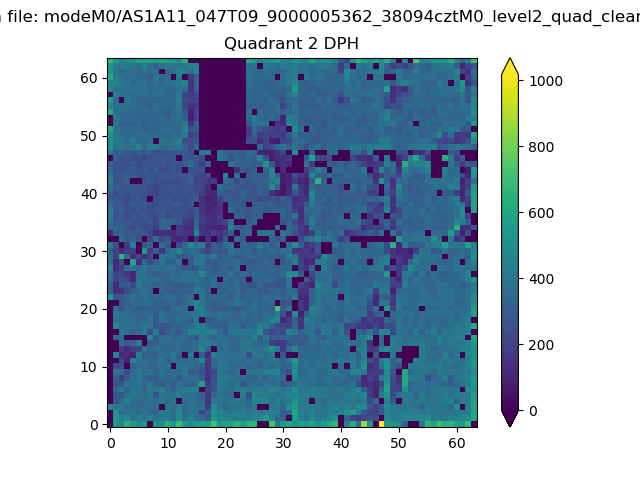 |
Quadrant C |
| Plot type | Count rate plots | Images |
|---|---|---|
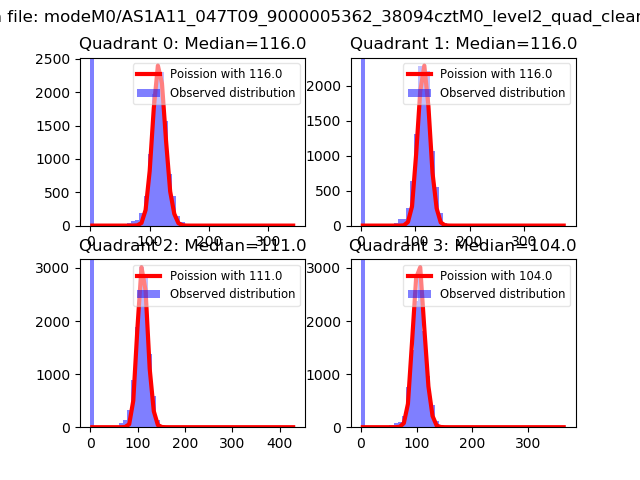
| Comparison with Poisson distribution Blue bars denote a histogram of data divided into 1 sec bins. Red curve is a Poisson curve with rate = median count rate of data. |
 |
 |
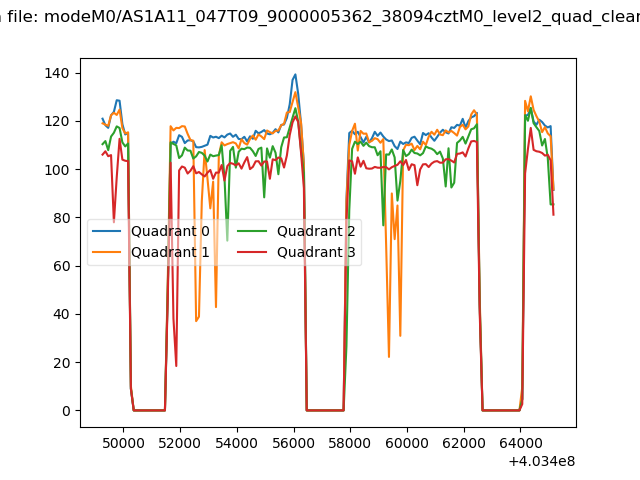
| Quadrant-wise count rates Data is divided into 100 sec bins |
 |
|
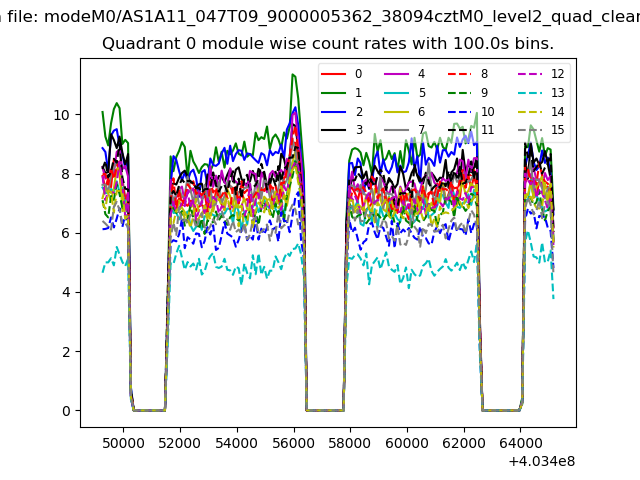
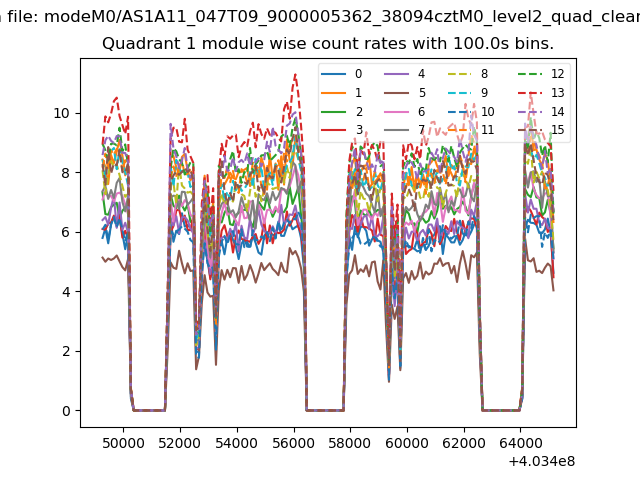
| Module-wise count rates for Quadrant A Data is divided into 100 sec bins |
 |
 |
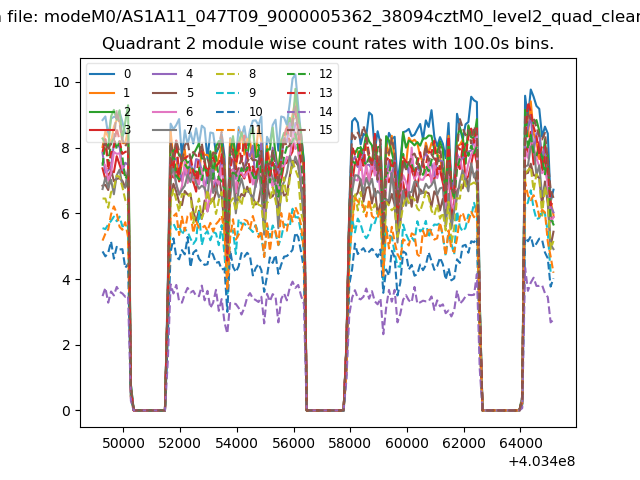
| Module-wise count rates for Quadrant B Data is divided into 100 sec bins |
 |
 |
| Module-wise count rates for Quadrant C Data is divided into 100 sec bins |
 |
 |
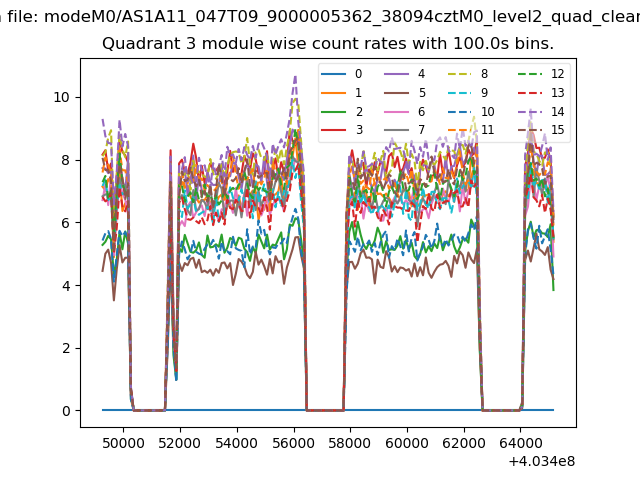
| Module-wise count rates for Quadrant D Data is divided into 100 sec bins |
 |
 |
| Parameter | Plot |
|---|---|
| CZT HV Monitor | 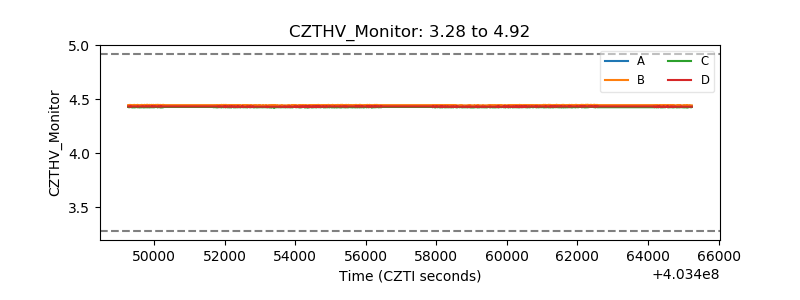 |
| D_VDD | 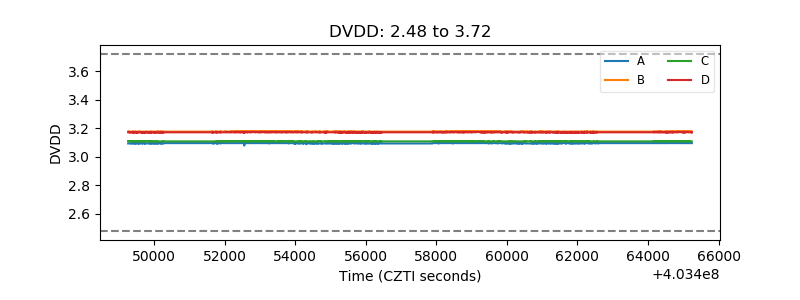 |
| Temperature 1 | 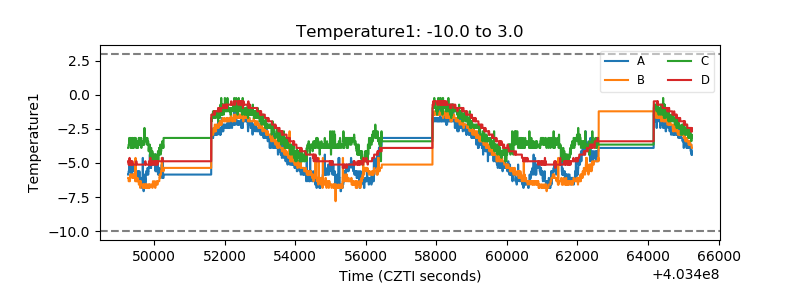 |
| Veto HV Monitor | 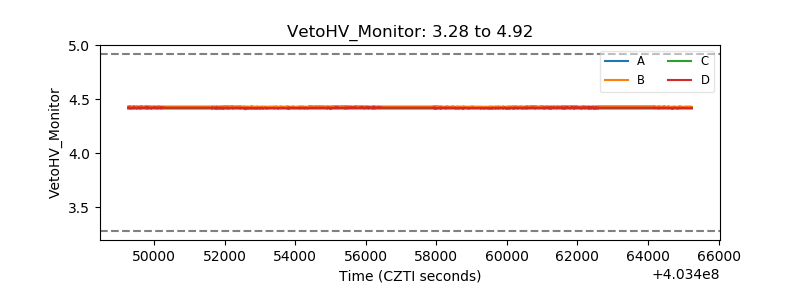 |
| Veto LLD | 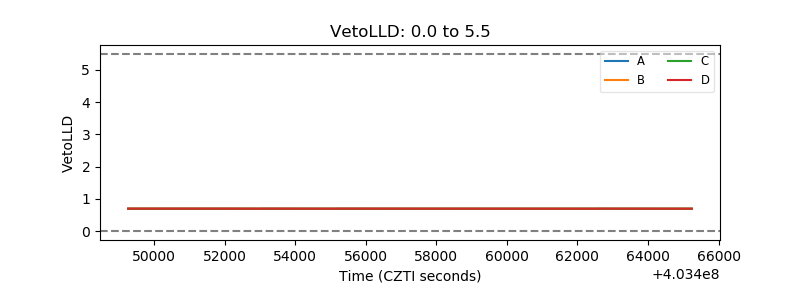 |
| Alpha Counter | 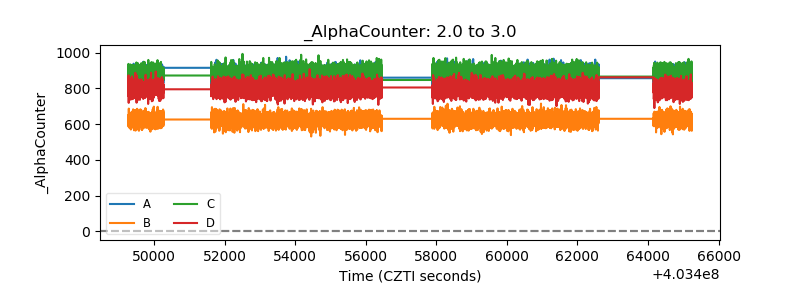 |
| _CPM_Rate | 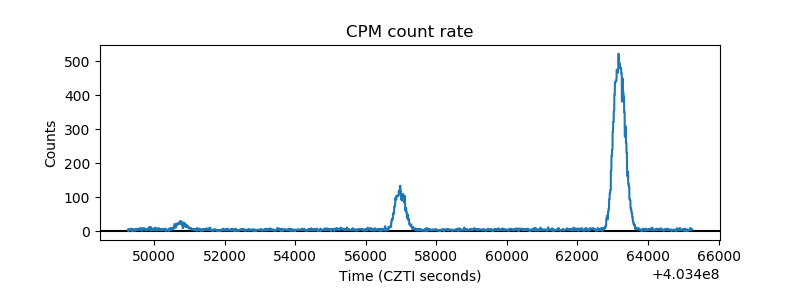 |
| CZT Counter | 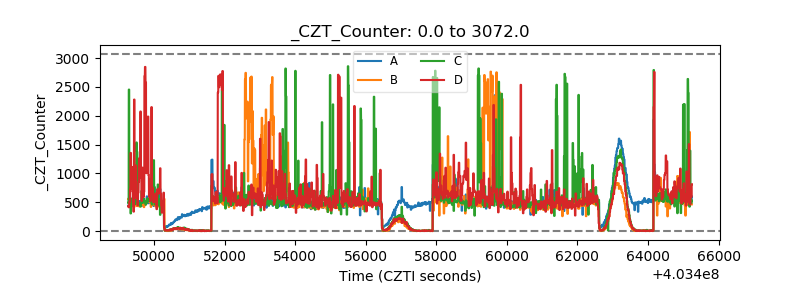 |
| +2.5 Volts monitor | 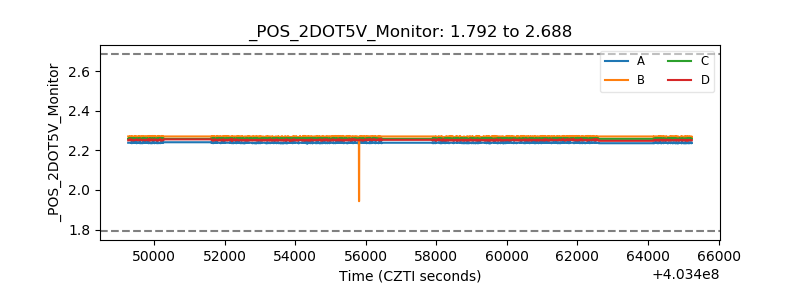 |
| +5 Volts monitor | 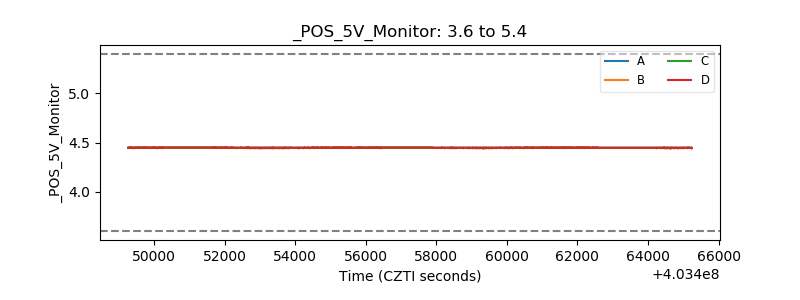 |
| _ROLL_ROT | 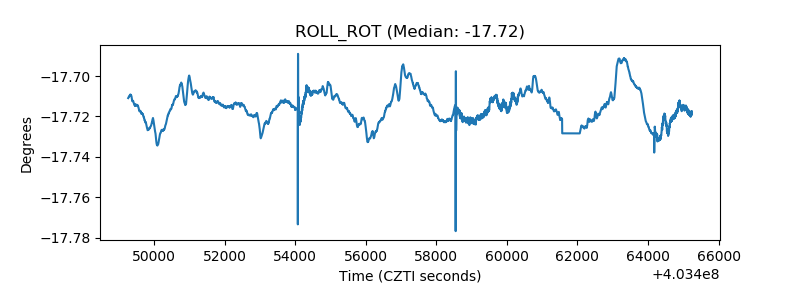 |
| _Roll_DEC | 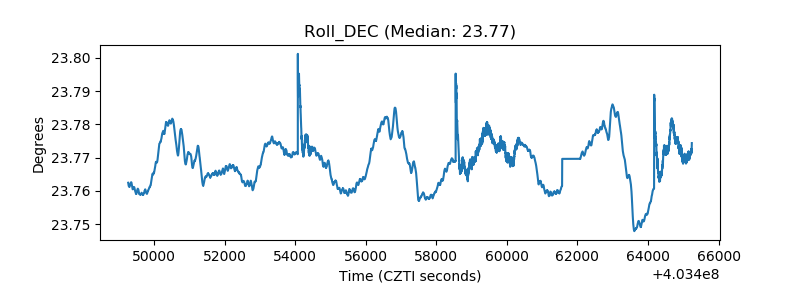 |
| _Roll_RA | 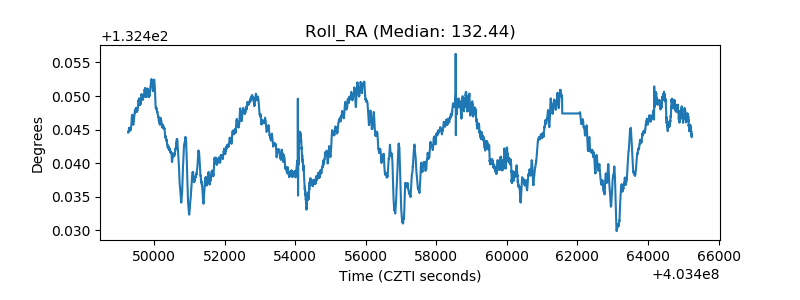 |
| Veto Counter | 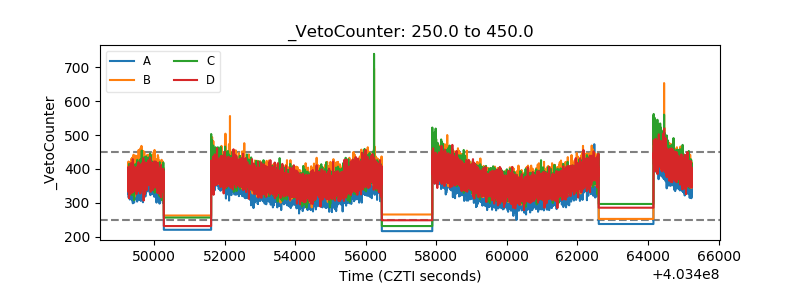 |