| Param | Original file | Final file |
|---|---|---|
| Filename | modeM0/AS1A11_047T09_9000005362_38095cztM0_level2.fits | modeM0/AS1A11_047T09_9000005362_38095cztM0_level2_quad_clean.evt |
| Size (bytes) | 382,492,800 | 95,906,880 |
| Size | 364.8 MB | 91.5 MB |
| Events in quadrant A | 3,108,673 | 658,020 |
| Events in quadrant B | 2,895,747 | 659,682 |
| Events in quadrant C | 3,878,658 | 610,388 |
| Events in quadrant D | 3,846,250 | 589,130 |
| Mode M0 | |||
|---|---|---|---|
| Quadrant | BADHDUFLAG | Total packets | Discarded packets |
| A | 0 | 12690 | 3 |
| B | 0 | 12184 | 2 |
| C | 0 | 15018 | 2 |
| D | 0 | 15264 | 2 |
| Mode SS | |||
|---|---|---|---|
| Quadrant | BADHDUFLAG | Total packets | Discarded packets |
| A | 0 | 114 | 0 |
| B | 0 | 114 | 0 |
| C | 0 | 114 | 0 |
| D | 0 | 114 | 0 |
| Mode M9 | |||
|---|---|---|---|
| Quadrant | BADHDUFLAG | Total packets | Discarded packets |
| A | 0 | 26 | 0 |
| B | 0 | 26 | 0 |
| C | 0 | 26 | 0 |
| D | 0 | 27 | 0 |
| Quadrant | Total seconds | Saturated seconds | Saturation percentage |
|---|---|---|---|
| A | 5522 | 25 | 0.452735% |
| B | 5522 | 50 | 0.905469% |
| C | 5522 | 285 | 5.161173% |
| D | 5522 | 76 | 1.376313% |
Noise dominated data is calculated using 1-second bins in cleaned event files. If a bin has >2000 counts, and if more than 50% of those come from <1% of pixels, then it is considered to be noise-dominated and hence unusable.
| Quadrant | # 1 sec bins | Bins with >0 counts | Bins with >2000 counts | High rate bins dominated by noise | Noise dominated (total time) | Noise dominated (detector-on time) | Marked lightcurve |
|---|---|---|---|---|---|---|---|
| A | 7166 | 5523 | 5 | 5 | 0.07% | 0.09% | 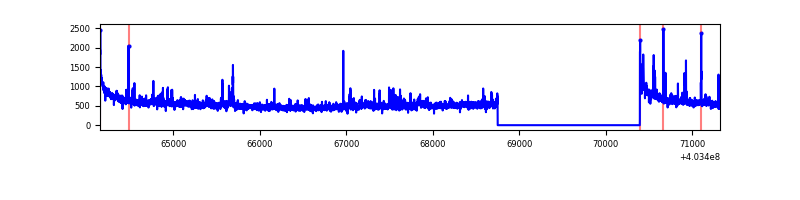 |
| B | 7166 | 5523 | 20 | 20 | 0.28% | 0.36% | 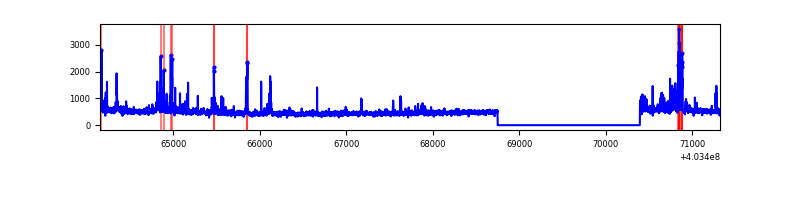 |
| C | 7166 | 5523 | 261 | 261 | 3.64% | 4.73% | 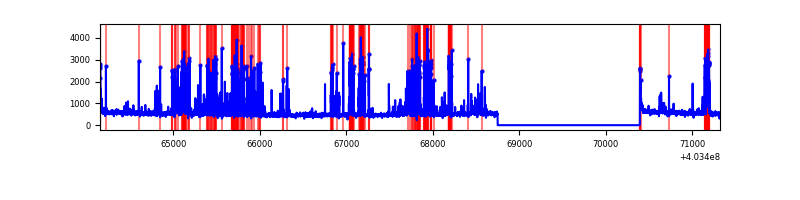 |
| D | 7166 | 5523 | 68 | 68 | 0.95% | 1.23% | 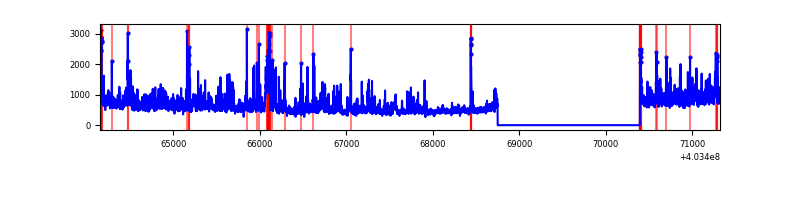 |
Top three noisy pixels from each quadrant. If the there are fewer than three noisy pixels in the level2.evt file, extra rows are filled as -1
| Pixel properties | Quadrant properties | ||||||
|---|---|---|---|---|---|---|---|
| Quadrant | DetID | PixID | Counts | Sigma | Mean | Median | Sigma |
| A | 10 | 83 | 394490 | 2959.1 | 653 | 639 | 133.1 |
| A | 12 | 16 | 60870 | 452.53 | 653 | 639 | 133.1 |
| A | 0 | 247 | 42954 | 317.92 | 653 | 639 | 133.1 |
| B | 0 | 229 | 114834 | 910.51 | 648 | 631 | 125.4 |
| B | 5 | 172 | 88275 | 698.76 | 648 | 631 | 125.4 |
| B | 4 | 81 | 68454 | 540.73 | 648 | 631 | 125.4 |
| C | 1 | 23 | 1060802 | 7296.39 | 622 | 628 | 145.3 |
| C | 15 | 214 | 226594 | 1555.16 | 622 | 628 | 145.3 |
| C | 14 | 254 | 69519 | 474.13 | 622 | 628 | 145.3 |
| D | 12 | 235 | 395624 | 2554.31 | 633 | 616 | 154.6 |
| D | 10 | 40 | 272802 | 1760.08 | 633 | 616 | 154.6 |
| D | 1 | 52 | 222083 | 1432.11 | 633 | 616 | 154.6 |
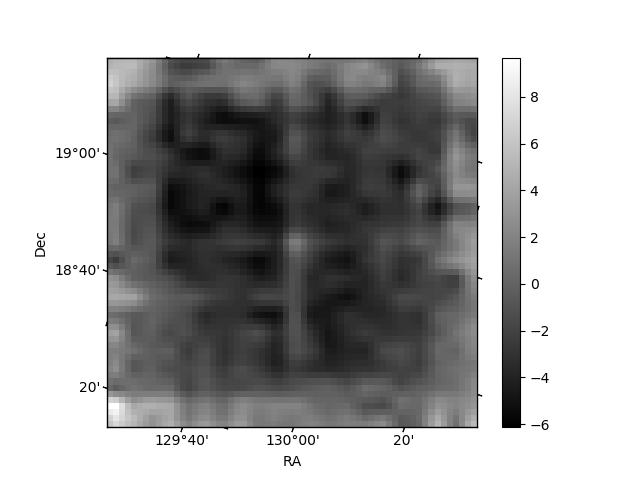
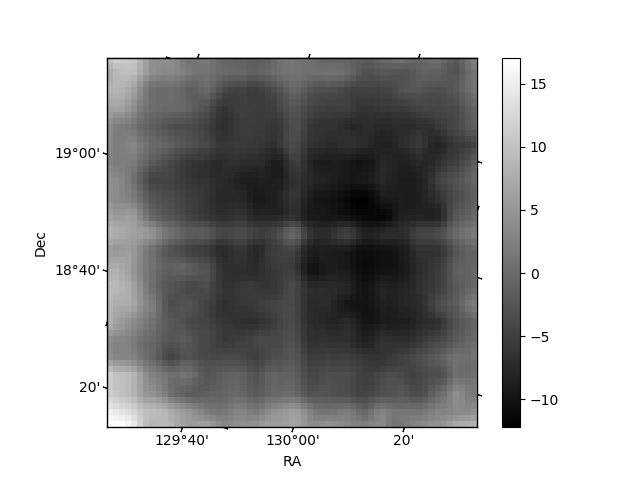
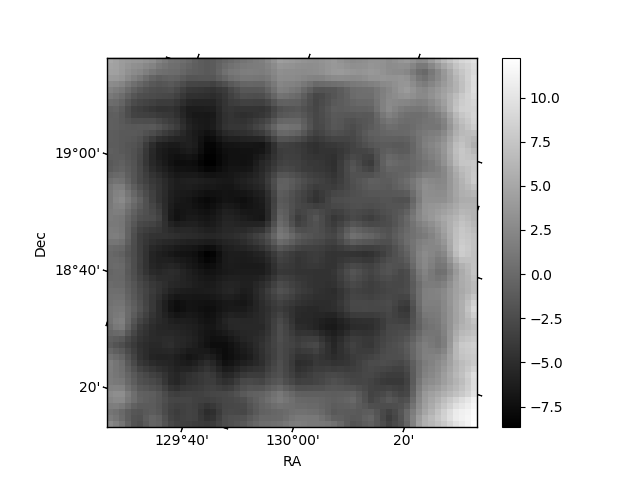
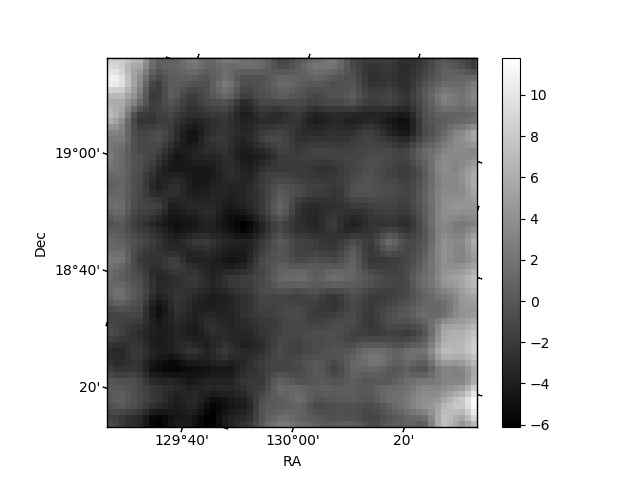
Histogram calculated using DETX and DETY for each event in the final _common_clean file
| Quadrant A | 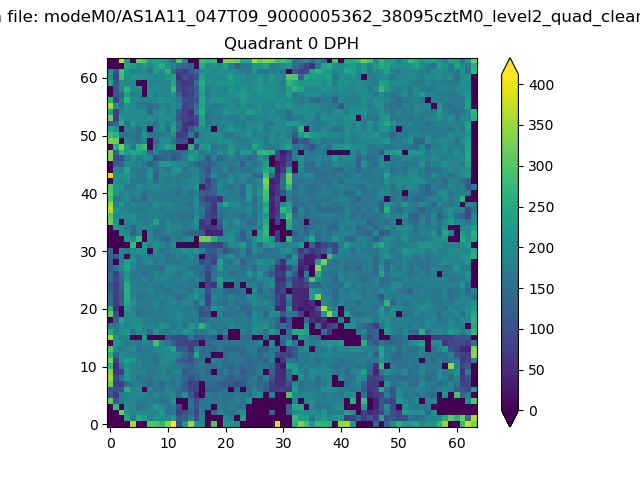 |
 |
Quadrant B |
|---|---|---|---|
| Quadrant D | 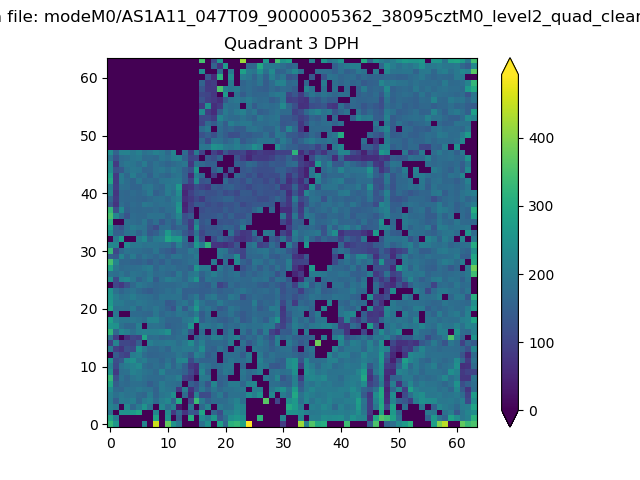 |
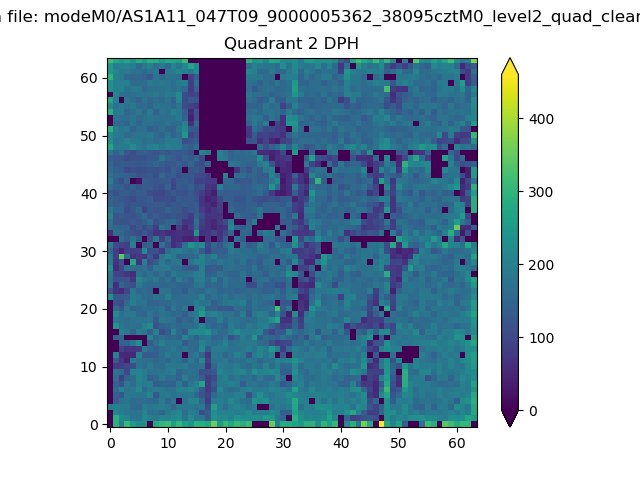 |
Quadrant C |
| Plot type | Count rate plots | Images |
|---|---|---|
| Comparison with Poisson distribution Blue bars denote a histogram of data divided into 1 sec bins. Red curve is a Poisson curve with rate = median count rate of data. |
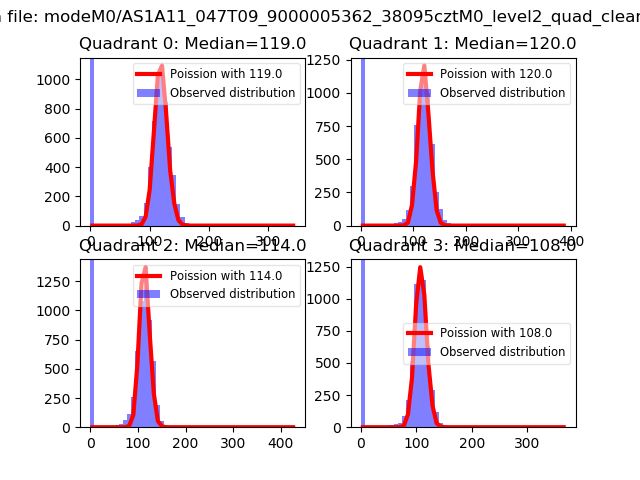 |
 |
| Quadrant-wise count rates Data is divided into 100 sec bins |
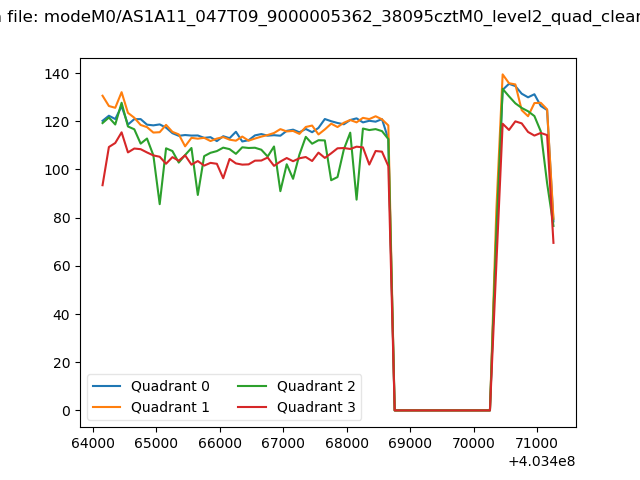 |
|
| Module-wise count rates for Quadrant A Data is divided into 100 sec bins |
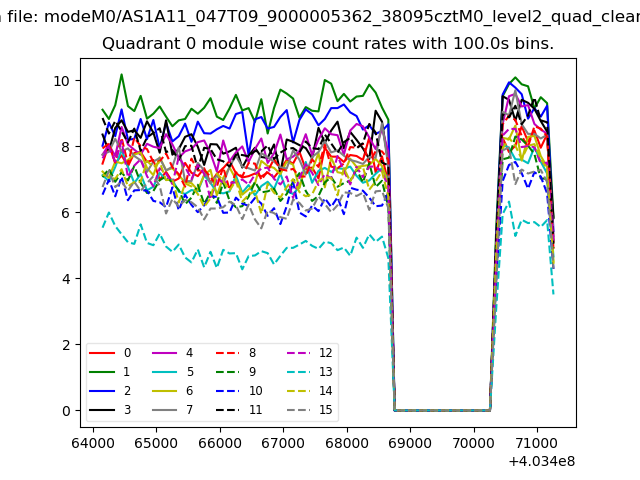 |
 |
| Module-wise count rates for Quadrant B Data is divided into 100 sec bins |
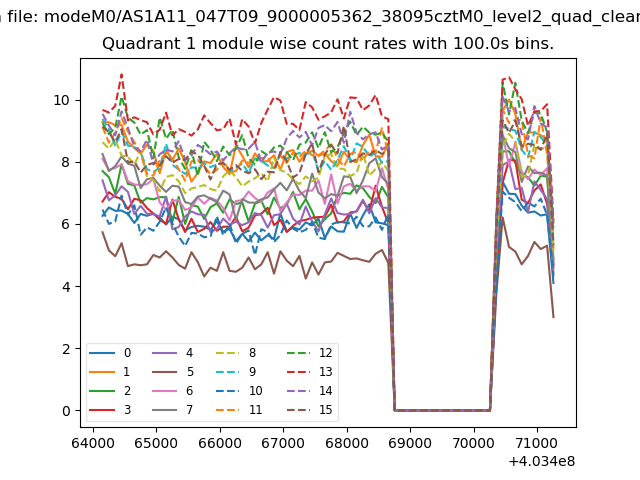 |
 |
| Module-wise count rates for Quadrant C Data is divided into 100 sec bins |
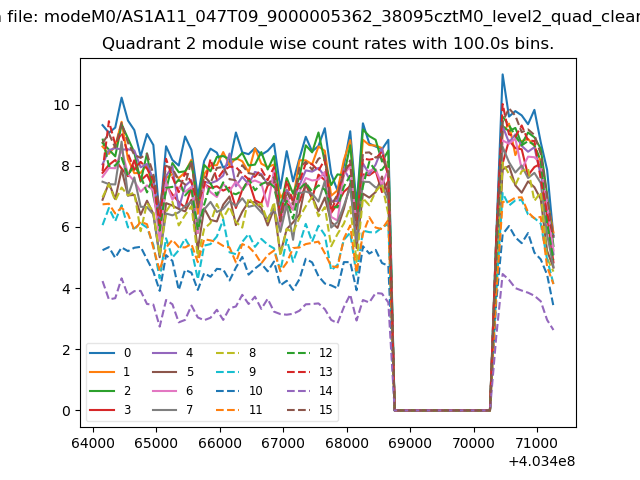 |
 |
| Module-wise count rates for Quadrant D Data is divided into 100 sec bins |
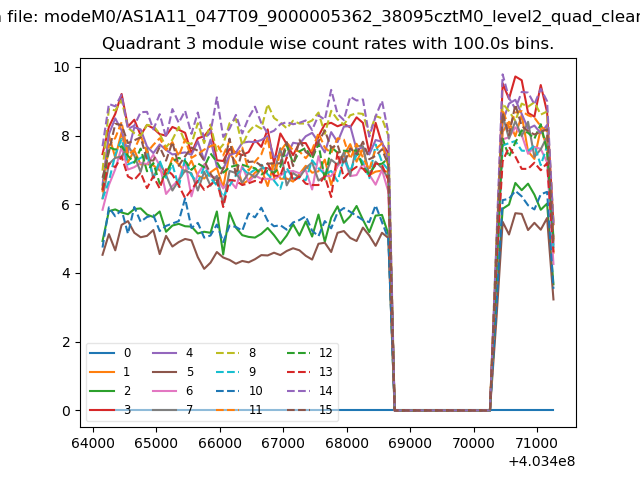 |
 |
| Parameter | Plot |
|---|---|
| CZT HV Monitor | 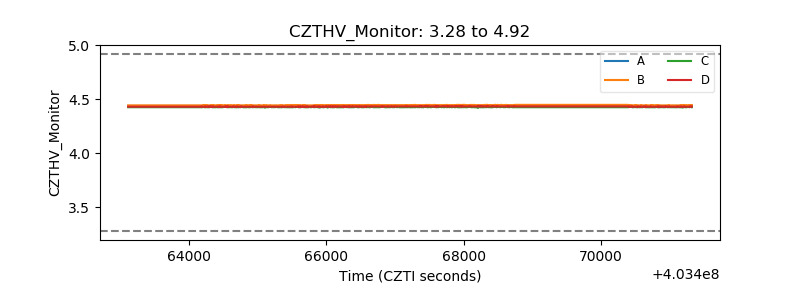 |
| D_VDD | 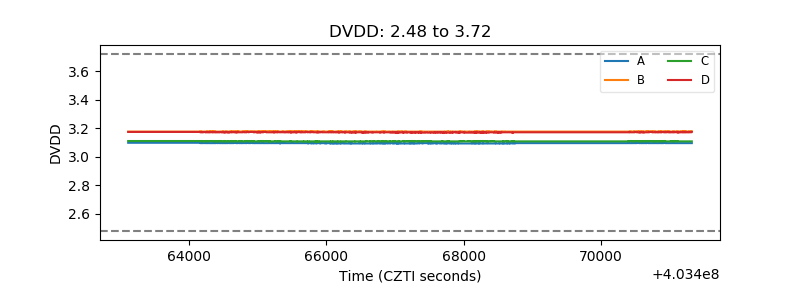 |
| Temperature 1 | 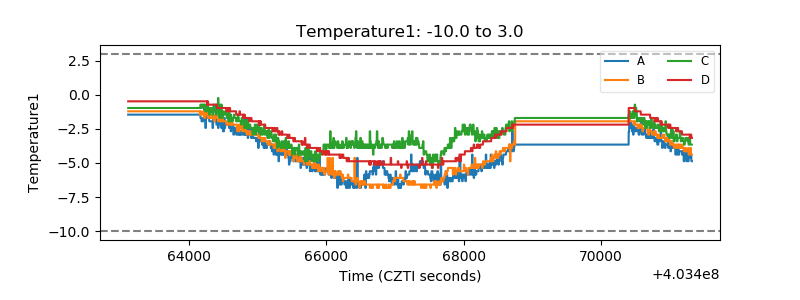 |
| Veto HV Monitor | 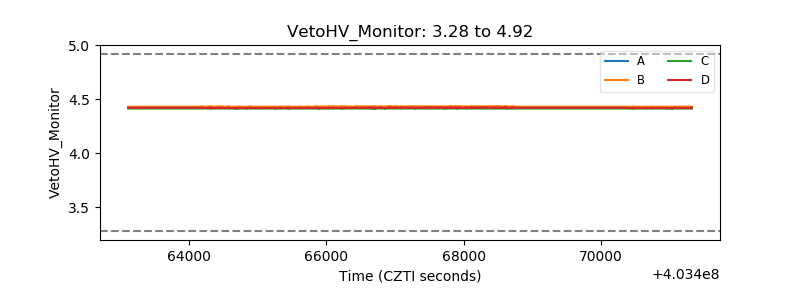 |
| Veto LLD | 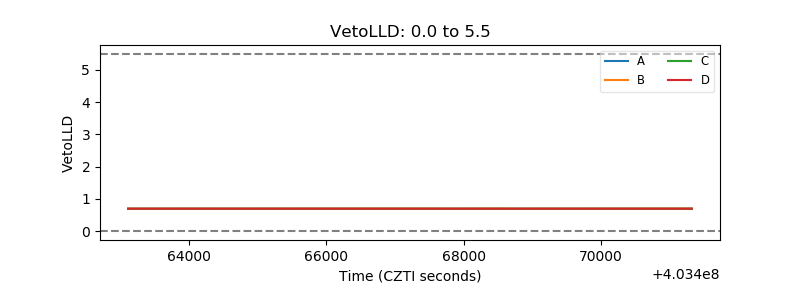 |
| Alpha Counter | 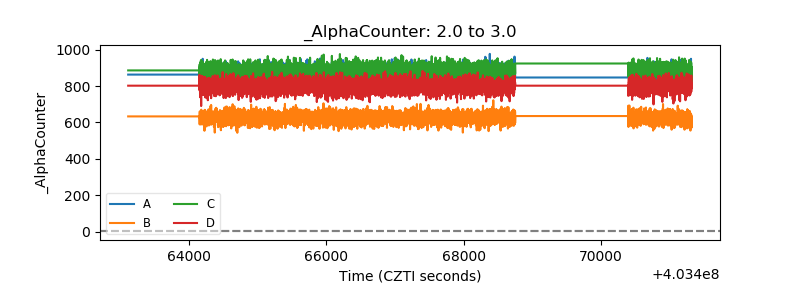 |
| _CPM_Rate | 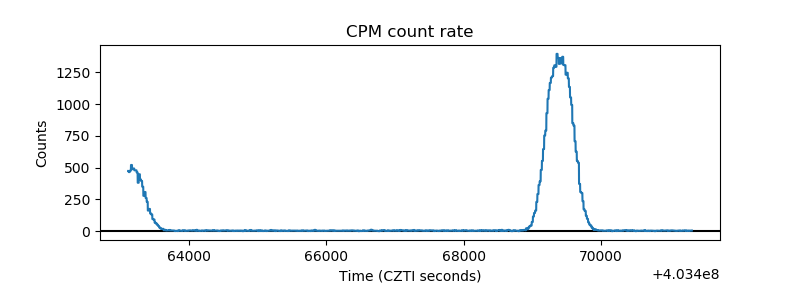 |
| CZT Counter | 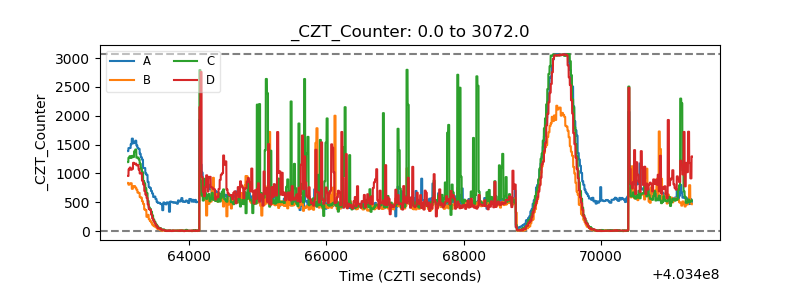 |
| +2.5 Volts monitor | 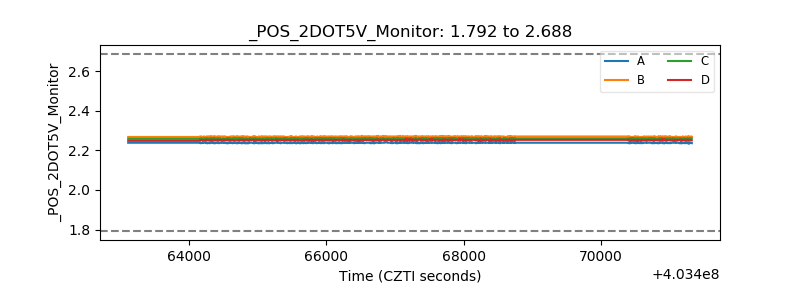 |
| +5 Volts monitor | 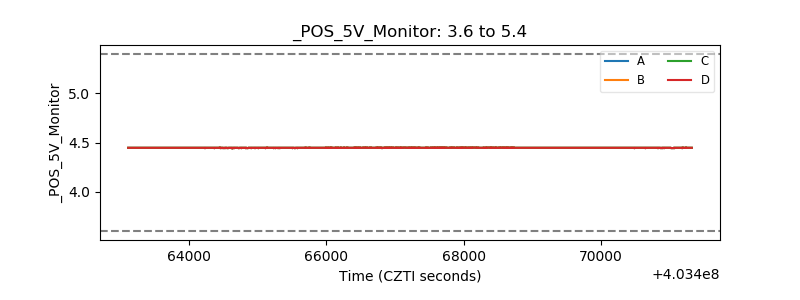 |
| _ROLL_ROT | 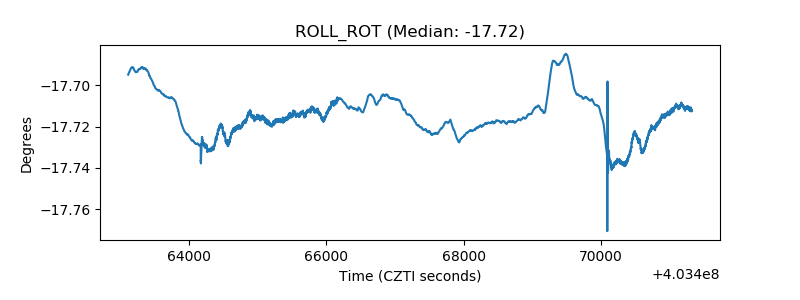 |
| _Roll_DEC | 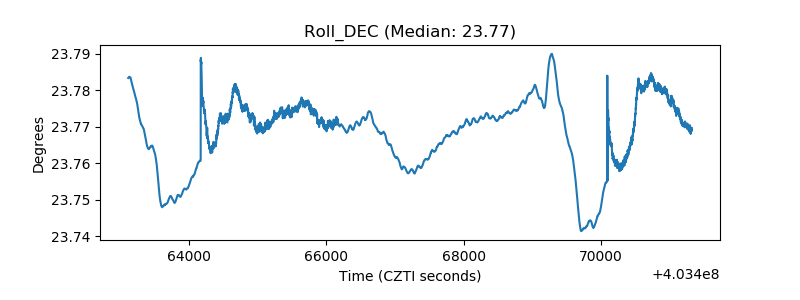 |
| _Roll_RA | 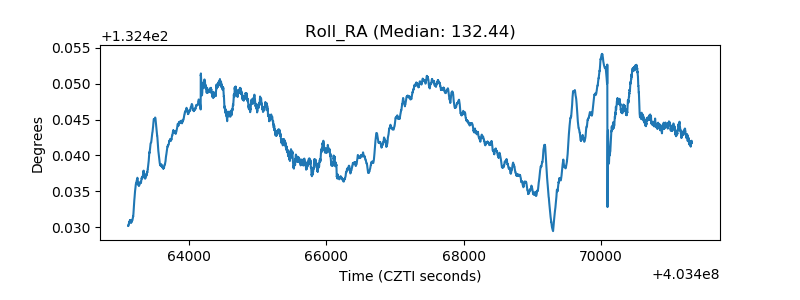 |
| Veto Counter | 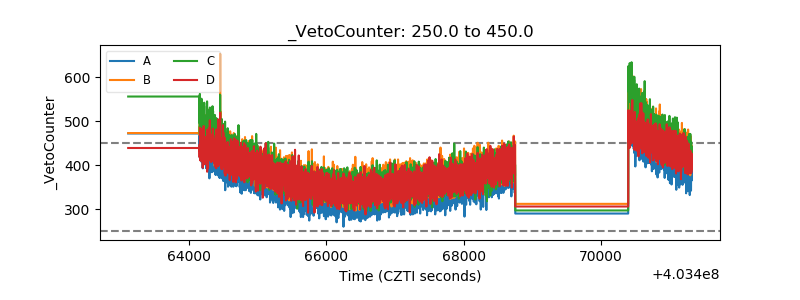 |