| Param | Original file | Final file |
|---|---|---|
| Filename | modeM0/AS1A11_047T09_9000005362_38097cztM0_level2.fits | modeM0/AS1A11_047T09_9000005362_38097cztM0_level2_quad_clean.evt |
| Size (bytes) | 394,813,440 | 93,337,920 |
| Size | 376.5 MB | 89.0 MB |
| Events in quadrant A | 2,969,913 | 650,030 |
| Events in quadrant B | 2,762,764 | 659,464 |
| Events in quadrant C | 4,365,541 | 579,978 |
| Events in quadrant D | 4,106,934 | 567,796 |
| Mode M0 | |||
|---|---|---|---|
| Quadrant | BADHDUFLAG | Total packets | Discarded packets |
| A | 0 | 12146 | 3 |
| B | 0 | 11622 | 2 |
| C | 0 | 16420 | 2 |
| D | 0 | 15792 | 2 |
| Mode SS | |||
|---|---|---|---|
| Quadrant | BADHDUFLAG | Total packets | Discarded packets |
| A | 0 | 108 | 0 |
| B | 0 | 108 | 0 |
| C | 0 | 108 | 0 |
| D | 0 | 108 | 0 |
| Mode M9 | |||
|---|---|---|---|
| Quadrant | BADHDUFLAG | Total packets | Discarded packets |
| A | 0 | 26 | 0 |
| B | 0 | 26 | 0 |
| C | 0 | 26 | 0 |
| D | 0 | 27 | 0 |
| Quadrant | Total seconds | Saturated seconds | Saturation percentage |
|---|---|---|---|
| A | 5268 | 33 | 0.626424% |
| B | 5268 | 31 | 0.588459% |
| C | 5268 | 500 | 9.491268% |
| D | 5268 | 280 | 5.315110% |
Noise dominated data is calculated using 1-second bins in cleaned event files. If a bin has >2000 counts, and if more than 50% of those come from <1% of pixels, then it is considered to be noise-dominated and hence unusable.
| Quadrant | # 1 sec bins | Bins with >0 counts | Bins with >2000 counts | High rate bins dominated by noise | Noise dominated (total time) | Noise dominated (detector-on time) | Marked lightcurve |
|---|---|---|---|---|---|---|---|
| A | 7061 | 5269 | 12 | 12 | 0.17% | 0.23% | 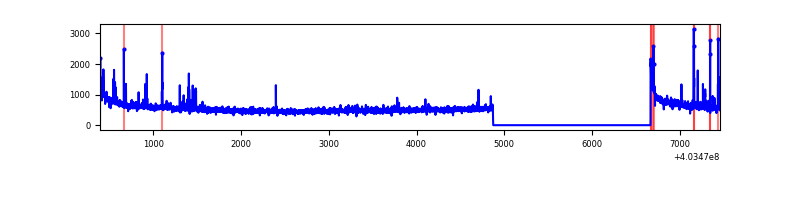 |
| B | 7061 | 5269 | 13 | 13 | 0.18% | 0.25% | 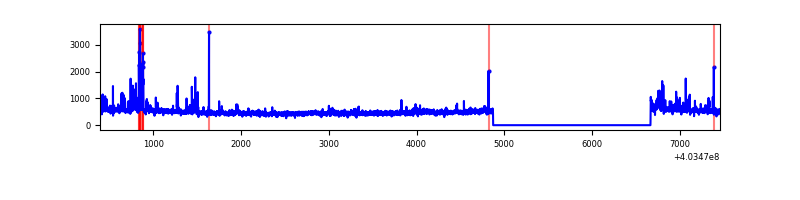 |
| C | 7061 | 5269 | 448 | 448 | 6.34% | 8.50% | 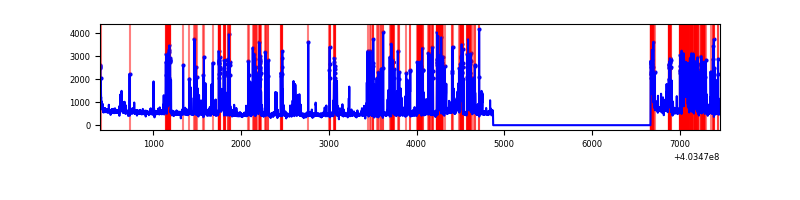 |
| D | 7061 | 5269 | 226 | 226 | 3.20% | 4.29% | 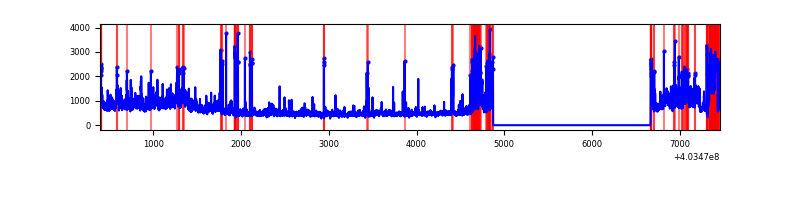 |
Top three noisy pixels from each quadrant. If the there are fewer than three noisy pixels in the level2.evt file, extra rows are filled as -1
| Pixel properties | Quadrant properties | ||||||
|---|---|---|---|---|---|---|---|
| Quadrant | DetID | PixID | Counts | Sigma | Mean | Median | Sigma |
| A | 10 | 83 | 373439 | 2917.36 | 630 | 618 | 127.8 |
| A | 12 | 16 | 59077 | 457.45 | 630 | 618 | 127.8 |
| A | 13 | 248 | 26336 | 201.25 | 630 | 618 | 127.8 |
| B | 0 | 229 | 115915 | 959.61 | 628 | 613 | 120.2 |
| B | 4 | 81 | 59835 | 492.88 | 628 | 613 | 120.2 |
| B | 5 | 172 | 42689 | 350.18 | 628 | 613 | 120.2 |
| C | 1 | 23 | 1740795 | 12602.07 | 592 | 598 | 138.1 |
| C | 15 | 214 | 211816 | 1529.59 | 592 | 598 | 138.1 |
| C | 0 | 10 | 40000 | 285.34 | 592 | 598 | 138.1 |
| D | 12 | 235 | 414723 | 2826.69 | 602 | 586 | 146.5 |
| D | 13 | 138 | 335292 | 2284.54 | 602 | 586 | 146.5 |
| D | 12 | 233 | 293123 | 1996.71 | 602 | 586 | 146.5 |
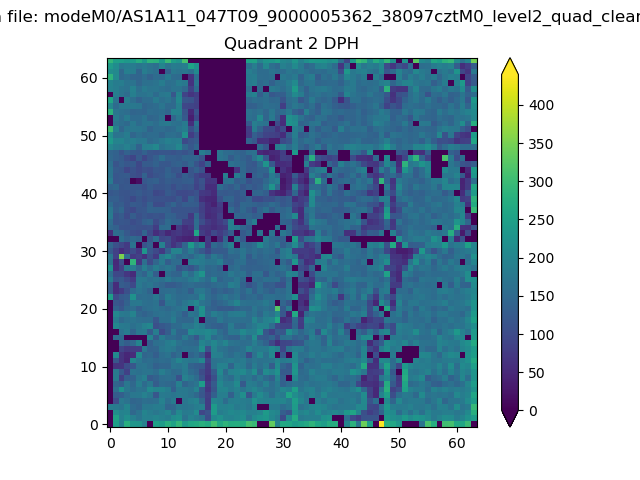
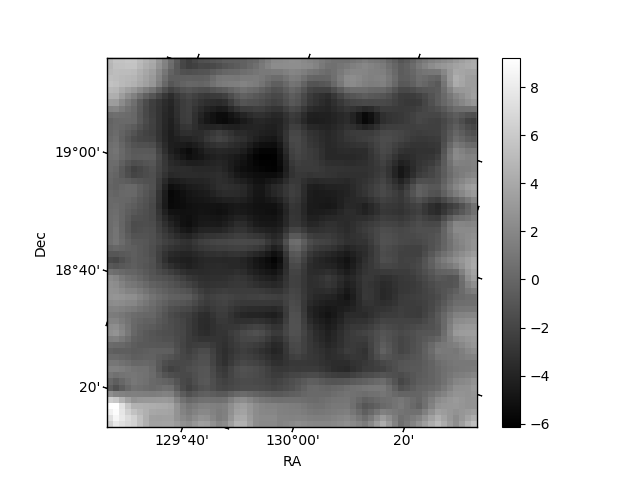
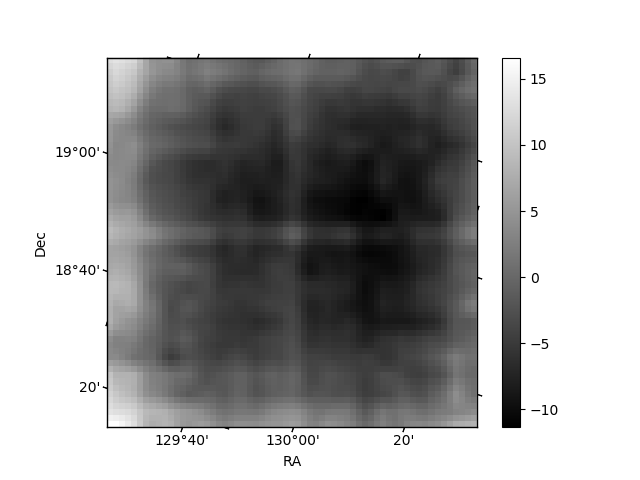
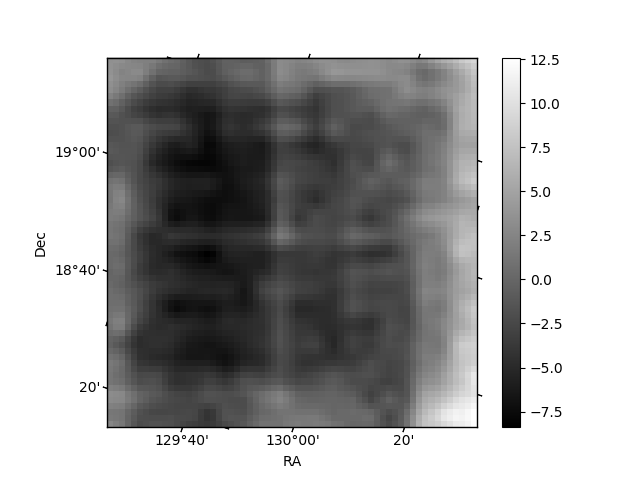
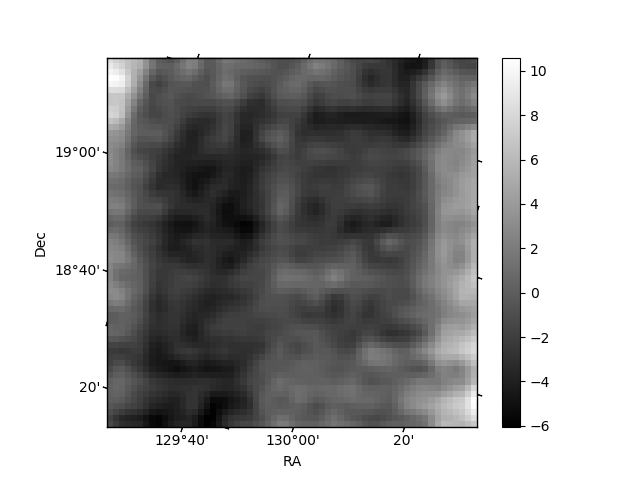
Histogram calculated using DETX and DETY for each event in the final _common_clean file
| Quadrant A | 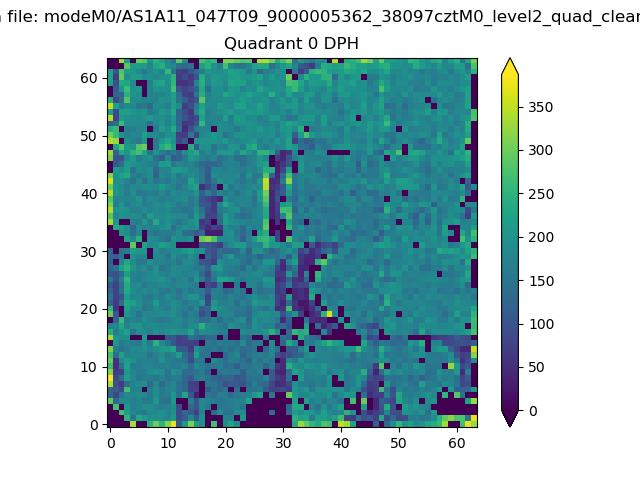 |
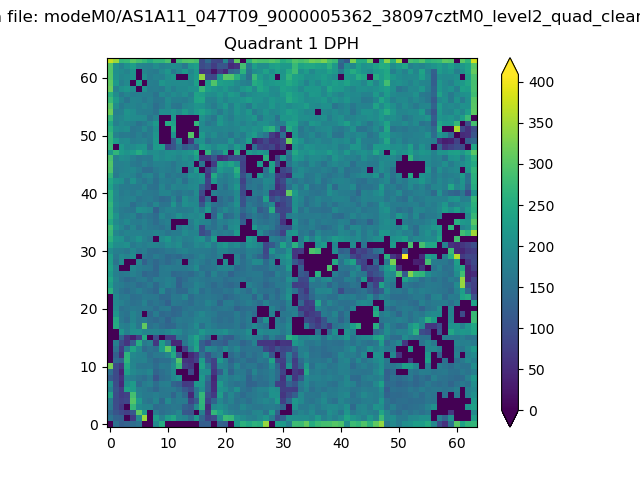 |
Quadrant B |
|---|---|---|---|
| Quadrant D | 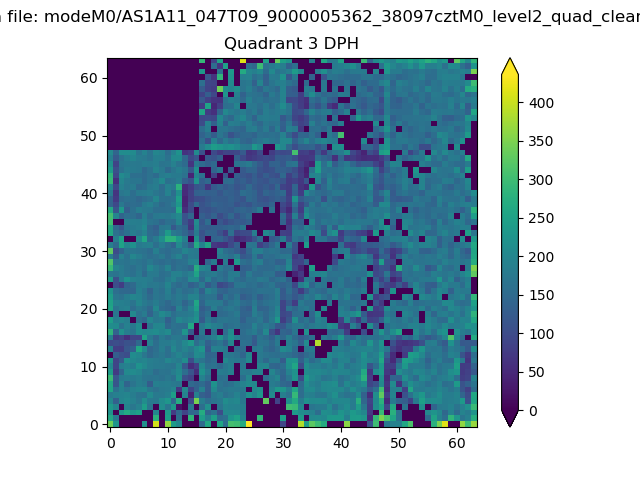 |
 |
Quadrant C |
| Plot type | Count rate plots | Images |
|---|---|---|
| Comparison with Poisson distribution Blue bars denote a histogram of data divided into 1 sec bins. Red curve is a Poisson curve with rate = median count rate of data. |
 |
 |
| Quadrant-wise count rates Data is divided into 100 sec bins |
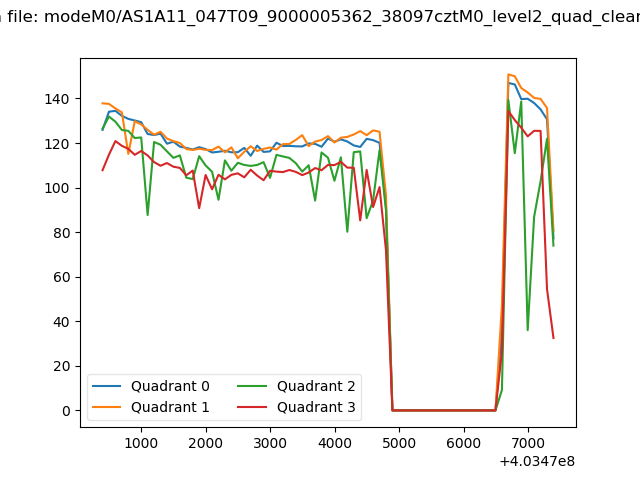 |
|
| Module-wise count rates for Quadrant A Data is divided into 100 sec bins |
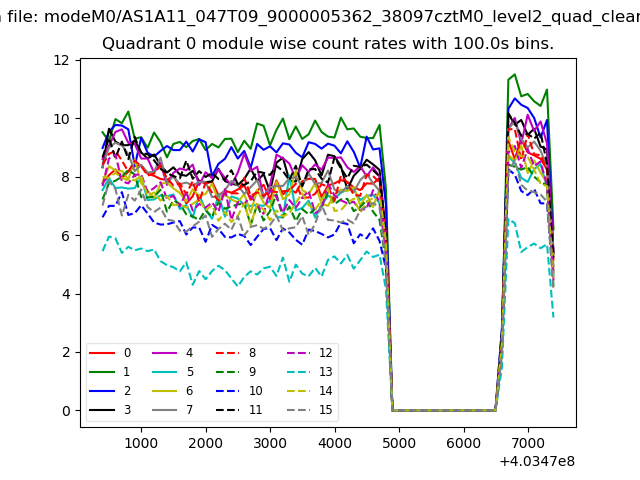 |
 |
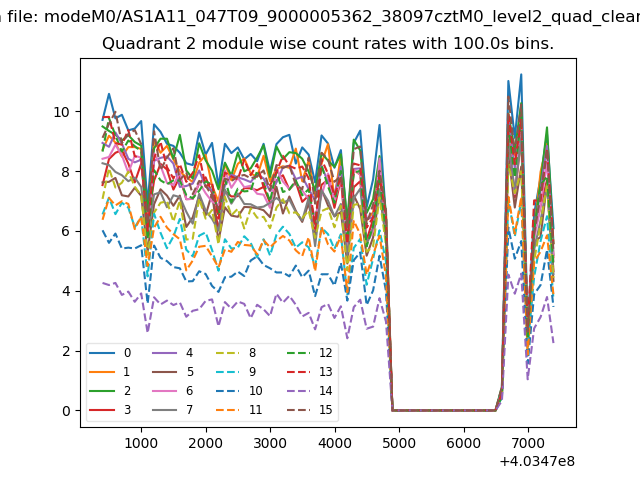
| Module-wise count rates for Quadrant B Data is divided into 100 sec bins |
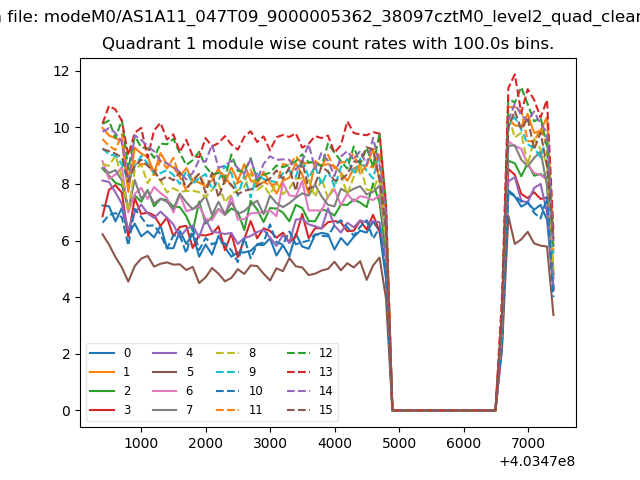 |
 |
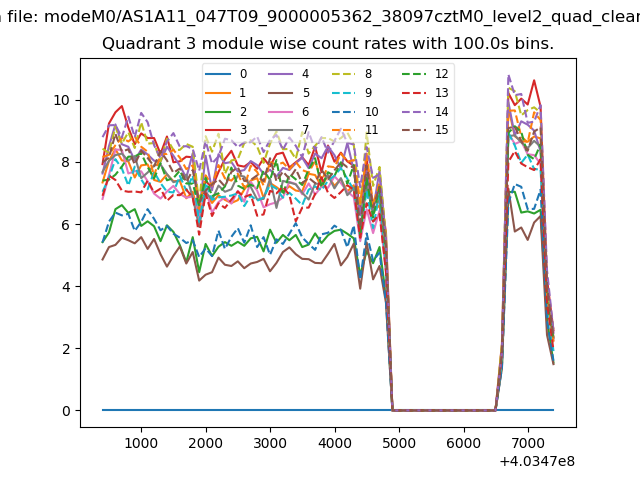
| Module-wise count rates for Quadrant C Data is divided into 100 sec bins |
 |
 |
| Module-wise count rates for Quadrant D Data is divided into 100 sec bins |
 |
 |
| Parameter | Plot |
|---|---|
| CZT HV Monitor | 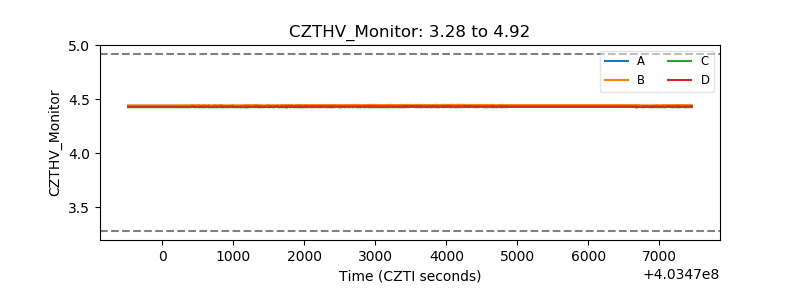 |
| D_VDD | 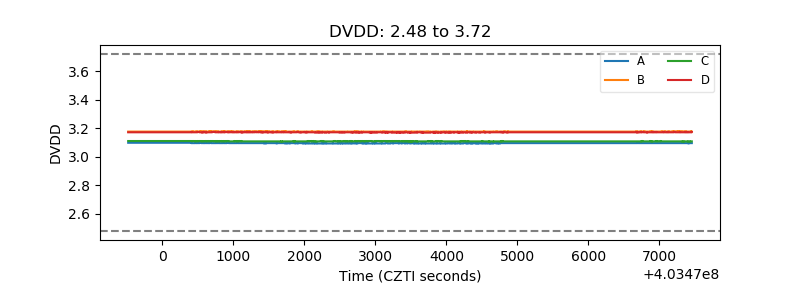 |
| Temperature 1 | 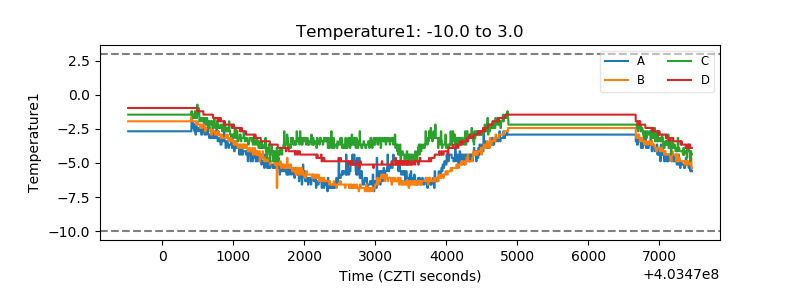 |
| Veto HV Monitor | 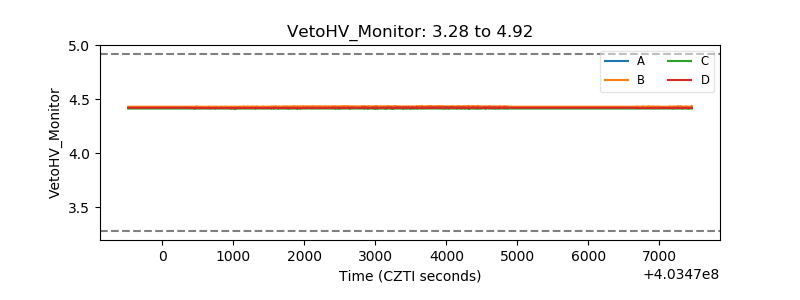 |
| Veto LLD | 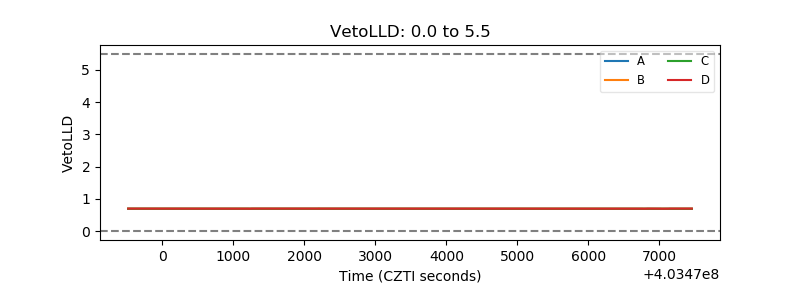 |
| Alpha Counter | 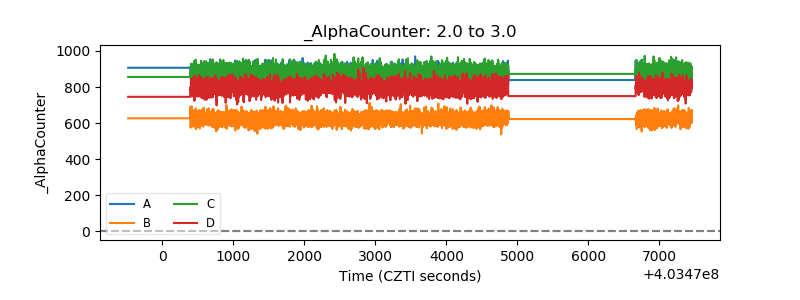 |
| _CPM_Rate |  |
| CZT Counter | 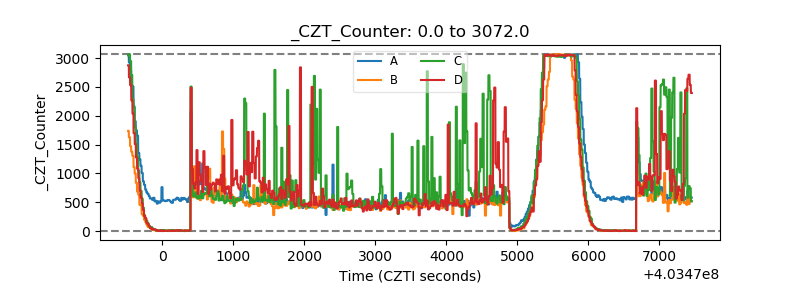 |
| +2.5 Volts monitor |  |
| +5 Volts monitor | 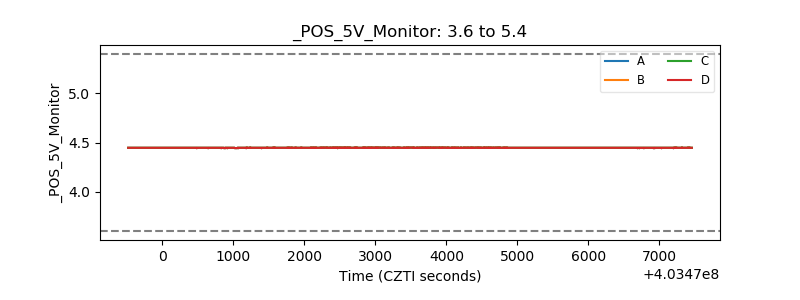 |
| _ROLL_ROT | 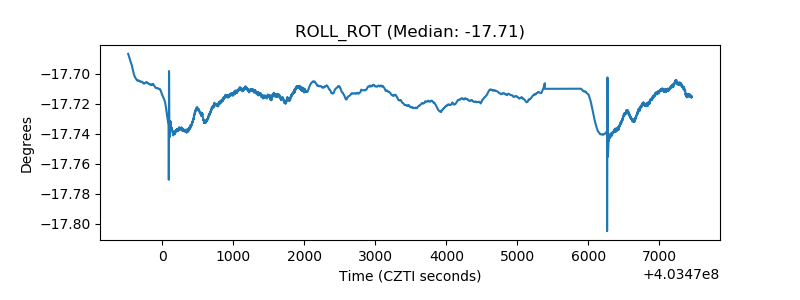 |
| _Roll_DEC |  |
| _Roll_RA | 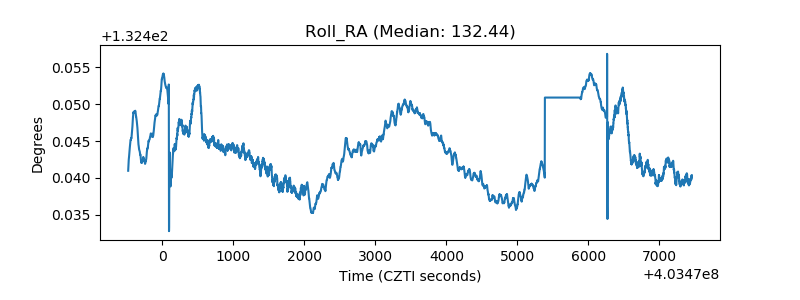 |
| Veto Counter | 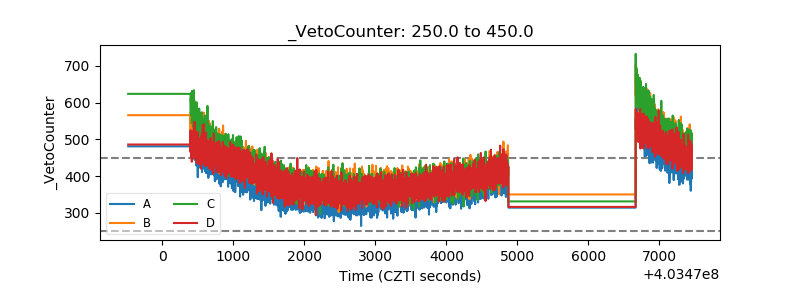 |