| Param | Original file | Final file |
|---|---|---|
| Filename | modeM0/AS1A11_047T09_9000005362_38098cztM0_level2.fits | modeM0/AS1A11_047T09_9000005362_38098cztM0_level2_quad_clean.evt |
| Size (bytes) | 416,761,920 | 93,133,440 |
| Size | 397.5 MB | 88.8 MB |
| Events in quadrant A | 2,963,079 | 664,391 |
| Events in quadrant B | 2,815,641 | 674,515 |
| Events in quadrant C | 5,541,286 | 538,999 |
| Events in quadrant D | 3,705,593 | 580,357 |
| Mode M0 | |||
|---|---|---|---|
| Quadrant | BADHDUFLAG | Total packets | Discarded packets |
| A | 0 | 12006 | 3 |
| B | 0 | 11676 | 2 |
| C | 0 | 19876 | 2 |
| D | 0 | 14437 | 2 |
| Mode SS | |||
|---|---|---|---|
| Quadrant | BADHDUFLAG | Total packets | Discarded packets |
| A | 0 | 106 | 0 |
| B | 0 | 106 | 0 |
| C | 0 | 106 | 0 |
| D | 0 | 106 | 0 |
| Mode M9 | |||
|---|---|---|---|
| Quadrant | BADHDUFLAG | Total packets | Discarded packets |
| A | 0 | 26 | 0 |
| B | 0 | 26 | 0 |
| C | 0 | 26 | 0 |
| D | 0 | 27 | 0 |
| Quadrant | Total seconds | Saturated seconds | Saturation percentage |
|---|---|---|---|
| A | 5165 | 38 | 0.735721% |
| B | 5165 | 77 | 1.490803% |
| C | 5165 | 1014 | 19.632139% |
| D | 5165 | 240 | 4.646660% |
Noise dominated data is calculated using 1-second bins in cleaned event files. If a bin has >2000 counts, and if more than 50% of those come from <1% of pixels, then it is considered to be noise-dominated and hence unusable.
| Quadrant | # 1 sec bins | Bins with >0 counts | Bins with >2000 counts | High rate bins dominated by noise | Noise dominated (total time) | Noise dominated (detector-on time) | Marked lightcurve |
|---|---|---|---|---|---|---|---|
| A | 7079 | 5166 | 29 | 29 | 0.41% | 0.56% | 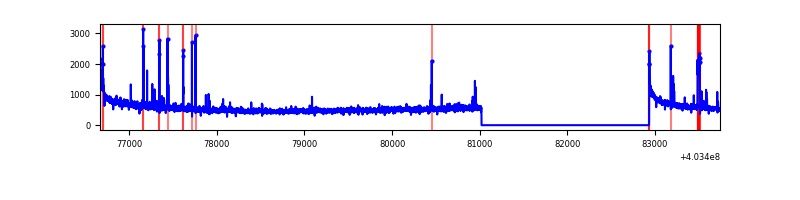 |
| B | 7079 | 5166 | 60 | 60 | 0.85% | 1.16% | 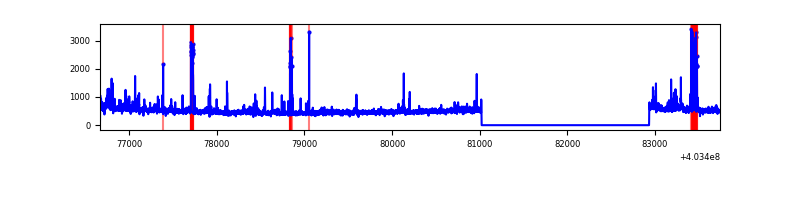 |
| C | 7079 | 5165 | 931 | 931 | 13.15% | 18.03% | 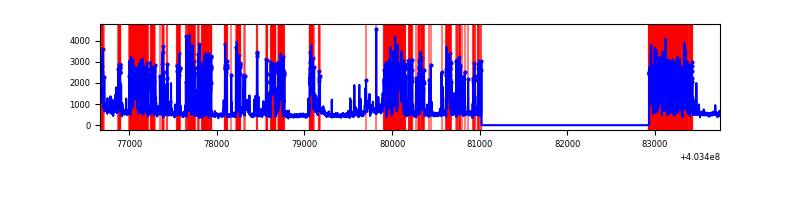 |
| D | 7079 | 5166 | 218 | 218 | 3.08% | 4.22% | 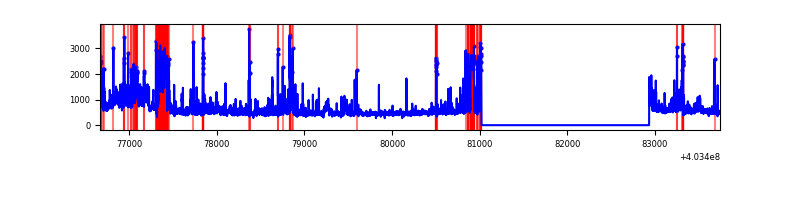 |
Top three noisy pixels from each quadrant. If the there are fewer than three noisy pixels in the level2.evt file, extra rows are filled as -1
| Pixel properties | Quadrant properties | ||||||
|---|---|---|---|---|---|---|---|
| Quadrant | DetID | PixID | Counts | Sigma | Mean | Median | Sigma |
| A | 10 | 83 | 359992 | 2848.39 | 628 | 617 | 126.2 |
| A | 0 | 247 | 39803 | 310.59 | 628 | 617 | 126.2 |
| A | 13 | 248 | 33542 | 260.96 | 628 | 617 | 126.2 |
| B | 0 | 229 | 170417 | 1442.4 | 625 | 610 | 117.7 |
| B | 5 | 172 | 126513 | 1069.46 | 625 | 610 | 117.7 |
| B | 0 | 189 | 23407 | 193.65 | 625 | 610 | 117.7 |
| C | 1 | 23 | 2937045 | 22518.31 | 557 | 562 | 130.4 |
| C | 15 | 214 | 193773 | 1481.63 | 557 | 562 | 130.4 |
| C | 14 | 254 | 86337 | 657.76 | 557 | 562 | 130.4 |
| D | 13 | 138 | 489227 | 3326.33 | 602 | 586 | 146.9 |
| D | 10 | 40 | 249485 | 1694.33 | 602 | 586 | 146.9 |
| D | 12 | 233 | 139426 | 945.13 | 602 | 586 | 146.9 |
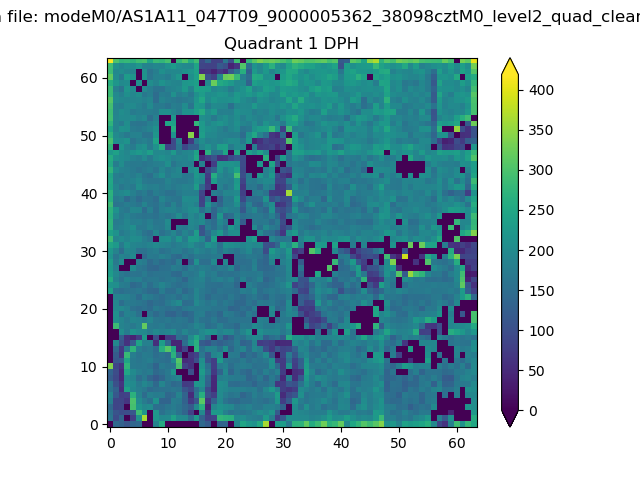
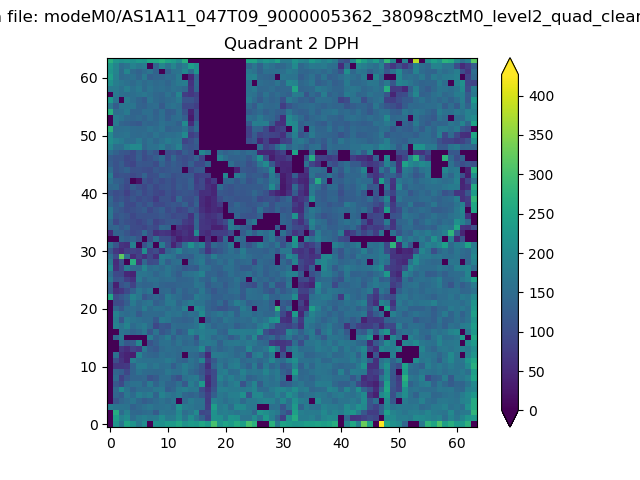
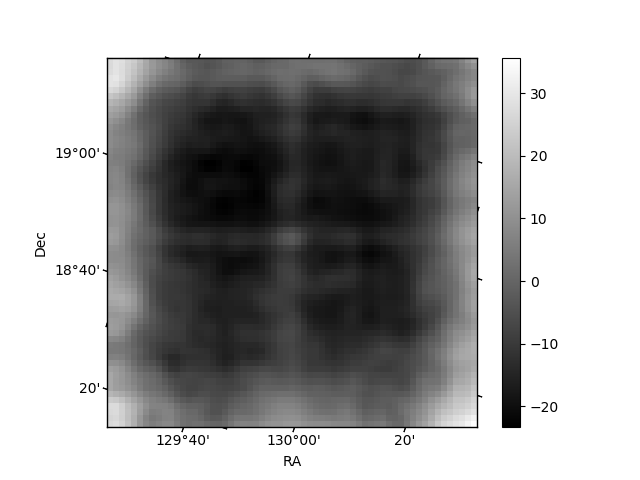
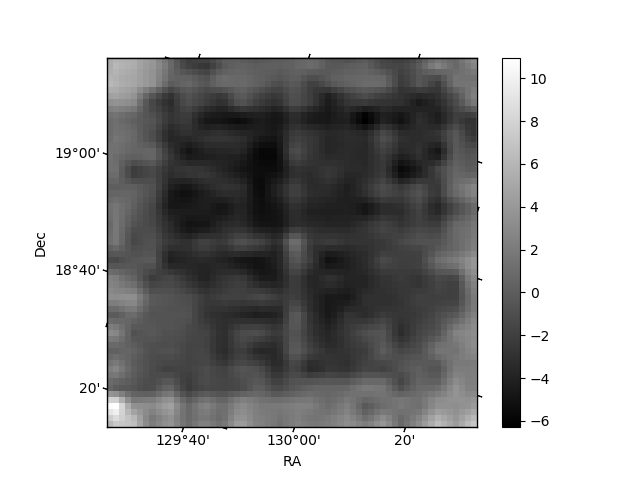
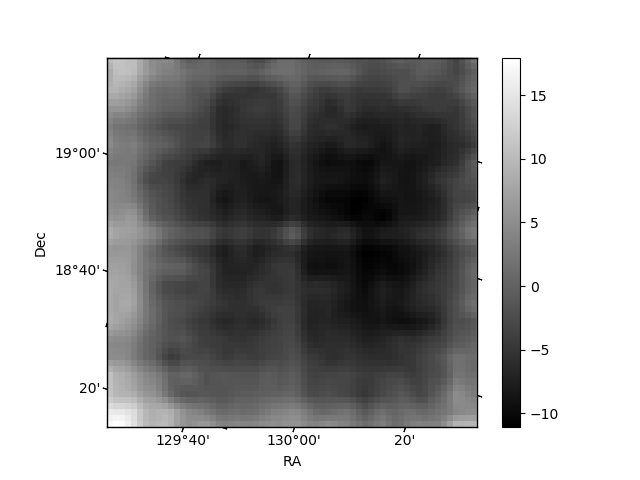
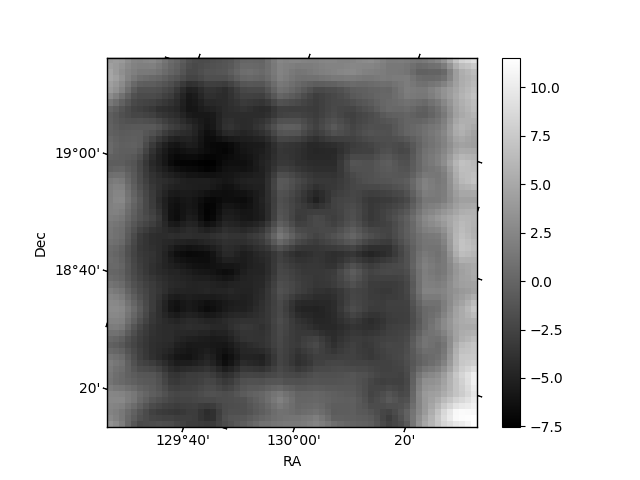
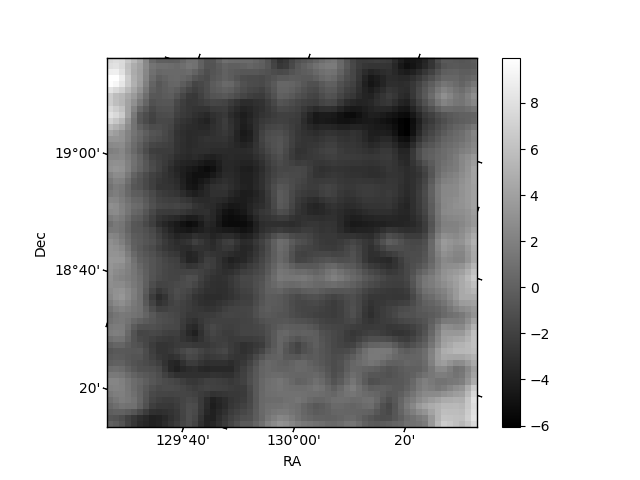
Histogram calculated using DETX and DETY for each event in the final _common_clean file
| Quadrant A |  |
 |
Quadrant B |
|---|---|---|---|
| Quadrant D | 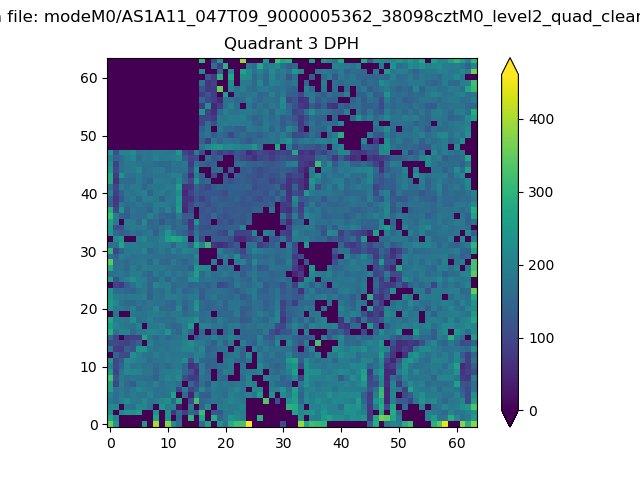 |
 |
Quadrant C |
| Plot type | Count rate plots | Images |
|---|---|---|
| Comparison with Poisson distribution Blue bars denote a histogram of data divided into 1 sec bins. Red curve is a Poisson curve with rate = median count rate of data. |
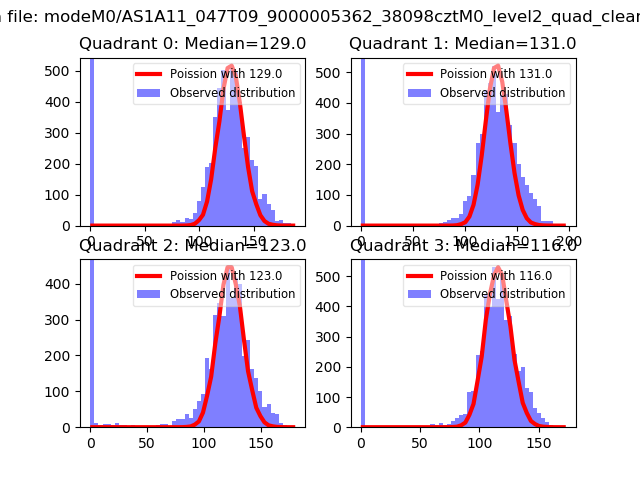 |
 |
| Quadrant-wise count rates Data is divided into 100 sec bins |
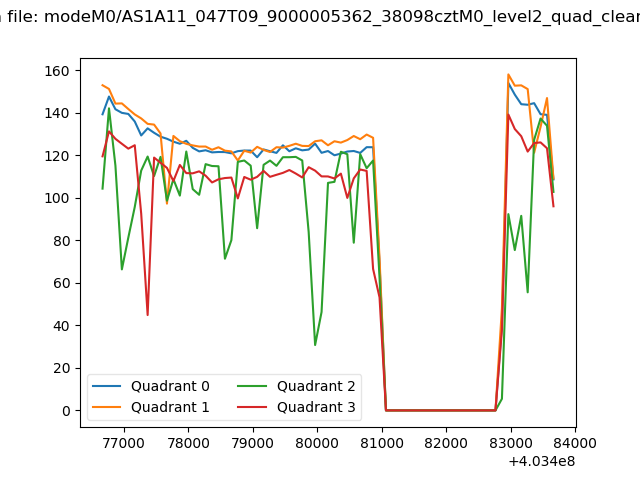 |
|
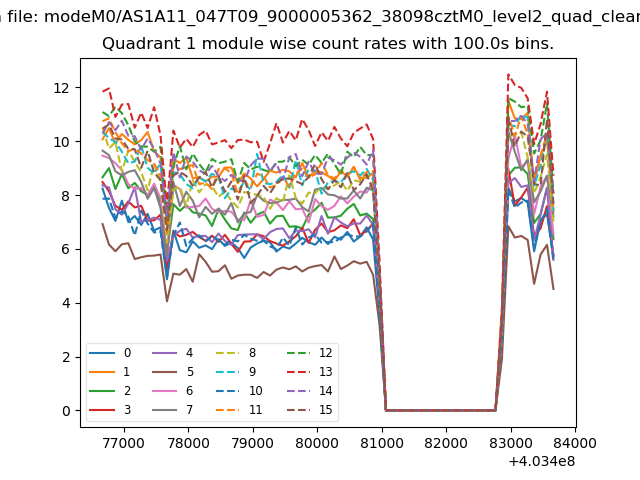
| Module-wise count rates for Quadrant A Data is divided into 100 sec bins |
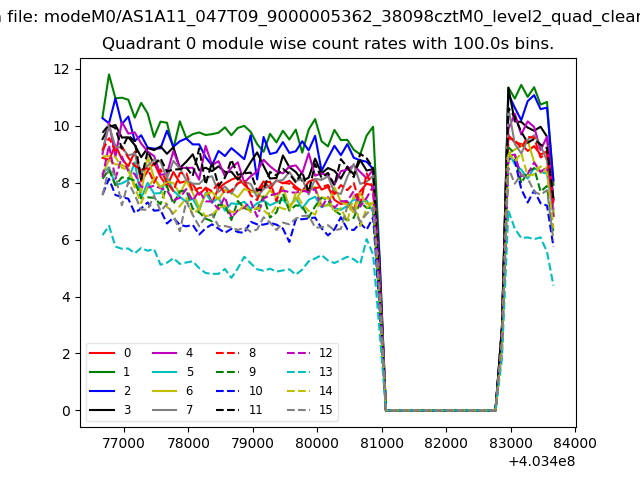 |
 |
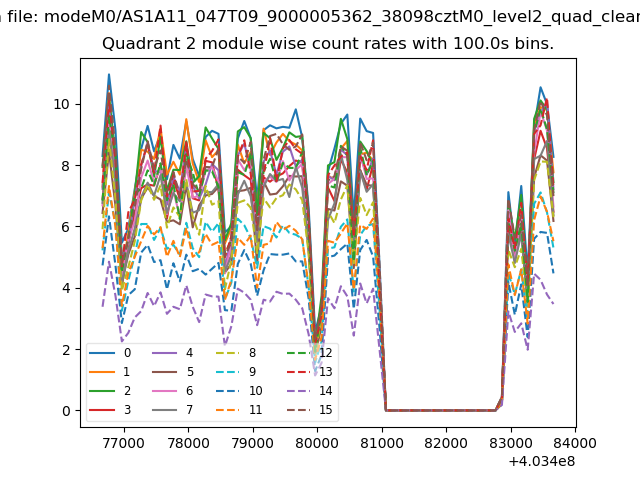
| Module-wise count rates for Quadrant B Data is divided into 100 sec bins |
 |
 |
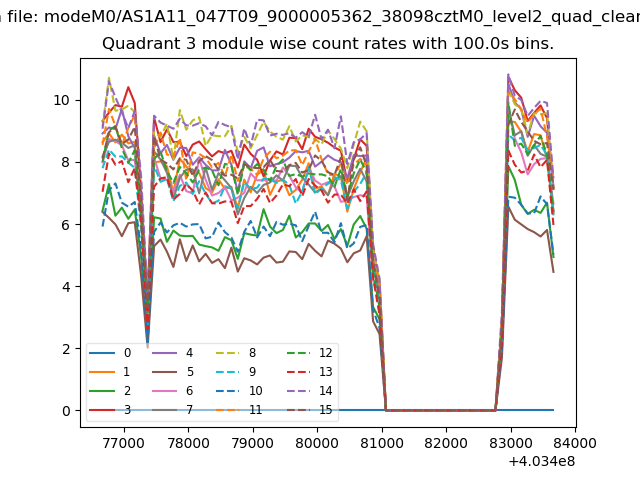
| Module-wise count rates for Quadrant C Data is divided into 100 sec bins |
 |
 |
| Module-wise count rates for Quadrant D Data is divided into 100 sec bins |
 |
 |
| Parameter | Plot |
|---|---|
| CZT HV Monitor | 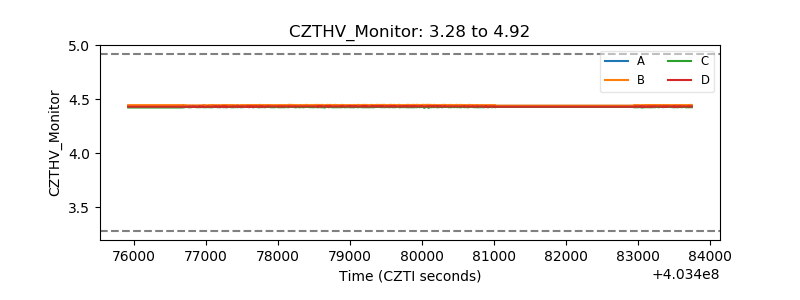 |
| D_VDD | 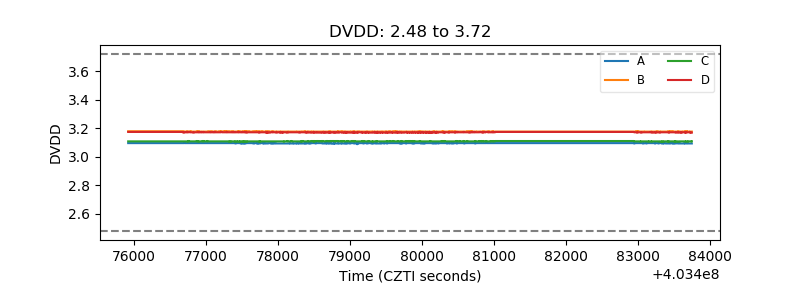 |
| Temperature 1 | 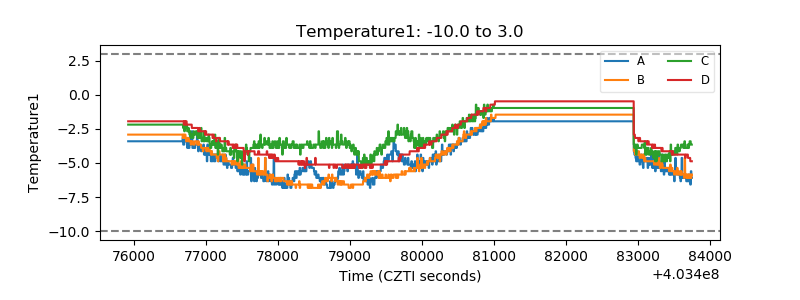 |
| Veto HV Monitor | 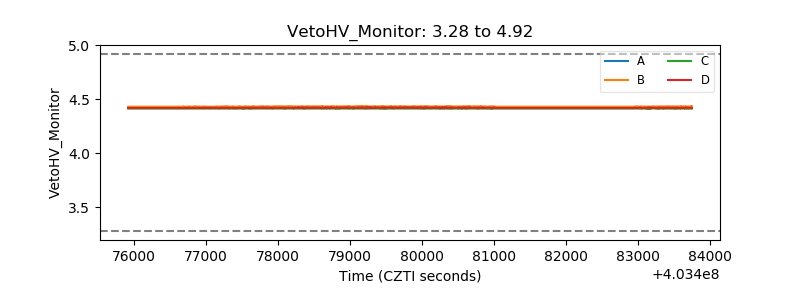 |
| Veto LLD | 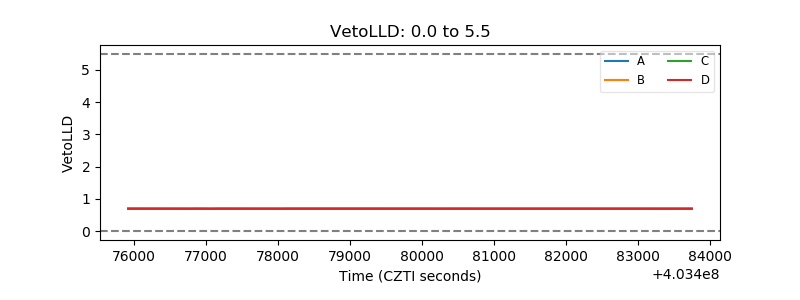 |
| Alpha Counter | 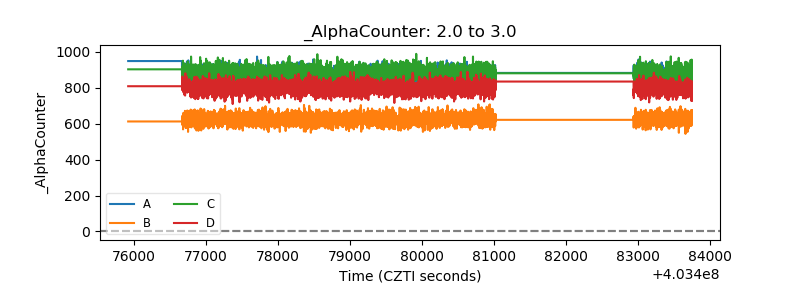 |
| _CPM_Rate | 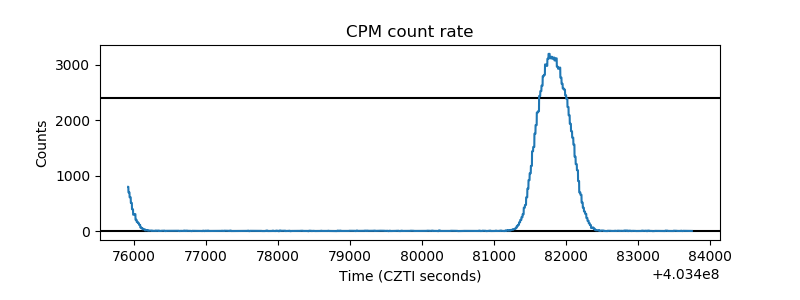 |
| CZT Counter | 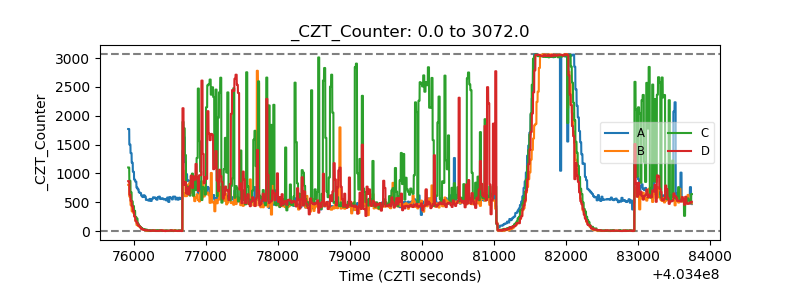 |
| +2.5 Volts monitor | 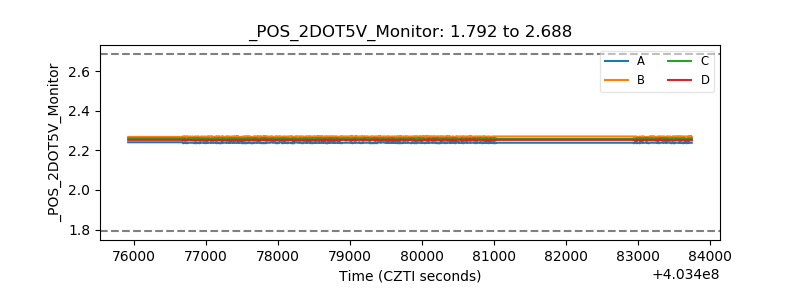 |
| +5 Volts monitor | 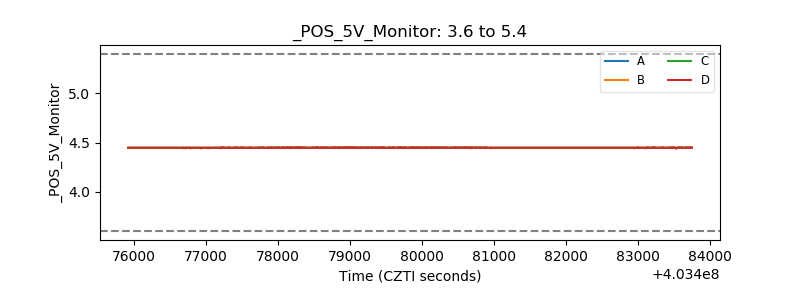 |
| _ROLL_ROT | 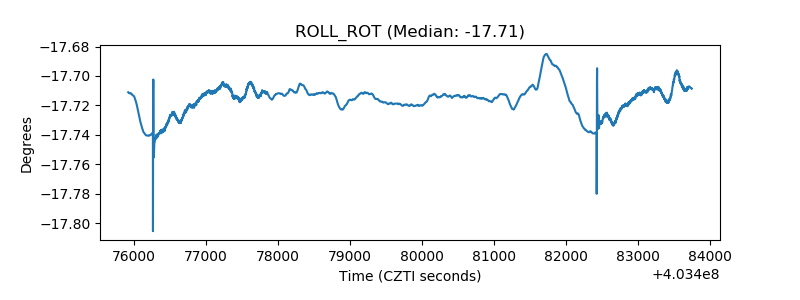 |
| _Roll_DEC | 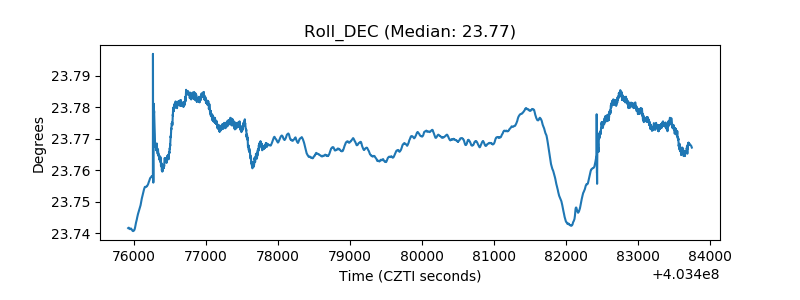 |
| _Roll_RA | 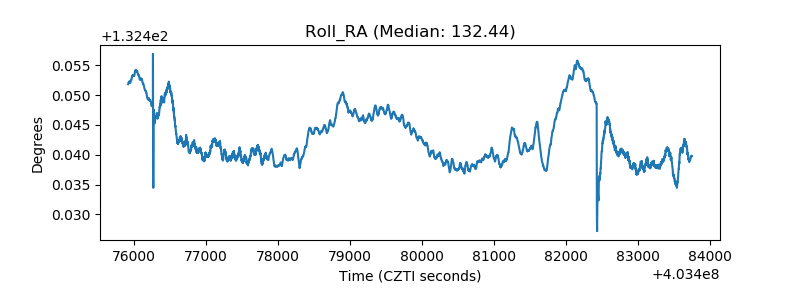 |
| Veto Counter | 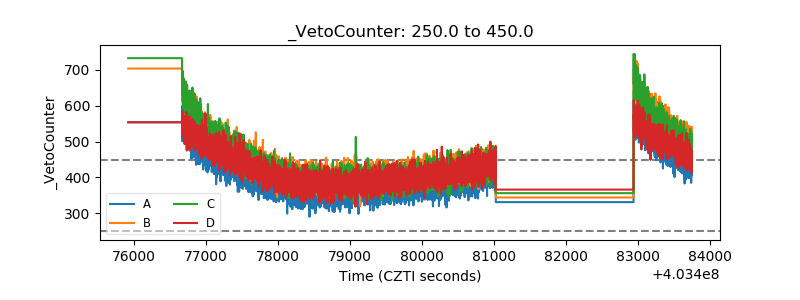 |