| Param | Original file | Final file |
|---|---|---|
| Filename | modeM0/AS1A11_047T09_9000005362_38099cztM0_level2.fits | modeM0/AS1A11_047T09_9000005362_38099cztM0_level2_quad_clean.evt |
| Size (bytes) | 402,108,480 | 93,317,760 |
| Size | 383.5 MB | 89.0 MB |
| Events in quadrant A | 2,992,601 | 660,013 |
| Events in quadrant B | 2,767,102 | 685,249 |
| Events in quadrant C | 5,237,069 | 556,230 |
| Events in quadrant D | 3,495,774 | 571,257 |
| Mode M0 | |||
|---|---|---|---|
| Quadrant | BADHDUFLAG | Total packets | Discarded packets |
| A | 0 | 11943 | 3 |
| B | 0 | 11294 | 2 |
| C | 0 | 18834 | 2 |
| D | 0 | 13656 | 2 |
| Mode SS | |||
|---|---|---|---|
| Quadrant | BADHDUFLAG | Total packets | Discarded packets |
| A | 0 | 102 | 0 |
| B | 0 | 102 | 0 |
| C | 0 | 102 | 0 |
| D | 0 | 102 | 0 |
| Mode M9 | |||
|---|---|---|---|
| Quadrant | BADHDUFLAG | Total packets | Discarded packets |
| A | 0 | 28 | 0 |
| B | 0 | 28 | 0 |
| C | 0 | 28 | 0 |
| D | 0 | 29 | 0 |
| Quadrant | Total seconds | Saturated seconds | Saturation percentage |
|---|---|---|---|
| A | 5041 | 89 | 1.765523% |
| B | 5041 | 56 | 1.110891% |
| C | 5041 | 875 | 17.357667% |
| D | 5041 | 264 | 5.237056% |
Noise dominated data is calculated using 1-second bins in cleaned event files. If a bin has >2000 counts, and if more than 50% of those come from <1% of pixels, then it is considered to be noise-dominated and hence unusable.
| Quadrant | # 1 sec bins | Bins with >0 counts | Bins with >2000 counts | High rate bins dominated by noise | Noise dominated (total time) | Noise dominated (detector-on time) | Marked lightcurve |
|---|---|---|---|---|---|---|---|
| A | 7074 | 5042 | 73 | 73 | 1.03% | 1.45% | 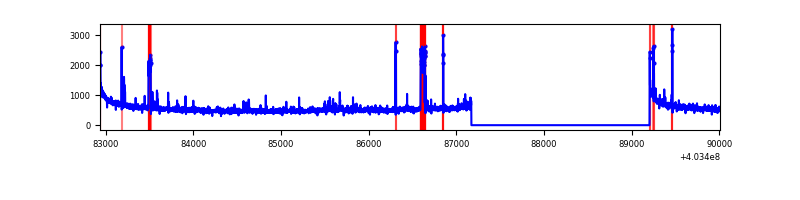 |
| B | 7074 | 5042 | 42 | 42 | 0.59% | 0.83% | 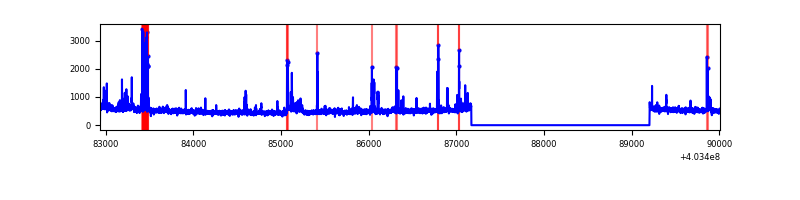 |
| C | 7074 | 5042 | 825 | 825 | 11.66% | 16.36% | 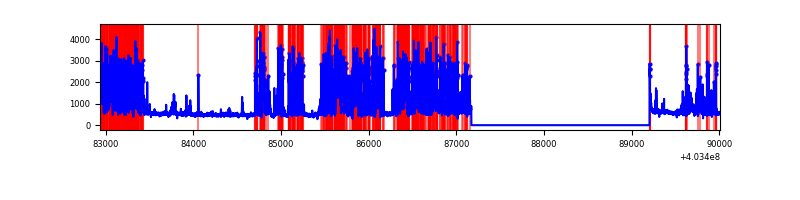 |
| D | 7074 | 5042 | 262 | 262 | 3.70% | 5.20% | 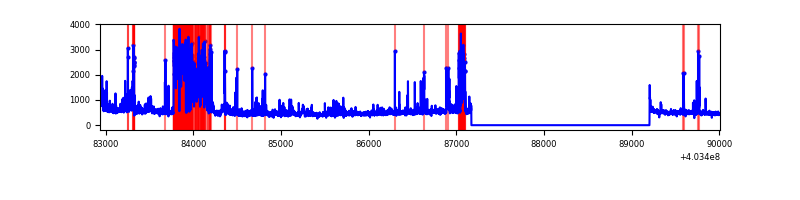 |
Top three noisy pixels from each quadrant. If the there are fewer than three noisy pixels in the level2.evt file, extra rows are filled as -1
| Pixel properties | Quadrant properties | ||||||
|---|---|---|---|---|---|---|---|
| Quadrant | DetID | PixID | Counts | Sigma | Mean | Median | Sigma |
| A | 10 | 83 | 337524 | 2746.42 | 612 | 602 | 122.7 |
| A | 0 | 247 | 167592 | 1361.22 | 612 | 602 | 122.7 |
| A | 9 | 143 | 28032 | 223.6 | 612 | 602 | 122.7 |
| B | 0 | 229 | 148207 | 1250.44 | 620 | 606 | 118.0 |
| B | 5 | 172 | 111060 | 935.74 | 620 | 606 | 118.0 |
| B | 0 | 189 | 28462 | 235.99 | 620 | 606 | 118.0 |
| C | 1 | 23 | 2793527 | 21649.26 | 555 | 561 | 129.0 |
| C | 15 | 214 | 195660 | 1512.28 | 555 | 561 | 129.0 |
| C | 0 | 10 | 33155 | 252.65 | 555 | 561 | 129.0 |
| D | 12 | 227 | 665172 | 4622.19 | 588 | 572 | 143.8 |
| D | 12 | 233 | 150128 | 1040.14 | 588 | 572 | 143.8 |
| D | 2 | 250 | 98861 | 683.58 | 588 | 572 | 143.8 |
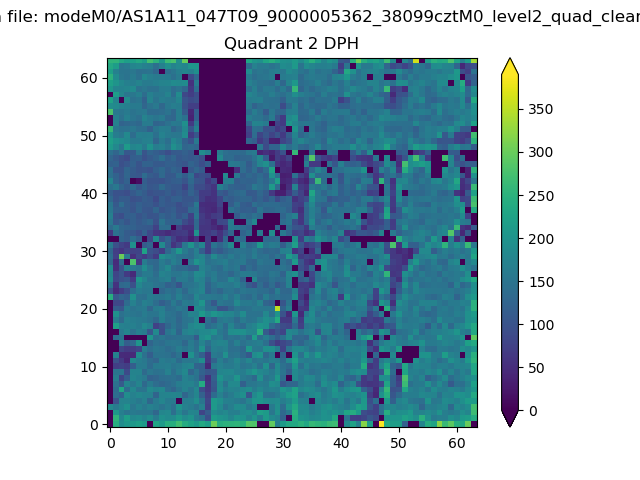
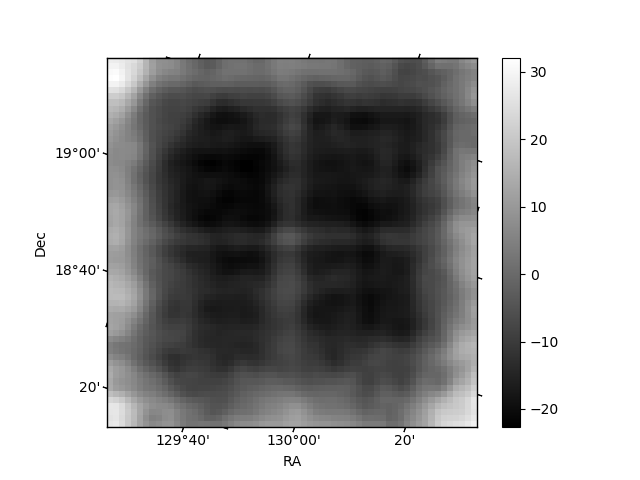
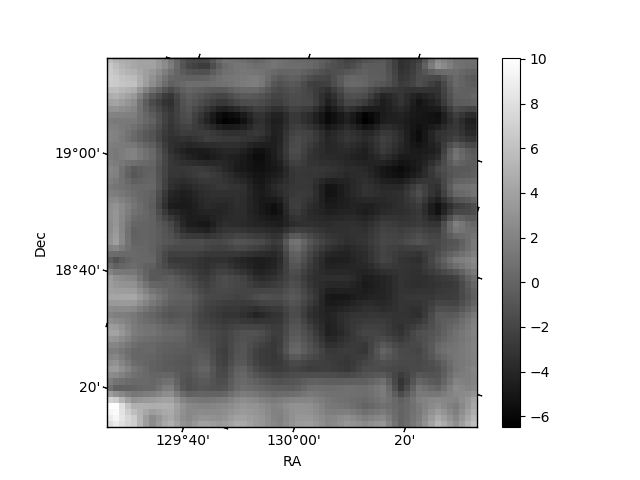
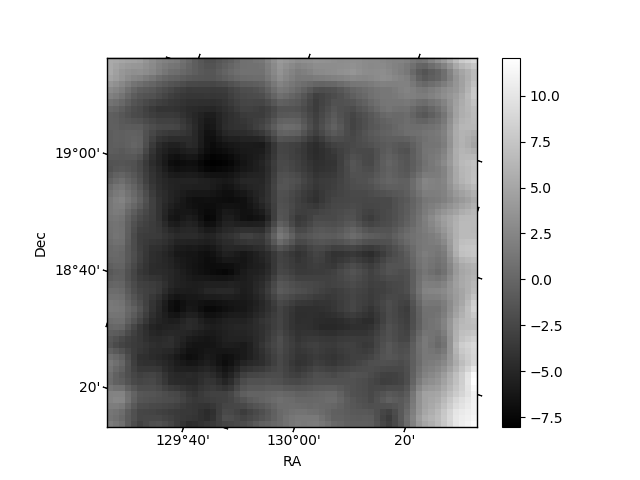
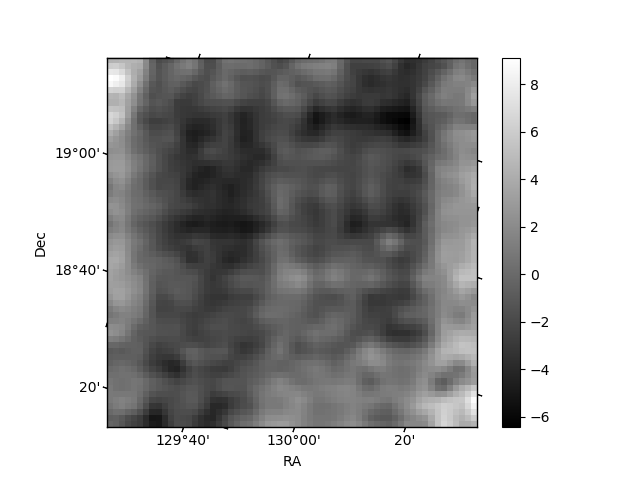
Histogram calculated using DETX and DETY for each event in the final _common_clean file
| Quadrant A | 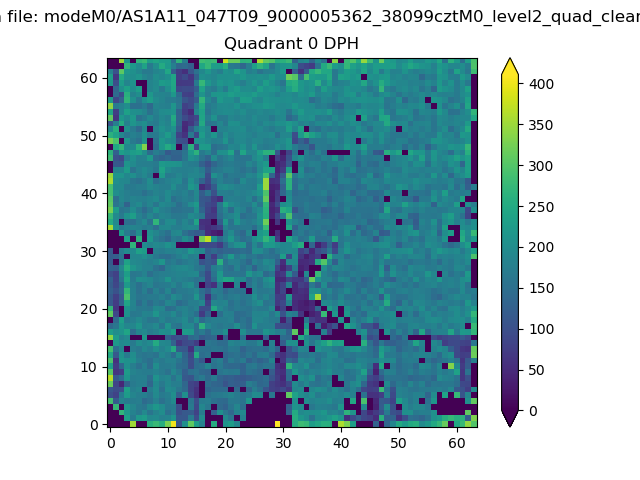 |
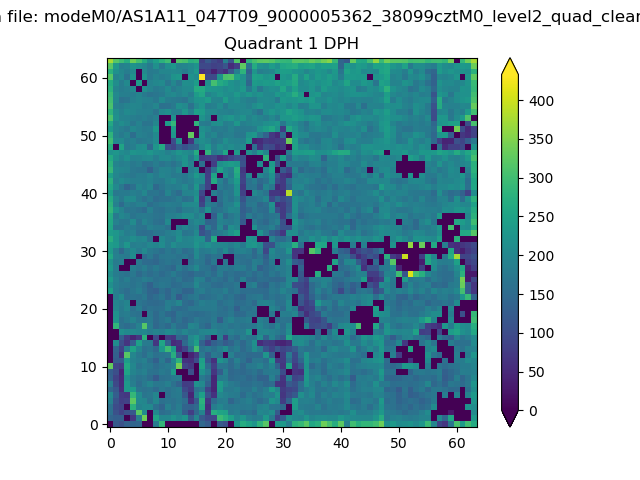 |
Quadrant B |
|---|---|---|---|
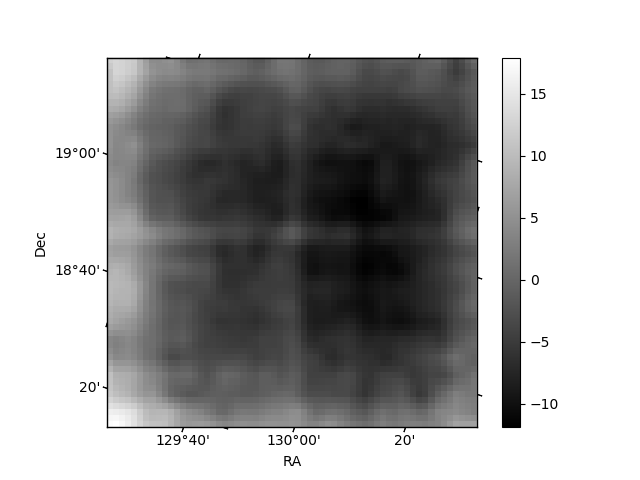
| Quadrant D | 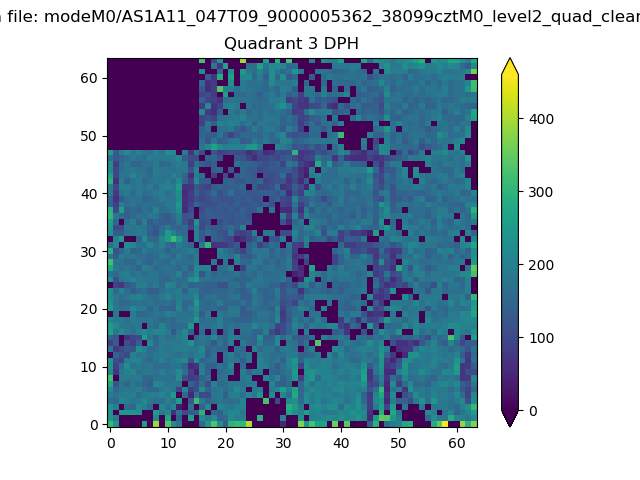 |
 |
Quadrant C |
| Plot type | Count rate plots | Images |
|---|---|---|
| Comparison with Poisson distribution Blue bars denote a histogram of data divided into 1 sec bins. Red curve is a Poisson curve with rate = median count rate of data. |
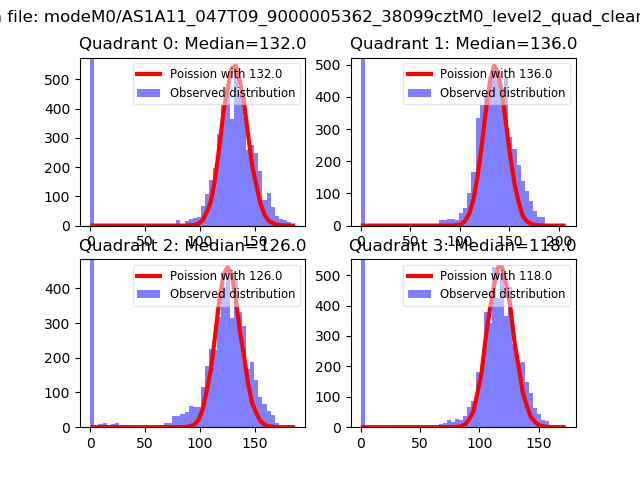 |
 |
| Quadrant-wise count rates Data is divided into 100 sec bins |
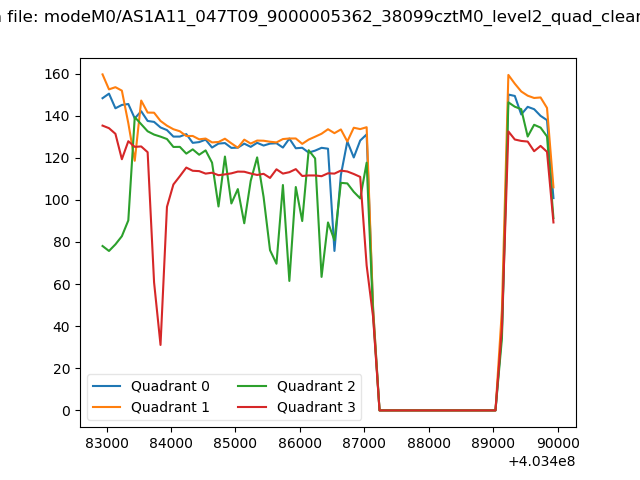 |
|
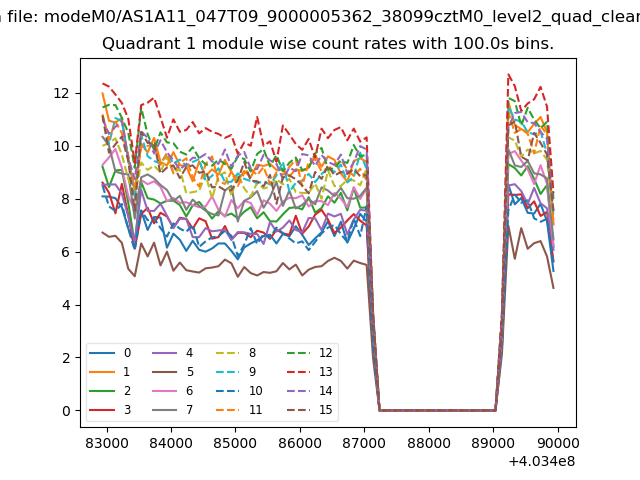
| Module-wise count rates for Quadrant A Data is divided into 100 sec bins |
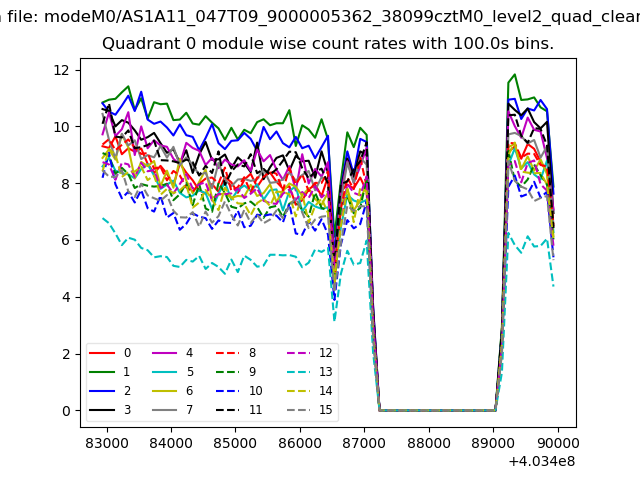 |
 |
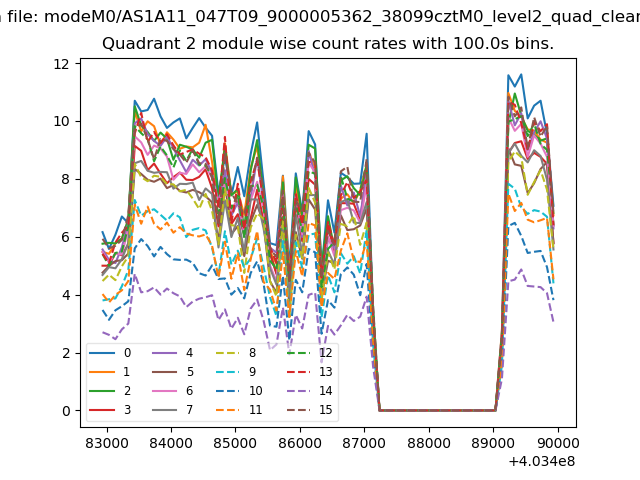
| Module-wise count rates for Quadrant B Data is divided into 100 sec bins |
 |
 |
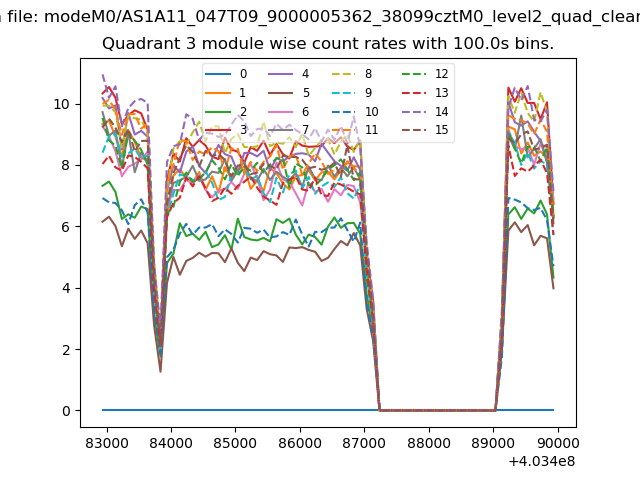
| Module-wise count rates for Quadrant C Data is divided into 100 sec bins |
 |
 |
| Module-wise count rates for Quadrant D Data is divided into 100 sec bins |
 |
 |
| Parameter | Plot |
|---|---|
| CZT HV Monitor | 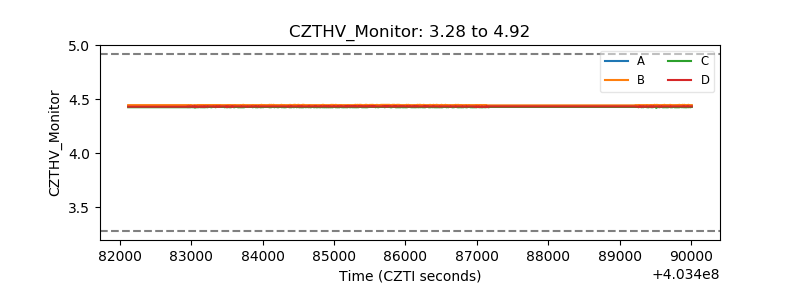 |
| D_VDD | 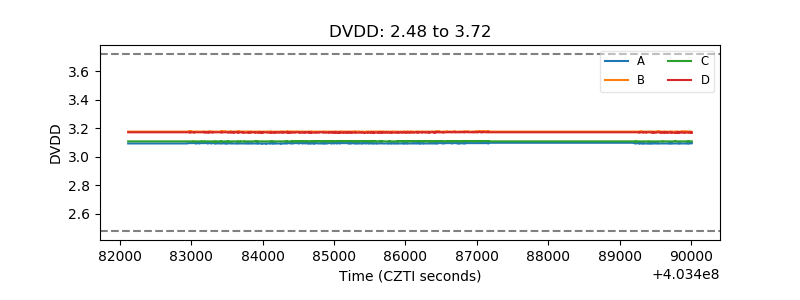 |
| Temperature 1 | 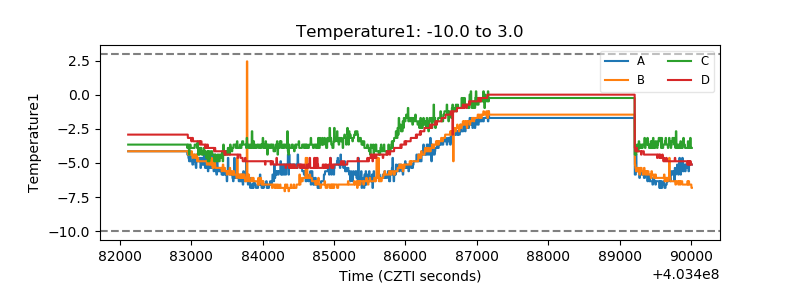 |
| Veto HV Monitor | 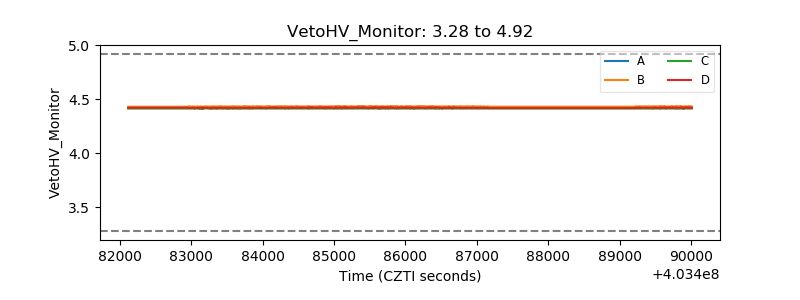 |
| Veto LLD | 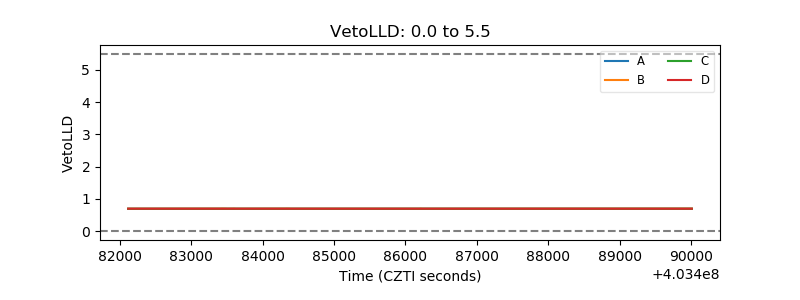 |
| Alpha Counter | 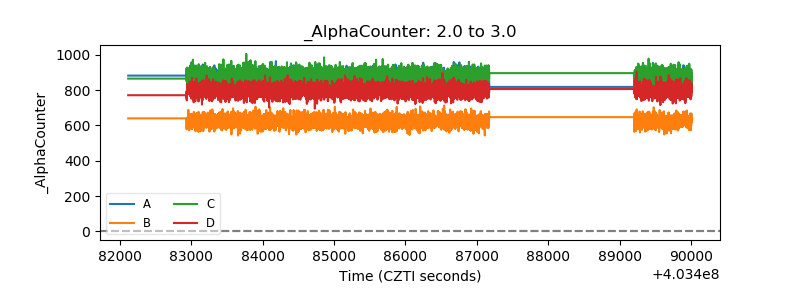 |
| _CPM_Rate | 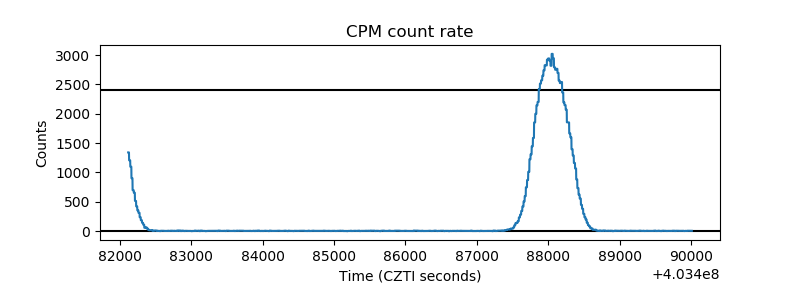 |
| CZT Counter | 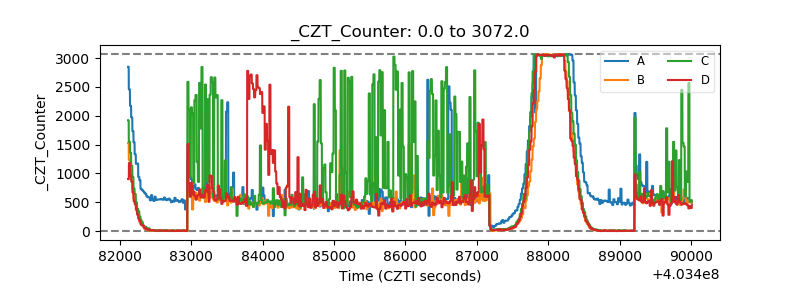 |
| +2.5 Volts monitor | 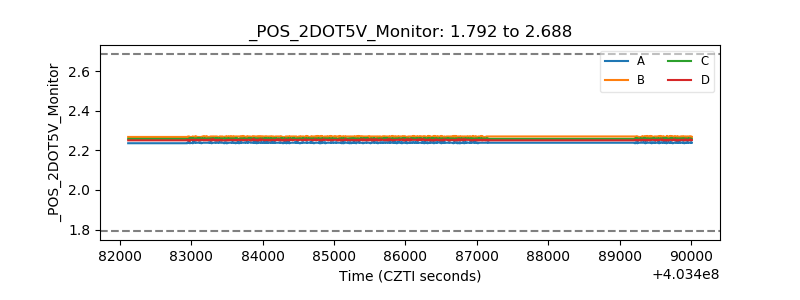 |
| +5 Volts monitor | 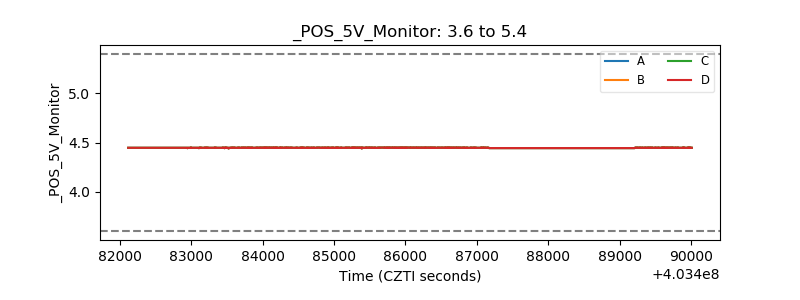 |
| _ROLL_ROT | 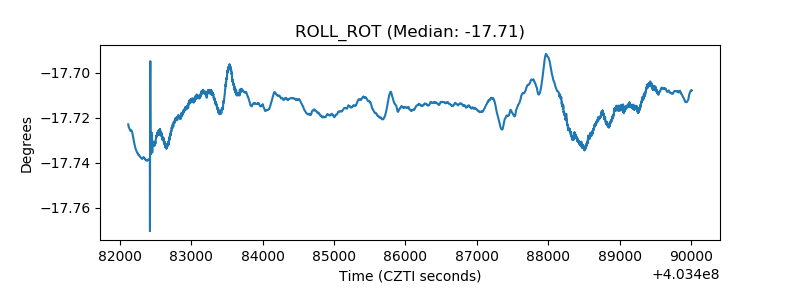 |
| _Roll_DEC | 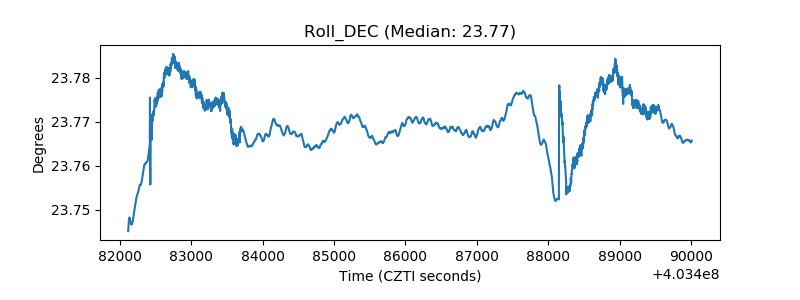 |
| _Roll_RA | 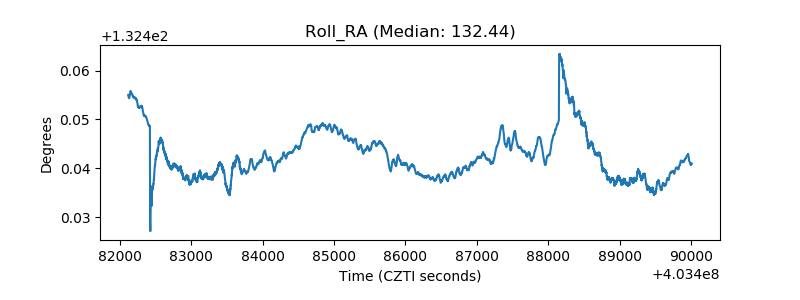 |
| Veto Counter | 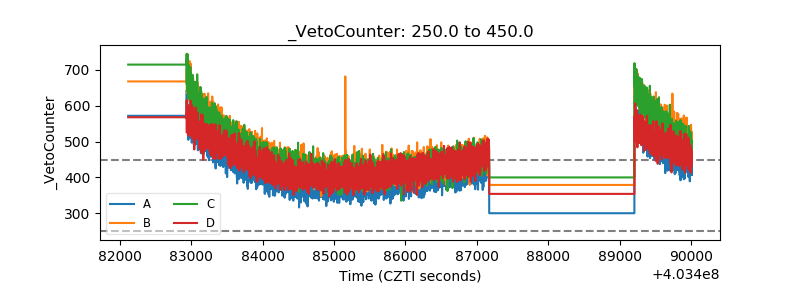 |