| Param | Original file | Final file |
|---|---|---|
| Filename | modeM0/AS1A11_047T09_9000005362_38100cztM0_level2.fits | modeM0/AS1A11_047T09_9000005362_38100cztM0_level2_quad_clean.evt |
| Size (bytes) | 341,726,400 | 92,566,080 |
| Size | 325.9 MB | 88.3 MB |
| Events in quadrant A | 2,775,324 | 645,160 |
| Events in quadrant B | 2,573,712 | 667,851 |
| Events in quadrant C | 4,463,098 | 574,341 |
| Events in quadrant D | 2,454,516 | 570,594 |
| Mode M0 | |||
|---|---|---|---|
| Quadrant | BADHDUFLAG | Total packets | Discarded packets |
| A | 0 | 11155 | 3 |
| B | 0 | 10596 | 2 |
| C | 0 | 16409 | 2 |
| D | 0 | 10529 | 2 |
| Mode SS | |||
|---|---|---|---|
| Quadrant | BADHDUFLAG | Total packets | Discarded packets |
| A | 0 | 102 | 0 |
| B | 0 | 102 | 0 |
| C | 0 | 102 | 0 |
| D | 0 | 102 | 0 |
| Mode M9 | |||
|---|---|---|---|
| Quadrant | BADHDUFLAG | Total packets | Discarded packets |
| A | 0 | 32 | 0 |
| B | 0 | 32 | 0 |
| C | 0 | 32 | 0 |
| D | 0 | 33 | 0 |
| Quadrant | Total seconds | Saturated seconds | Saturation percentage |
|---|---|---|---|
| A | 4915 | 28 | 0.569685% |
| B | 4915 | 29 | 0.590031% |
| C | 4915 | 514 | 10.457782% |
| D | 4915 | 22 | 0.447609% |
Noise dominated data is calculated using 1-second bins in cleaned event files. If a bin has >2000 counts, and if more than 50% of those come from <1% of pixels, then it is considered to be noise-dominated and hence unusable.
| Quadrant | # 1 sec bins | Bins with >0 counts | Bins with >2000 counts | High rate bins dominated by noise | Noise dominated (total time) | Noise dominated (detector-on time) | Marked lightcurve |
|---|---|---|---|---|---|---|---|
| A | 7039 | 4916 | 16 | 16 | 0.23% | 0.33% | 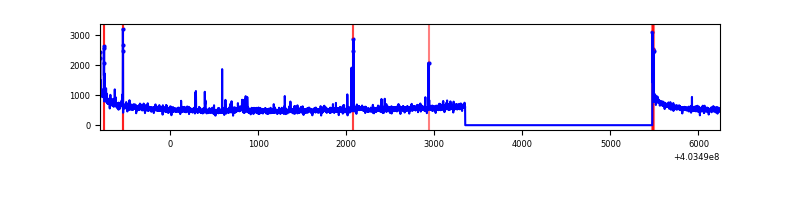 |
| B | 7039 | 4916 | 16 | 16 | 0.23% | 0.33% | 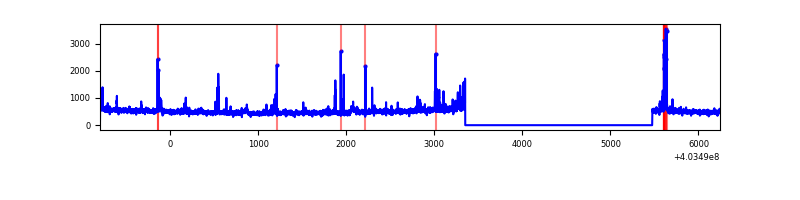 |
| C | 7038 | 4915 | 523 | 523 | 7.43% | 10.64% | 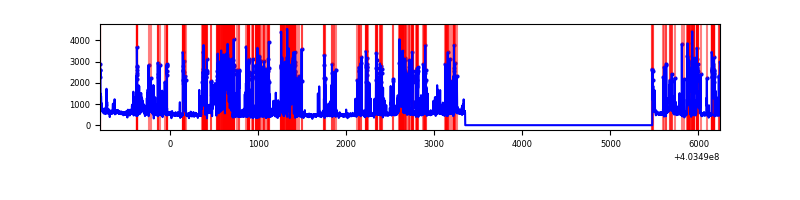 |
| D | 7039 | 4916 | 13 | 13 | 0.18% | 0.26% | 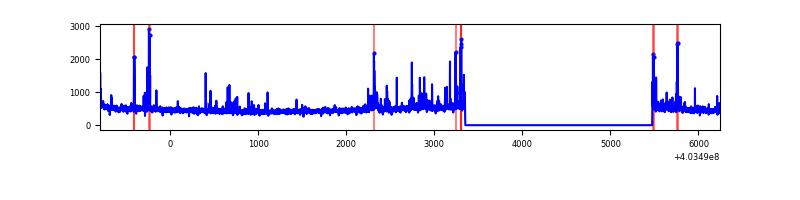 |
Top three noisy pixels from each quadrant. If the there are fewer than three noisy pixels in the level2.evt file, extra rows are filled as -1
| Pixel properties | Quadrant properties | ||||||
|---|---|---|---|---|---|---|---|
| Quadrant | DetID | PixID | Counts | Sigma | Mean | Median | Sigma |
| A | 10 | 83 | 339680 | 2821.24 | 596 | 586 | 120.2 |
| A | 0 | 247 | 48432 | 398.07 | 596 | 586 | 120.2 |
| A | 7 | 3 | 20689 | 167.25 | 596 | 586 | 120.2 |
| B | 0 | 229 | 149146 | 1308.44 | 598 | 585 | 113.5 |
| B | 5 | 172 | 30423 | 262.8 | 598 | 585 | 113.5 |
| B | 4 | 232 | 18605 | 158.71 | 598 | 585 | 113.5 |
| C | 1 | 23 | 1982353 | 15391.94 | 555 | 562 | 128.8 |
| C | 15 | 214 | 197399 | 1528.77 | 555 | 562 | 128.8 |
| C | 0 | 207 | 59182 | 455.28 | 555 | 562 | 128.8 |
| D | 13 | 249 | 43084 | 298.39 | 576 | 560 | 142.5 |
| D | 13 | 138 | 42479 | 294.15 | 576 | 560 | 142.5 |
| D | 12 | 227 | 36881 | 254.87 | 576 | 560 | 142.5 |
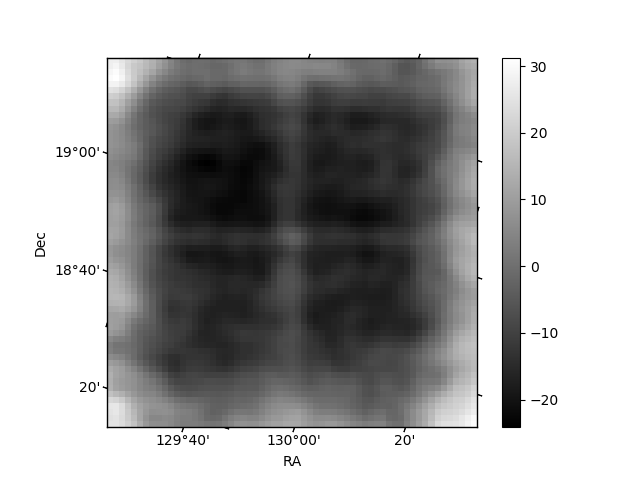
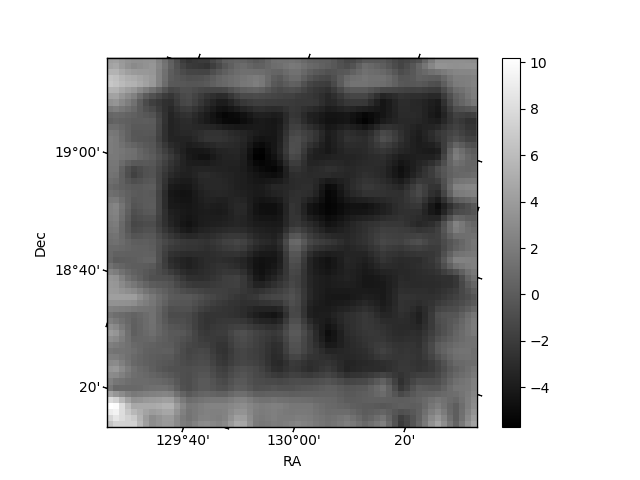
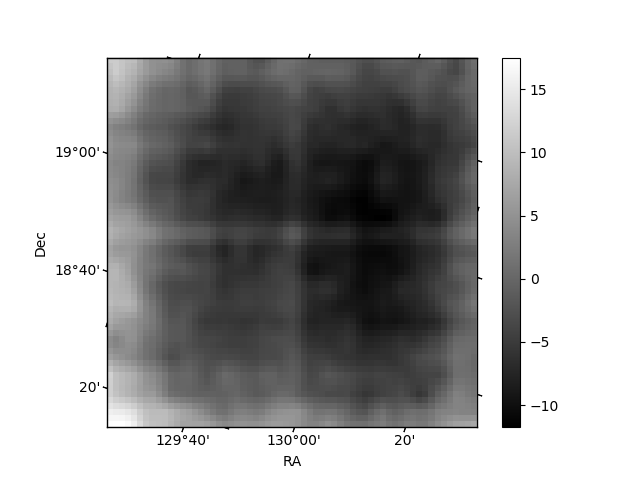
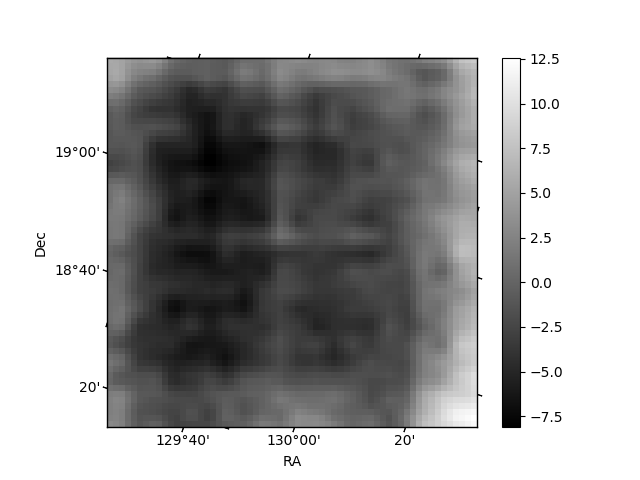
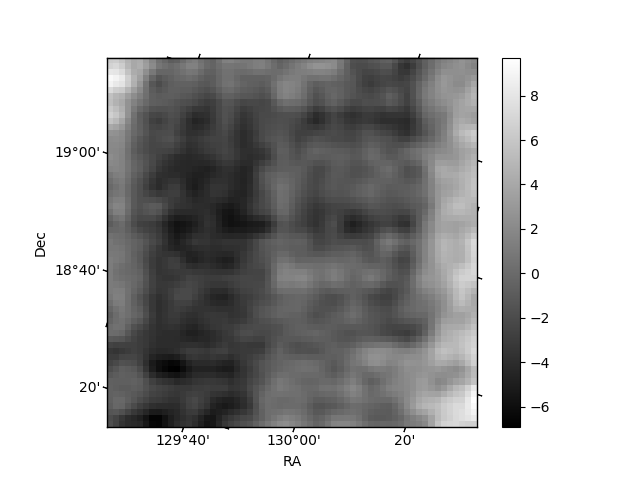
Histogram calculated using DETX and DETY for each event in the final _common_clean file
| Quadrant A | 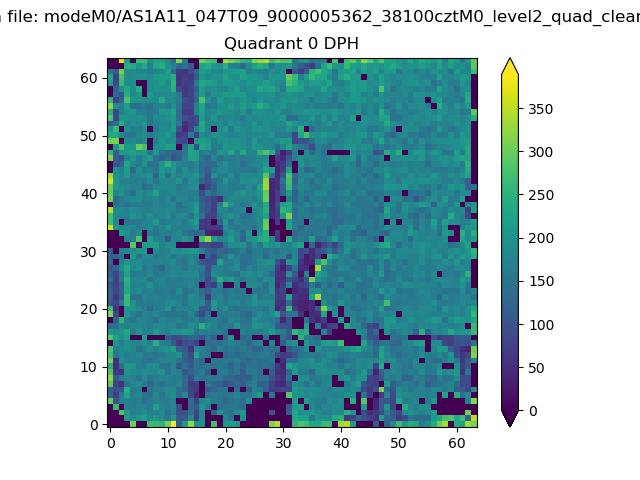 |
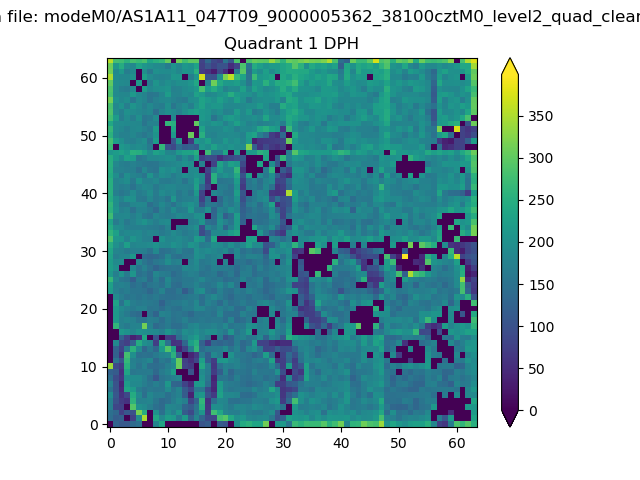 |
Quadrant B |
|---|---|---|---|
| Quadrant D | 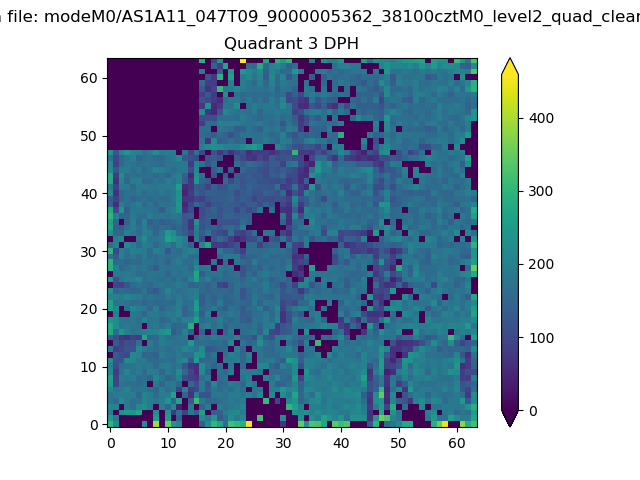 |
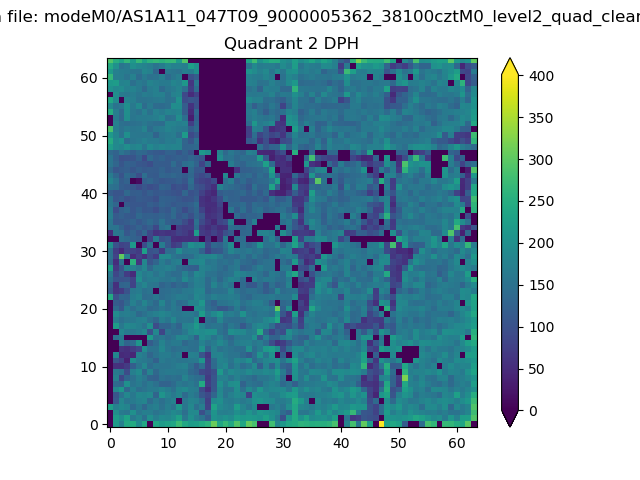 |
Quadrant C |
| Plot type | Count rate plots | Images |
|---|---|---|
| Comparison with Poisson distribution Blue bars denote a histogram of data divided into 1 sec bins. Red curve is a Poisson curve with rate = median count rate of data. |
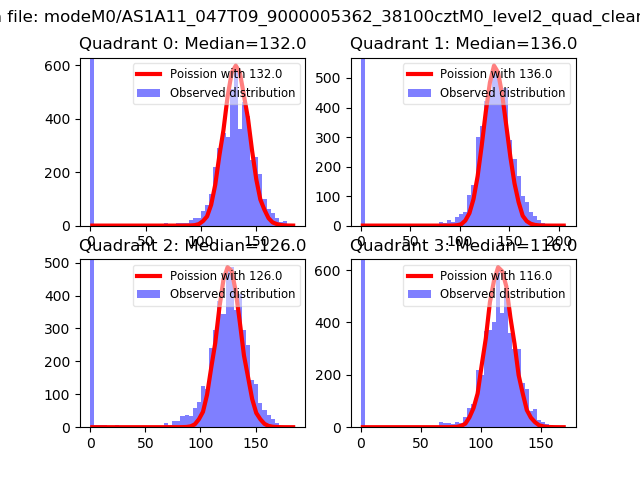 |
 |
| Quadrant-wise count rates Data is divided into 100 sec bins |
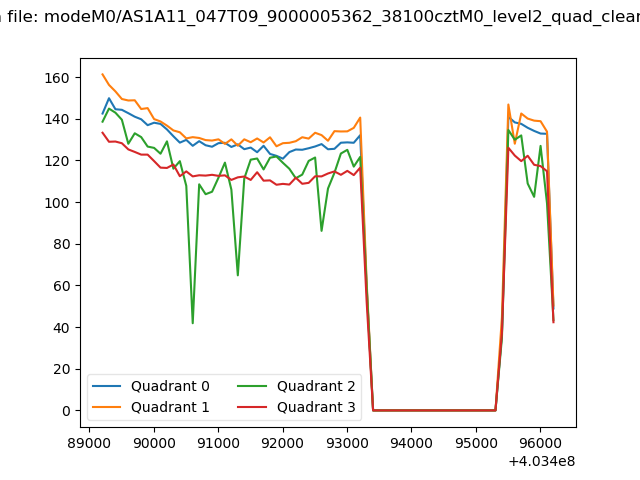 |
|
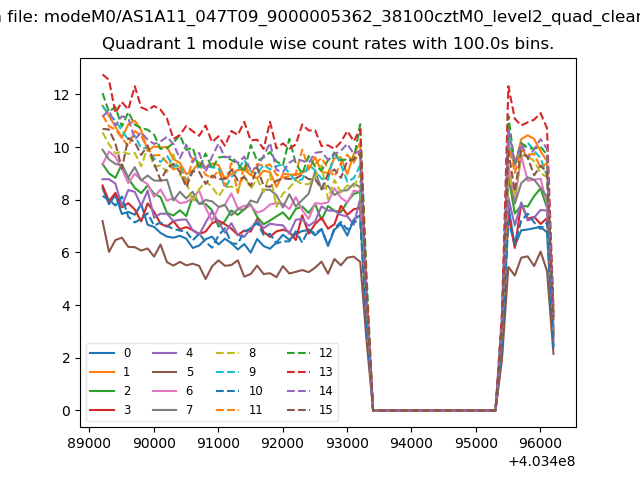
| Module-wise count rates for Quadrant A Data is divided into 100 sec bins |
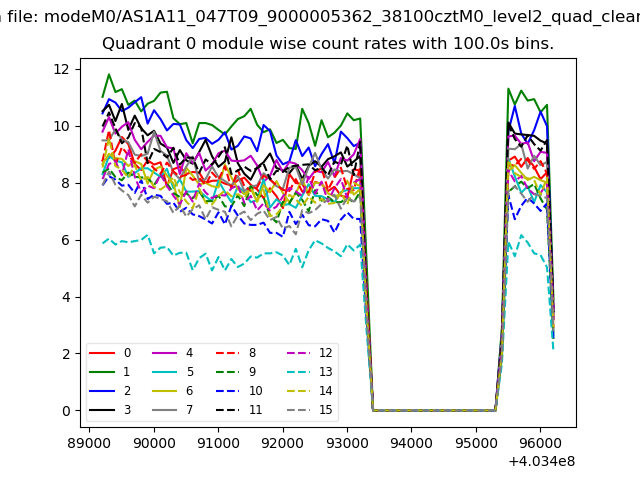 |
 |
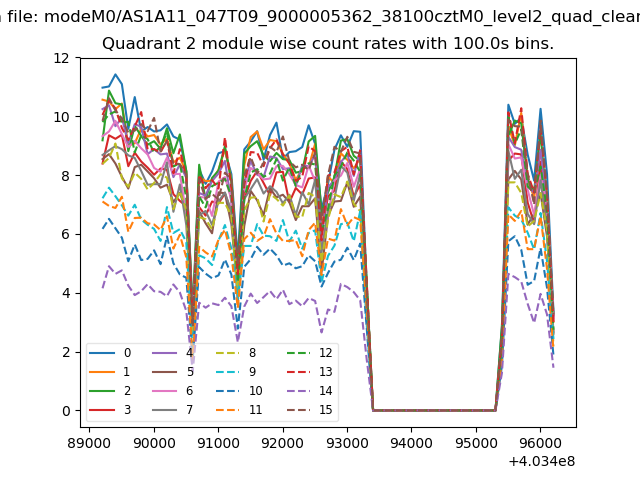
| Module-wise count rates for Quadrant B Data is divided into 100 sec bins |
 |
 |
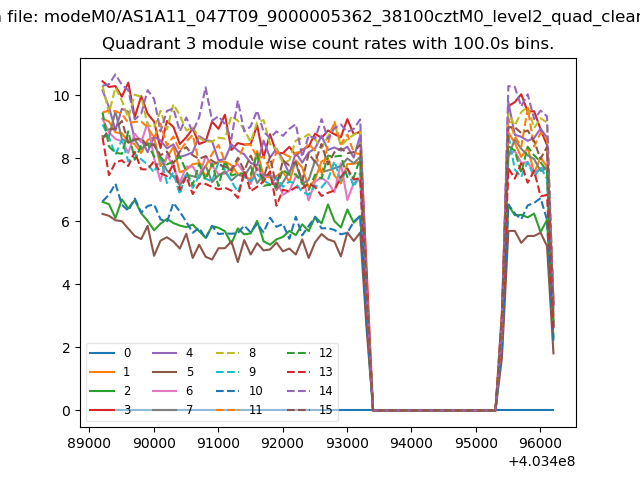
| Module-wise count rates for Quadrant C Data is divided into 100 sec bins |
 |
 |
| Module-wise count rates for Quadrant D Data is divided into 100 sec bins |
 |
 |
| Parameter | Plot |
|---|---|
| CZT HV Monitor | 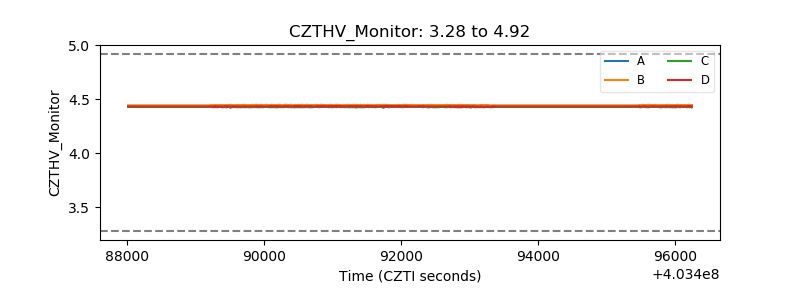 |
| D_VDD | 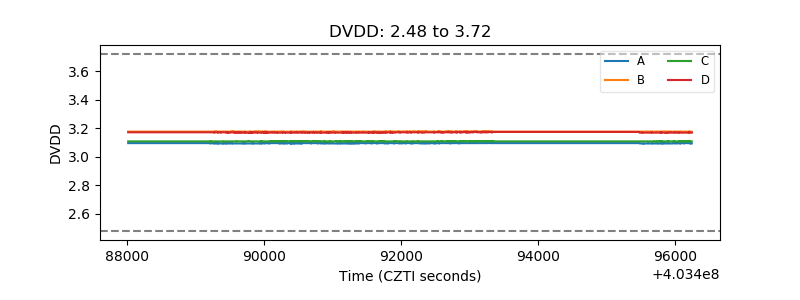 |
| Temperature 1 | 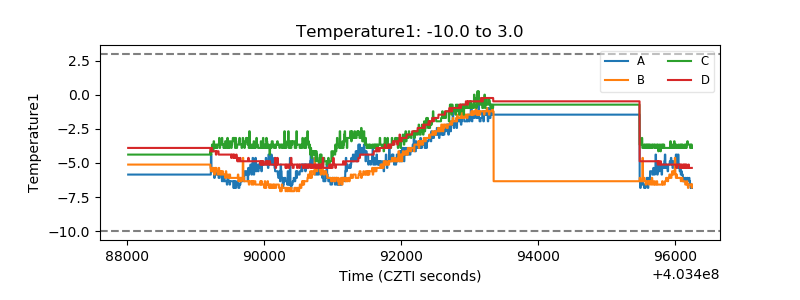 |
| Veto HV Monitor |  |
| Veto LLD | 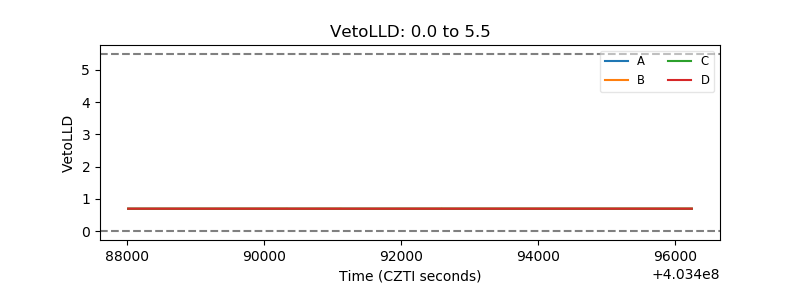 |
| Alpha Counter | 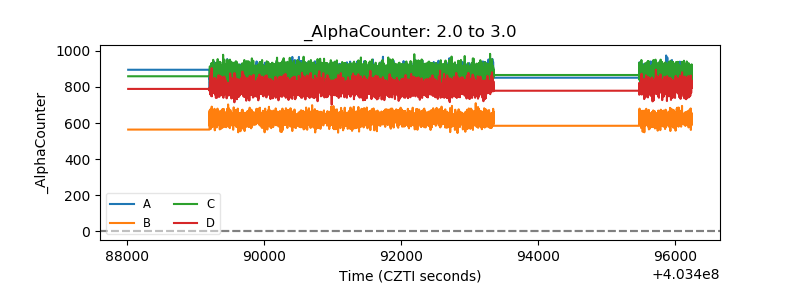 |
| _CPM_Rate | 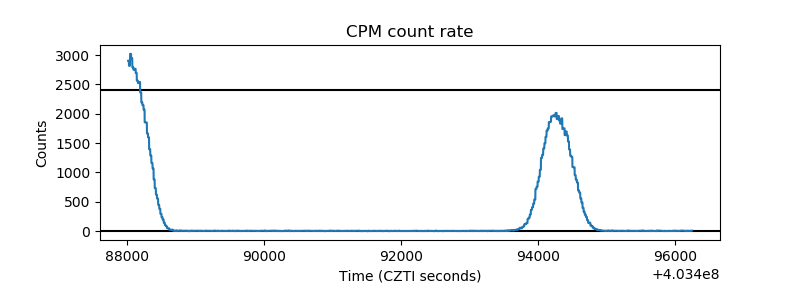 |
| CZT Counter | 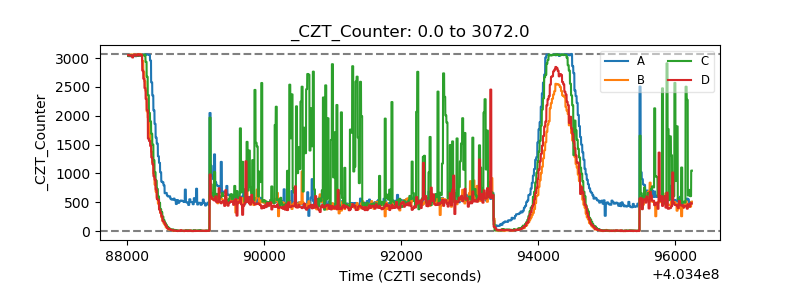 |
| +2.5 Volts monitor | 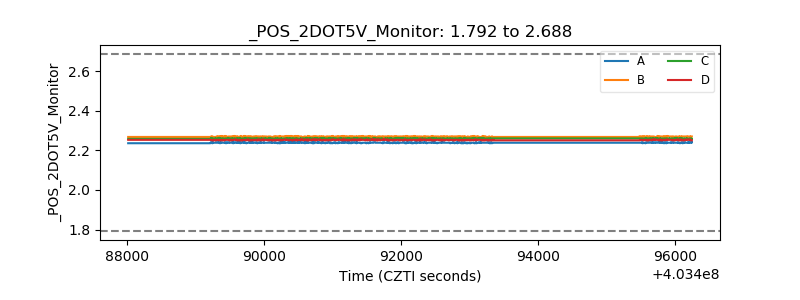 |
| +5 Volts monitor | 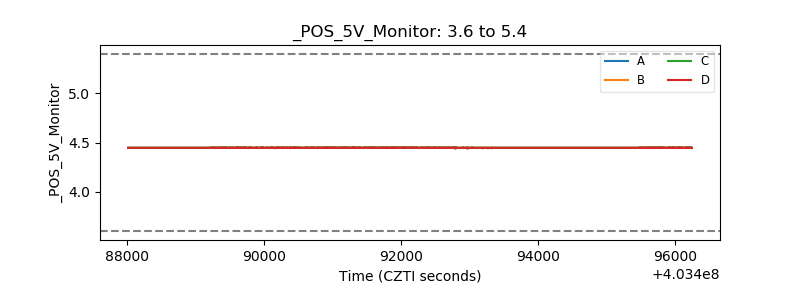 |
| _ROLL_ROT | 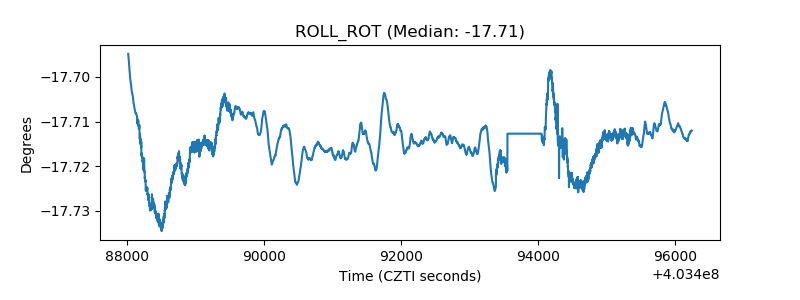 |
| _Roll_DEC | 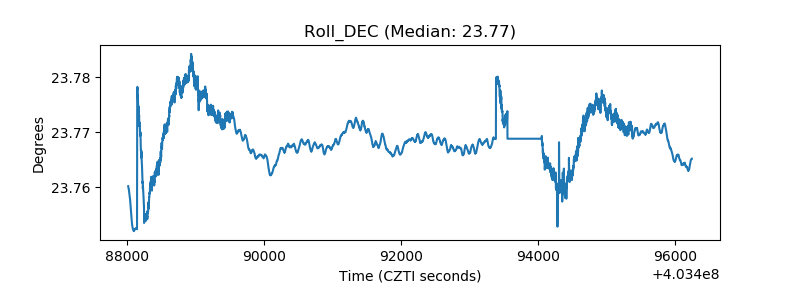 |
| _Roll_RA | 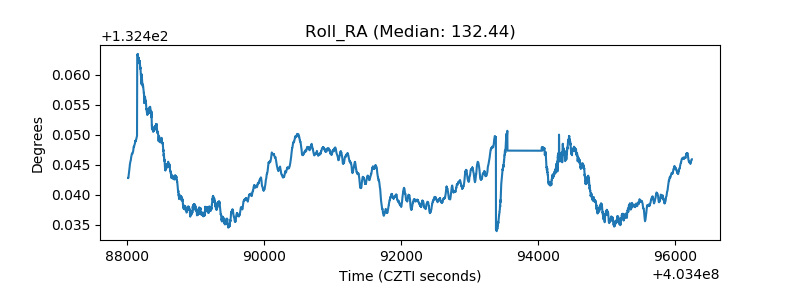 |
| Veto Counter | 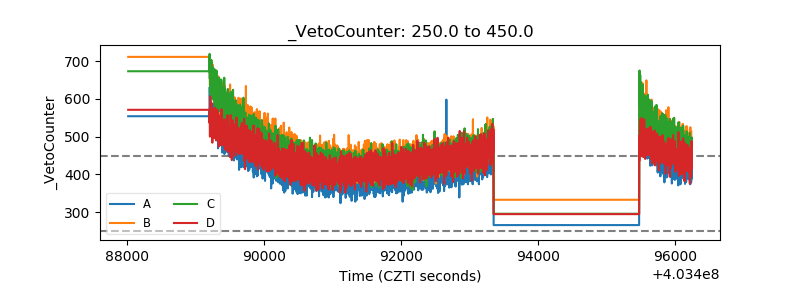 |