| Param | Original file | Final file |
|---|---|---|
| Filename | modeM0/AS1A11_047T09_9000005362_38101cztM0_level2.fits | modeM0/AS1A11_047T09_9000005362_38101cztM0_level2_quad_clean.evt |
| Size (bytes) | 331,778,880 | 96,117,120 |
| Size | 316.4 MB | 91.7 MB |
| Events in quadrant A | 2,814,104 | 662,520 |
| Events in quadrant B | 2,663,502 | 680,386 |
| Events in quadrant C | 3,708,530 | 610,699 |
| Events in quadrant D | 2,684,450 | 587,675 |
| Mode M0 | |||
|---|---|---|---|
| Quadrant | BADHDUFLAG | Total packets | Discarded packets |
| A | 0 | 11550 | 3 |
| B | 0 | 11371 | 2 |
| C | 0 | 14259 | 2 |
| D | 0 | 11560 | 2 |
| Mode SS | |||
|---|---|---|---|
| Quadrant | BADHDUFLAG | Total packets | Discarded packets |
| A | 0 | 108 | 0 |
| B | 0 | 108 | 0 |
| C | 0 | 108 | 0 |
| D | 0 | 108 | 0 |
| Mode M9 | |||
|---|---|---|---|
| Quadrant | BADHDUFLAG | Total packets | Discarded packets |
| A | 0 | 34 | 0 |
| B | 0 | 34 | 0 |
| C | 0 | 34 | 0 |
| D | 0 | 35 | 0 |
| Quadrant | Total seconds | Saturated seconds | Saturation percentage |
|---|---|---|---|
| A | 5272 | 18 | 0.341426% |
| B | 5272 | 32 | 0.606980% |
| C | 5272 | 291 | 5.519727% |
| D | 5272 | 19 | 0.360395% |
Noise dominated data is calculated using 1-second bins in cleaned event files. If a bin has >2000 counts, and if more than 50% of those come from <1% of pixels, then it is considered to be noise-dominated and hence unusable.
| Quadrant | # 1 sec bins | Bins with >0 counts | Bins with >2000 counts | High rate bins dominated by noise | Noise dominated (total time) | Noise dominated (detector-on time) | Marked lightcurve |
|---|---|---|---|---|---|---|---|
| A | 7395 | 5273 | 7 | 7 | 0.09% | 0.13% | 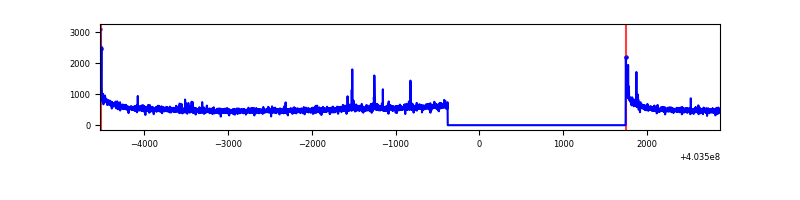 |
| B | 7395 | 5273 | 16 | 16 | 0.22% | 0.30% | 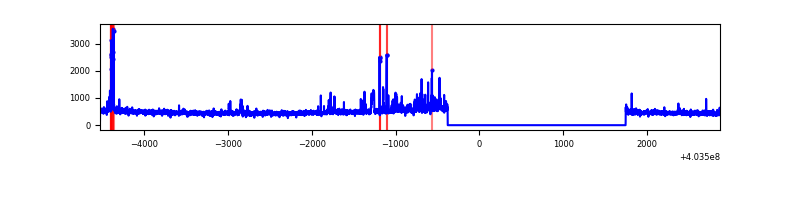 |
| C | 7395 | 5273 | 286 | 286 | 3.87% | 5.42% | 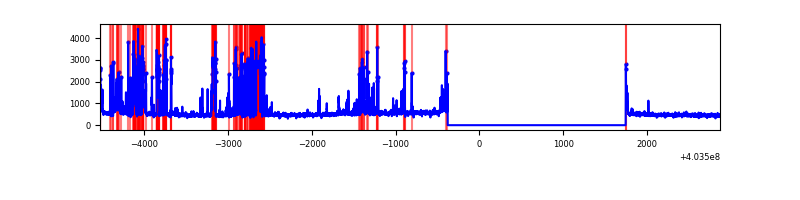 |
| D | 7395 | 5273 | 16 | 16 | 0.22% | 0.30% | 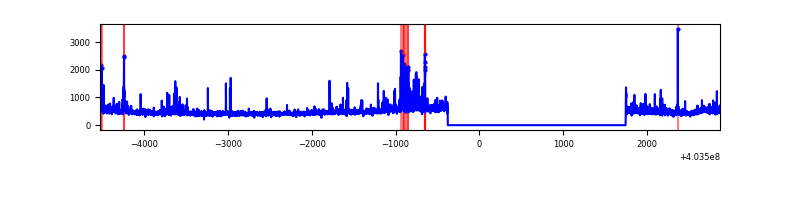 |
Top three noisy pixels from each quadrant. If the there are fewer than three noisy pixels in the level2.evt file, extra rows are filled as -1
| Pixel properties | Quadrant properties | ||||||
|---|---|---|---|---|---|---|---|
| Quadrant | DetID | PixID | Counts | Sigma | Mean | Median | Sigma |
| A | 10 | 83 | 350234 | 2792.7 | 618 | 607 | 125.2 |
| A | 9 | 143 | 20535 | 159.18 | 618 | 607 | 125.2 |
| A | 12 | 16 | 15843 | 121.7 | 618 | 607 | 125.2 |
| B | 0 | 229 | 182198 | 1518.94 | 620 | 605 | 119.6 |
| B | 12 | 111 | 14131 | 113.14 | 620 | 605 | 119.6 |
| B | 11 | 111 | 12943 | 103.2 | 620 | 605 | 119.6 |
| C | 1 | 23 | 1068640 | 7860.51 | 585 | 591 | 135.9 |
| C | 15 | 214 | 214375 | 1573.38 | 585 | 591 | 135.9 |
| C | 5 | 250 | 58072 | 423.04 | 585 | 591 | 135.9 |
| D | 13 | 138 | 146674 | 1005.45 | 598 | 584 | 145.3 |
| D | 13 | 249 | 59333 | 404.33 | 598 | 584 | 145.3 |
| D | 1 | 20 | 39735 | 269.45 | 598 | 584 | 145.3 |
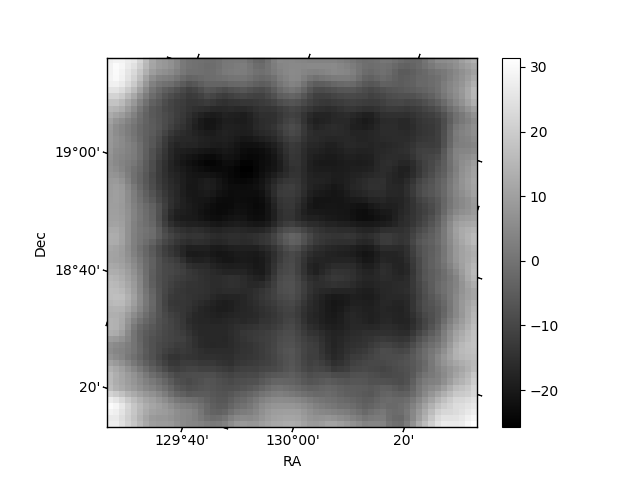
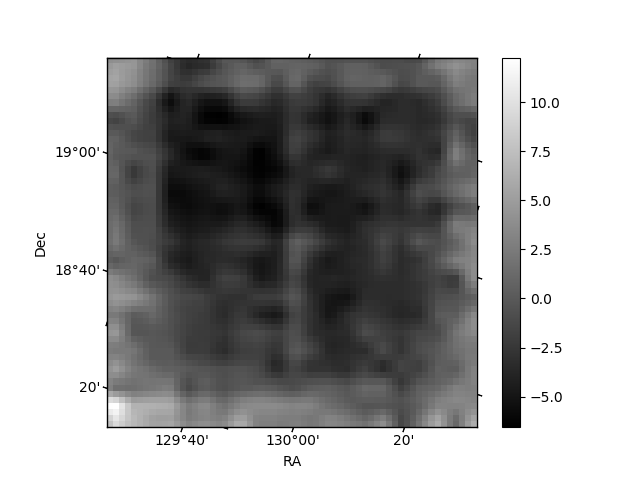
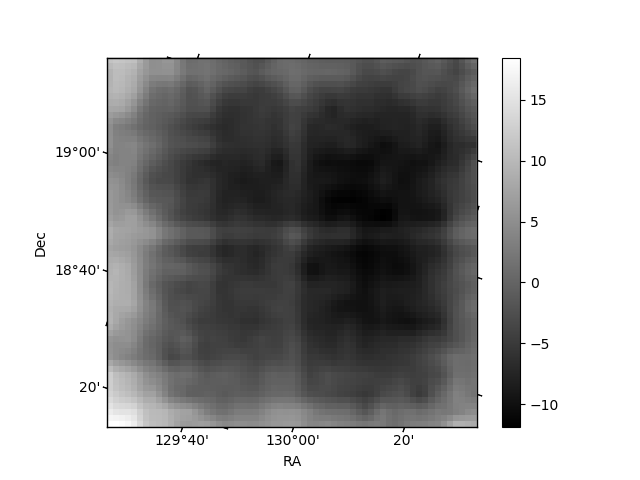
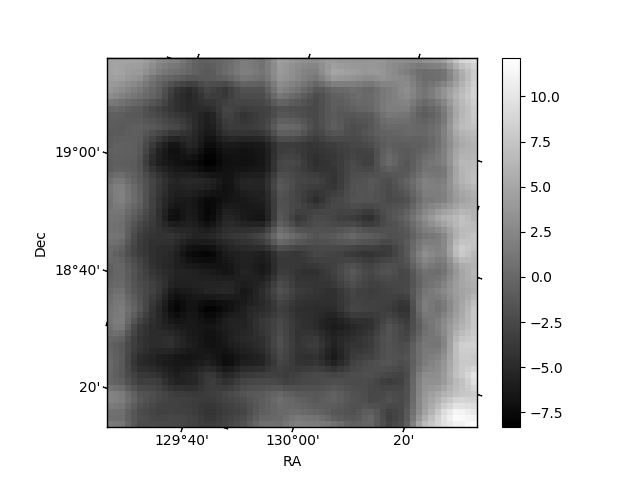
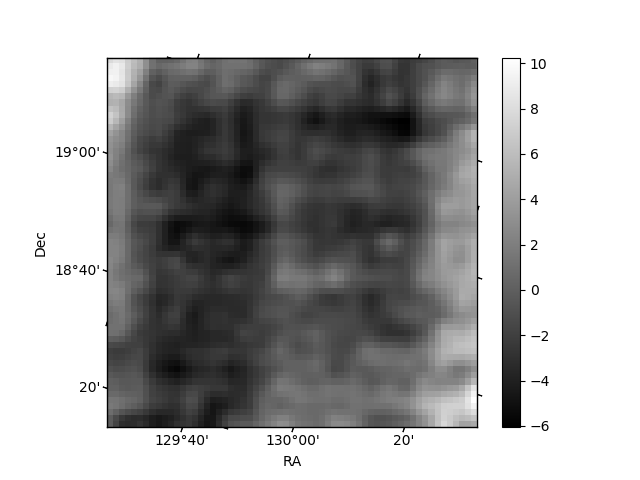
Histogram calculated using DETX and DETY for each event in the final _common_clean file
| Quadrant A | 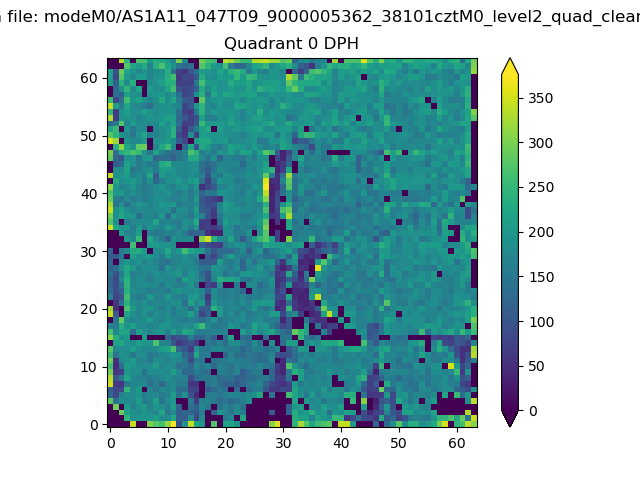 |
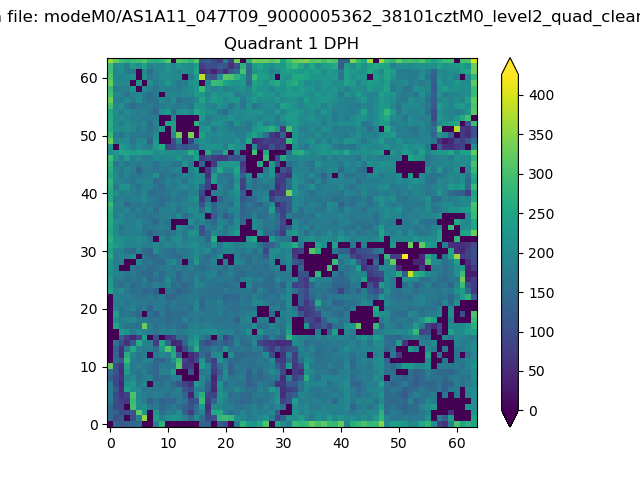 |
Quadrant B |
|---|---|---|---|
| Quadrant D | 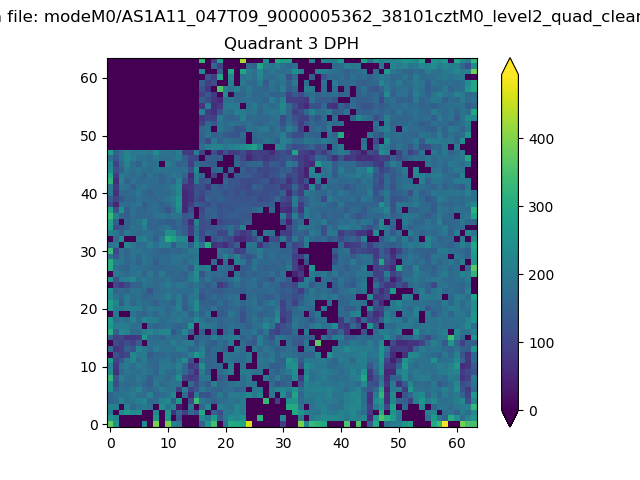 |
 |
Quadrant C |
| Plot type | Count rate plots | Images |
|---|---|---|
| Comparison with Poisson distribution Blue bars denote a histogram of data divided into 1 sec bins. Red curve is a Poisson curve with rate = median count rate of data. |
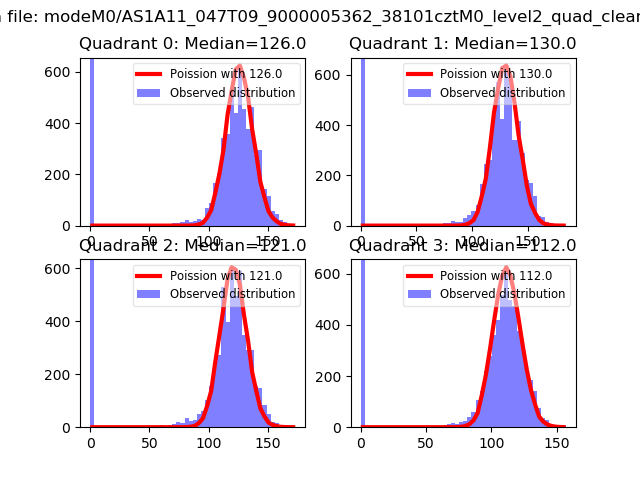 |
 |
| Quadrant-wise count rates Data is divided into 100 sec bins |
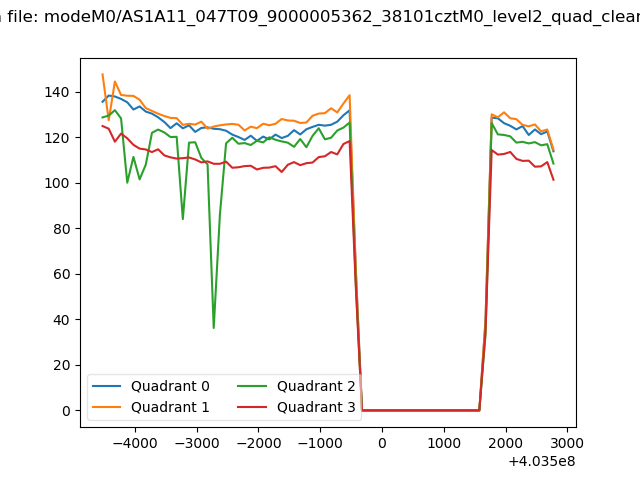 |
|
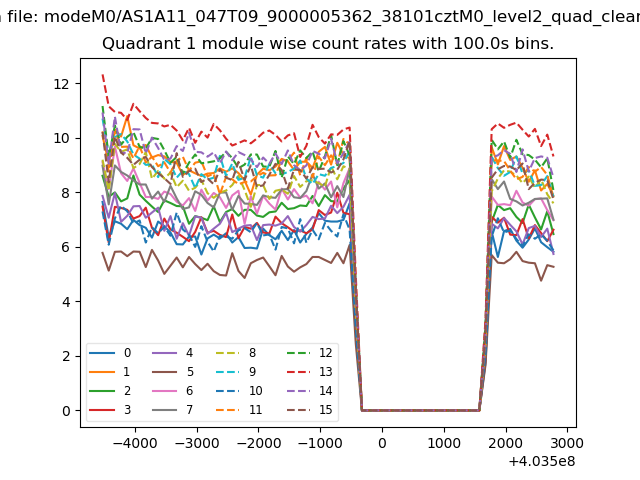
| Module-wise count rates for Quadrant A Data is divided into 100 sec bins |
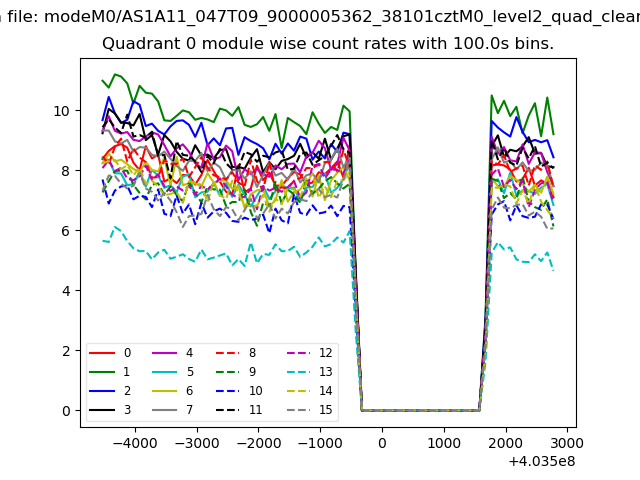 |
 |
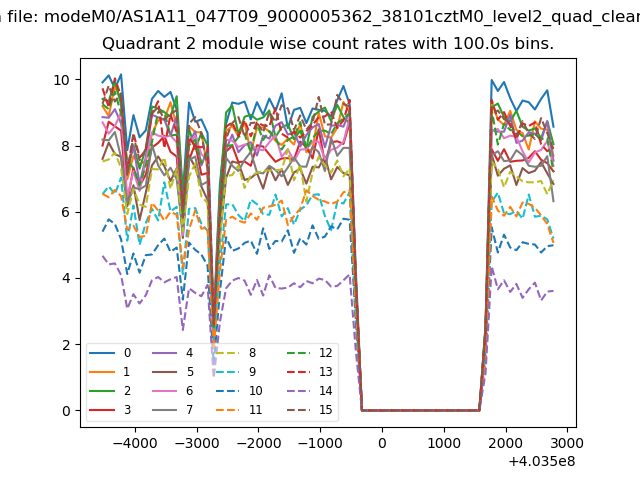
| Module-wise count rates for Quadrant B Data is divided into 100 sec bins |
 |
 |
| Module-wise count rates for Quadrant C Data is divided into 100 sec bins |
 |
 |
| Module-wise count rates for Quadrant D Data is divided into 100 sec bins |
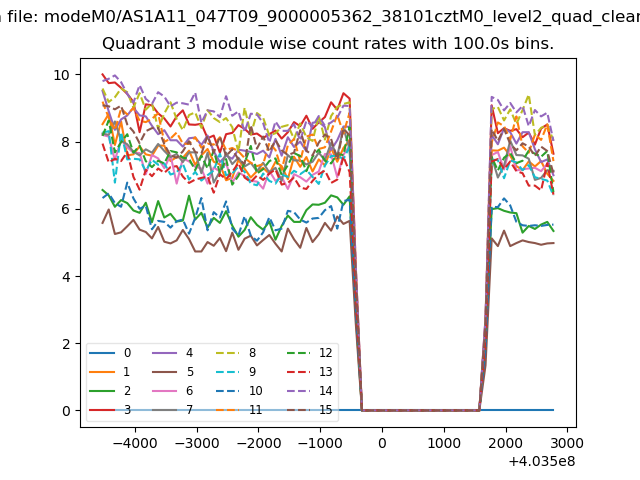 |
 |
| Parameter | Plot |
|---|---|
| CZT HV Monitor | 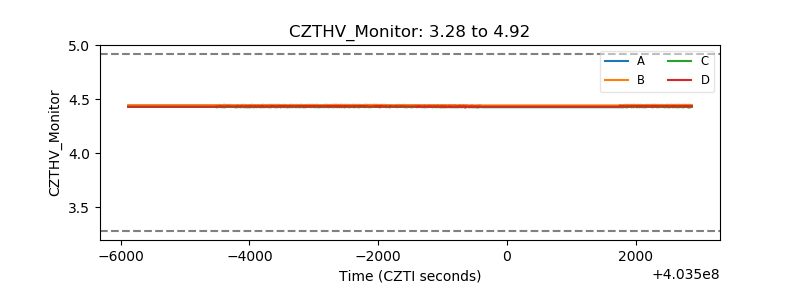 |
| D_VDD | 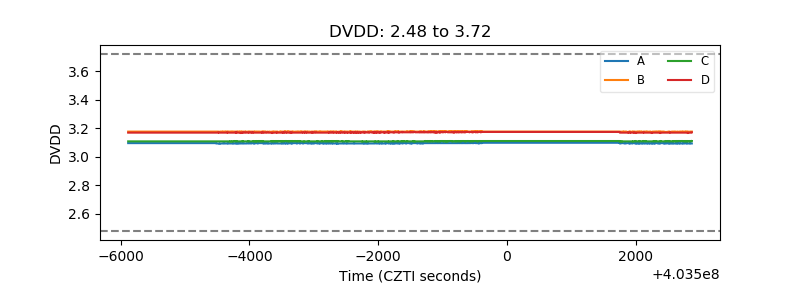 |
| Temperature 1 | 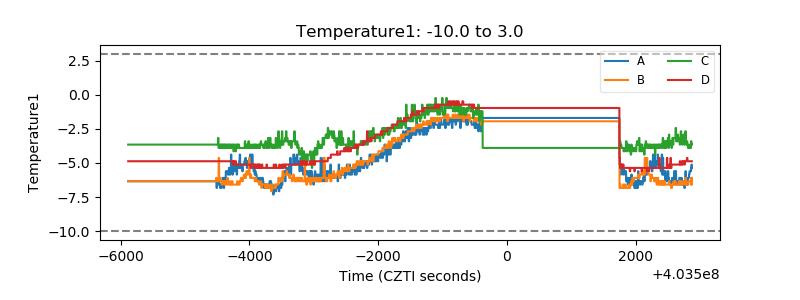 |
| Veto HV Monitor | 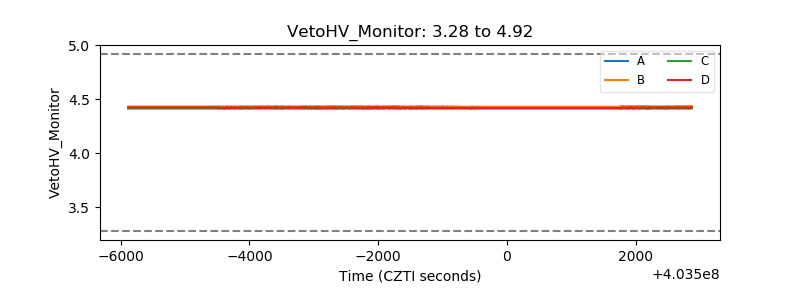 |
| Veto LLD | 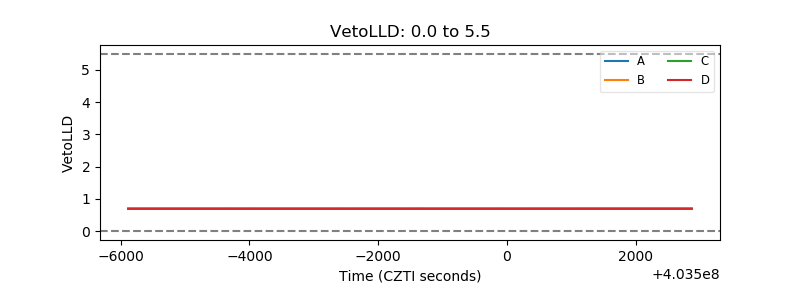 |
| Alpha Counter | 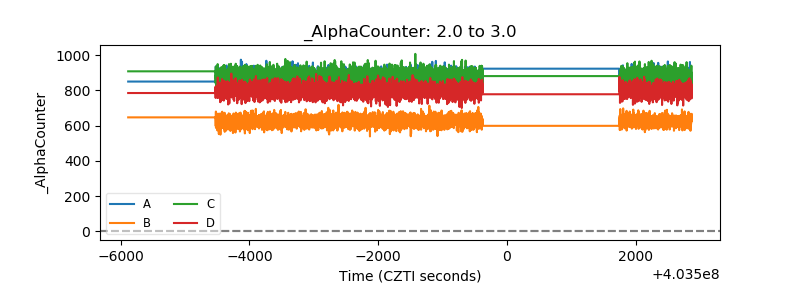 |
| _CPM_Rate | 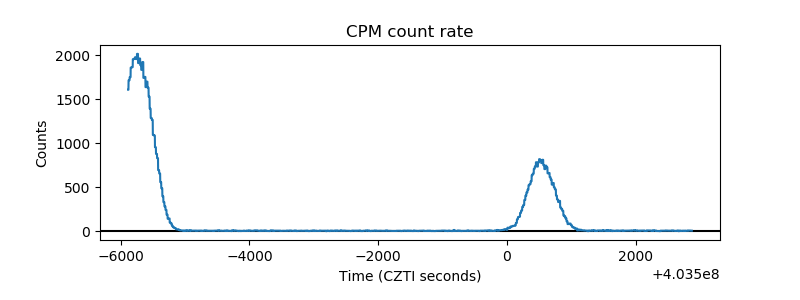 |
| CZT Counter |  |
| +2.5 Volts monitor | 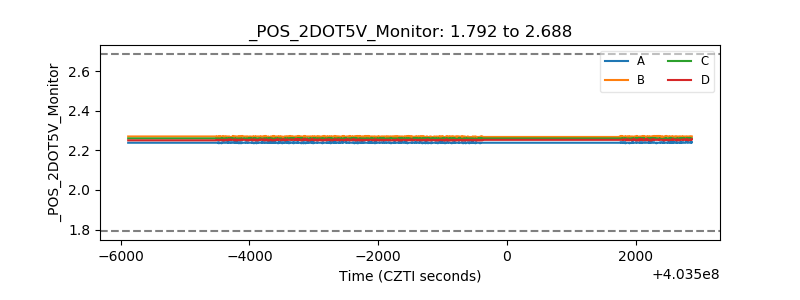 |
| +5 Volts monitor | 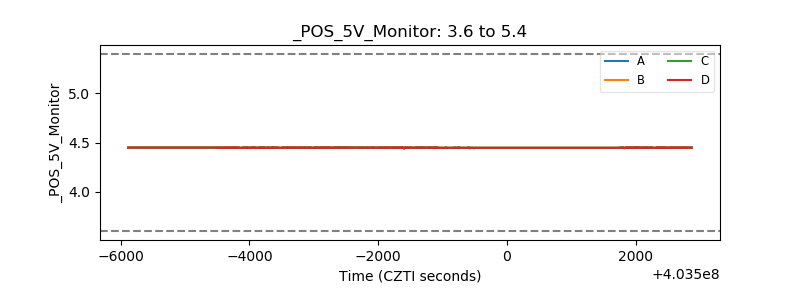 |
| _ROLL_ROT | 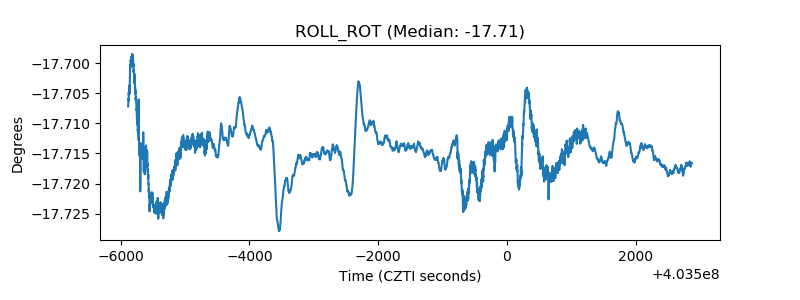 |
| _Roll_DEC |  |
| _Roll_RA | 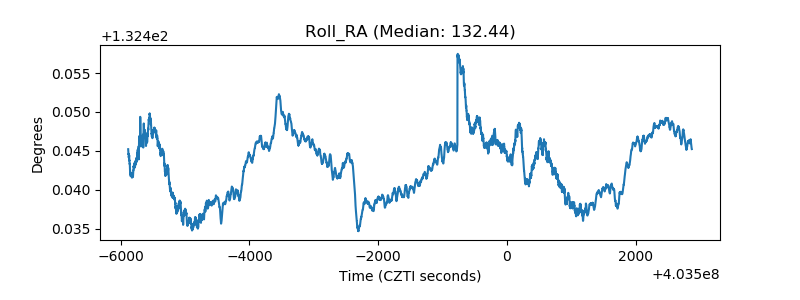 |
| Veto Counter | 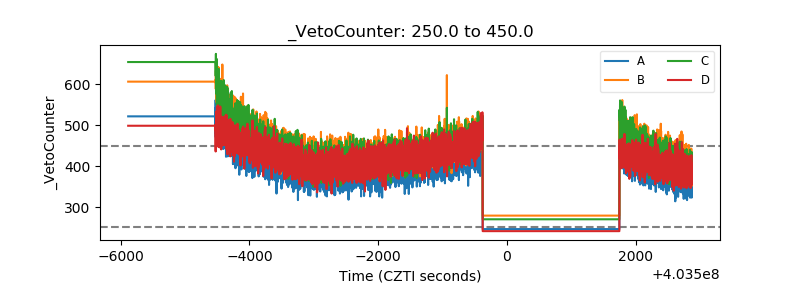 |