| Param | Original file | Final file |
|---|---|---|
| Filename | modeM0/AS1A11_047T09_9000005362_38102cztM0_level2.fits | modeM0/AS1A11_047T09_9000005362_38102cztM0_level2_quad_clean.evt |
| Size (bytes) | 328,078,080 | 89,441,280 |
| Size | 312.9 MB | 85.3 MB |
| Events in quadrant A | 2,648,207 | 612,638 |
| Events in quadrant B | 2,543,807 | 623,510 |
| Events in quadrant C | 3,416,869 | 571,430 |
| Events in quadrant D | 3,136,540 | 541,660 |
| Mode M0 | |||
|---|---|---|---|
| Quadrant | BADHDUFLAG | Total packets | Discarded packets |
| A | 0 | 10959 | 2 |
| B | 0 | 11019 | 1 |
| C | 0 | 13405 | 1 |
| D | 0 | 12749 | 1 |
| Mode SS | |||
|---|---|---|---|
| Quadrant | BADHDUFLAG | Total packets | Discarded packets |
| A | 0 | 106 | 0 |
| B | 0 | 106 | 0 |
| C | 0 | 106 | 0 |
| D | 0 | 106 | 0 |
| Mode M9 | |||
|---|---|---|---|
| Quadrant | BADHDUFLAG | Total packets | Discarded packets |
| A | 0 | 20 | 0 |
| B | 0 | 20 | 0 |
| C | 0 | 20 | 0 |
| D | 0 | 20 | 0 |
| Quadrant | Total seconds | Saturated seconds | Saturation percentage |
|---|---|---|---|
| A | 5120 | 6 | 0.117188% |
| B | 5120 | 36 | 0.703125% |
| C | 5120 | 228 | 4.453125% |
| D | 5120 | 76 | 1.484375% |
Noise dominated data is calculated using 1-second bins in cleaned event files. If a bin has >2000 counts, and if more than 50% of those come from <1% of pixels, then it is considered to be noise-dominated and hence unusable.
| Quadrant | # 1 sec bins | Bins with >0 counts | Bins with >2000 counts | High rate bins dominated by noise | Noise dominated (total time) | Noise dominated (detector-on time) | Marked lightcurve |
|---|---|---|---|---|---|---|---|
| A | 7183 | 5121 | 3 | 3 | 0.04% | 0.06% | 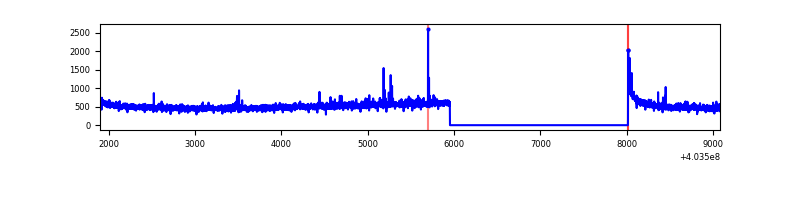 |
| B | 7183 | 5121 | 18 | 18 | 0.25% | 0.35% | 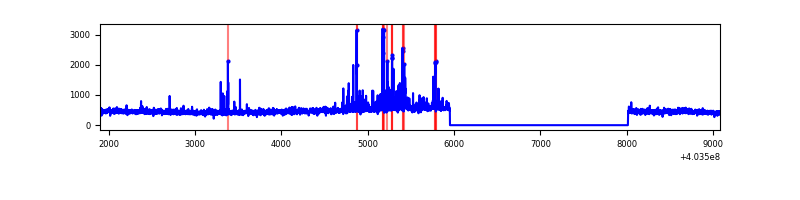 |
| C | 7183 | 5120 | 210 | 210 | 2.92% | 4.10% | 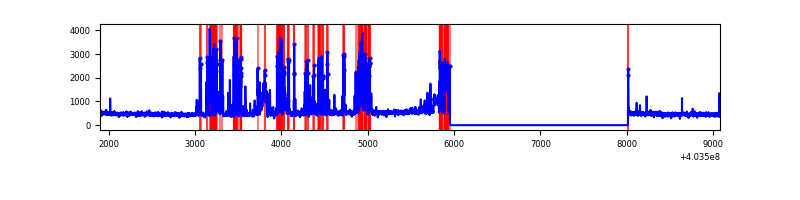 |
| D | 7183 | 5121 | 66 | 66 | 0.92% | 1.29% | 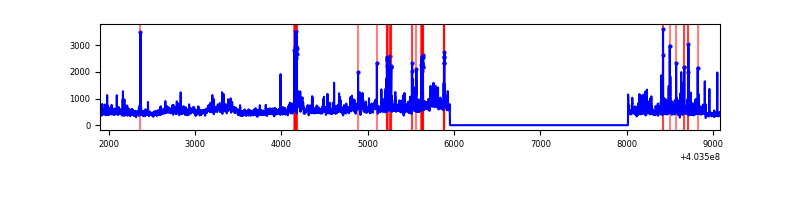 |
Top three noisy pixels from each quadrant. If the there are fewer than three noisy pixels in the level2.evt file, extra rows are filled as -1
| Pixel properties | Quadrant properties | ||||||
|---|---|---|---|---|---|---|---|
| Quadrant | DetID | PixID | Counts | Sigma | Mean | Median | Sigma |
| A | 10 | 83 | 311339 | 2584.75 | 589 | 578 | 120.2 |
| A | 9 | 143 | 18171 | 146.33 | 589 | 578 | 120.2 |
| A | 12 | 189 | 13830 | 110.22 | 589 | 578 | 120.2 |
| B | 0 | 229 | 101457 | 897.84 | 585 | 570 | 112.4 |
| B | 5 | 172 | 67761 | 597.96 | 585 | 570 | 112.4 |
| B | 0 | 189 | 14851 | 127.09 | 585 | 570 | 112.4 |
| C | 1 | 23 | 986424 | 7539.14 | 561 | 565 | 130.8 |
| C | 15 | 214 | 211613 | 1613.94 | 561 | 565 | 130.8 |
| C | 0 | 10 | 10818 | 78.41 | 561 | 565 | 130.8 |
| D | 12 | 235 | 253653 | 1835.5 | 566 | 552 | 137.9 |
| D | 13 | 249 | 188936 | 1366.17 | 566 | 552 | 137.9 |
| D | 1 | 20 | 156380 | 1130.07 | 566 | 552 | 137.9 |
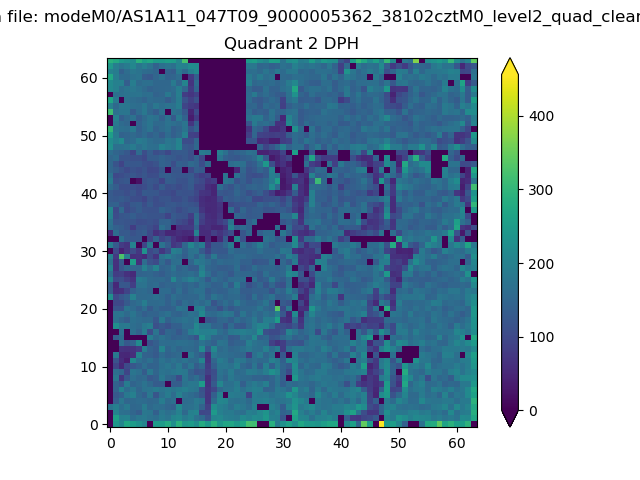
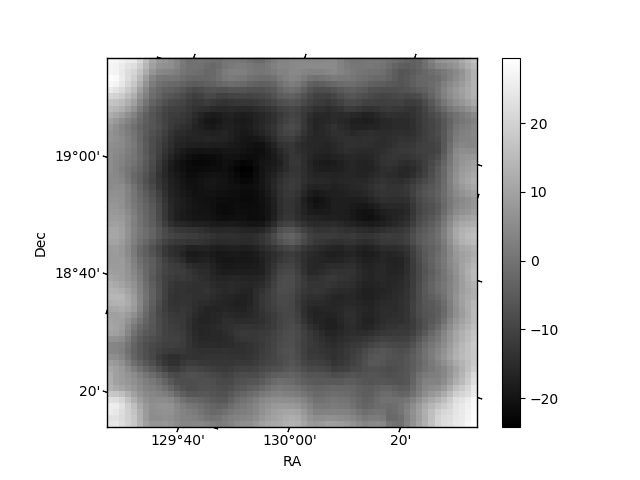
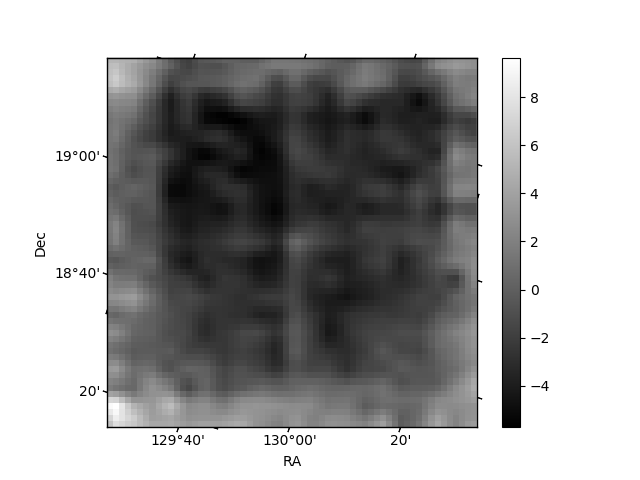
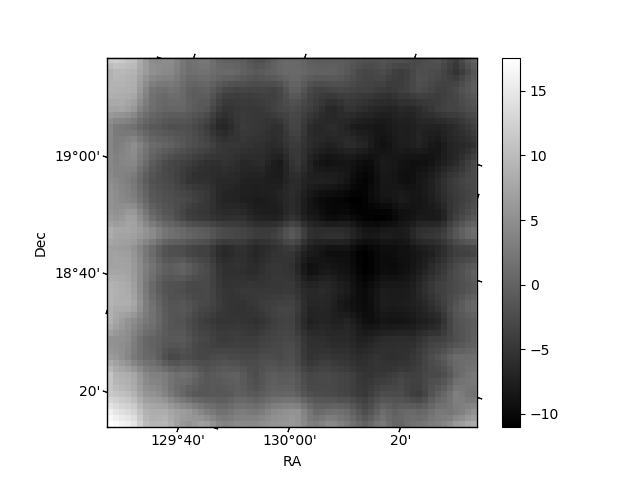
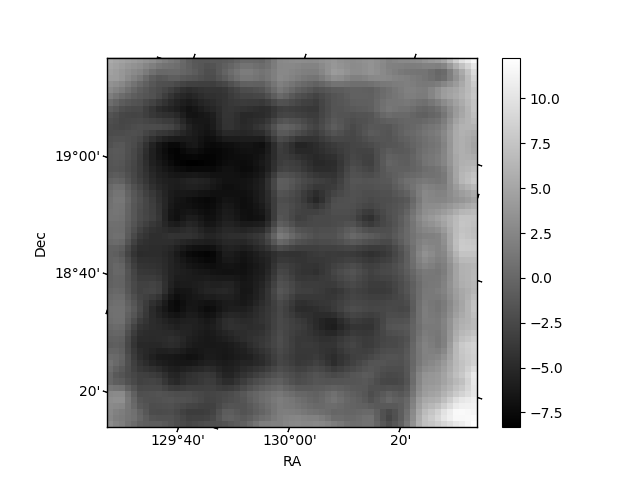
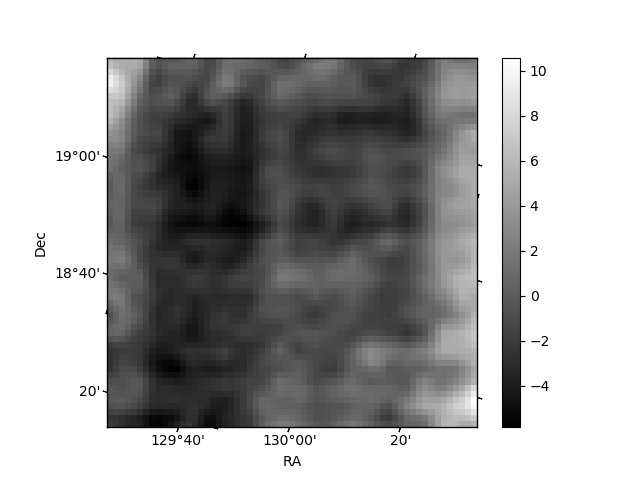
Histogram calculated using DETX and DETY for each event in the final _common_clean file
| Quadrant A | 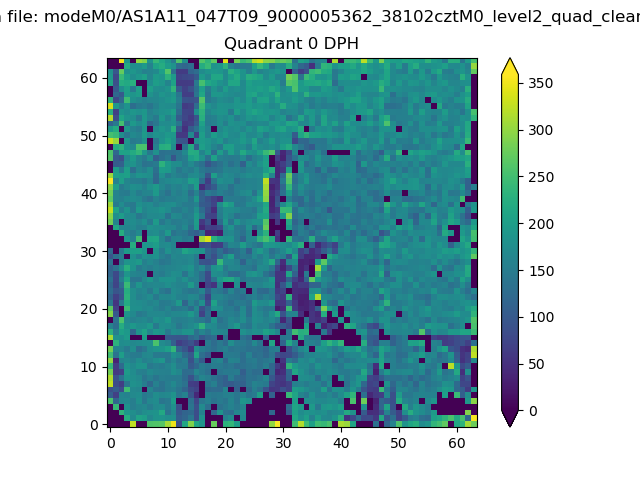 |
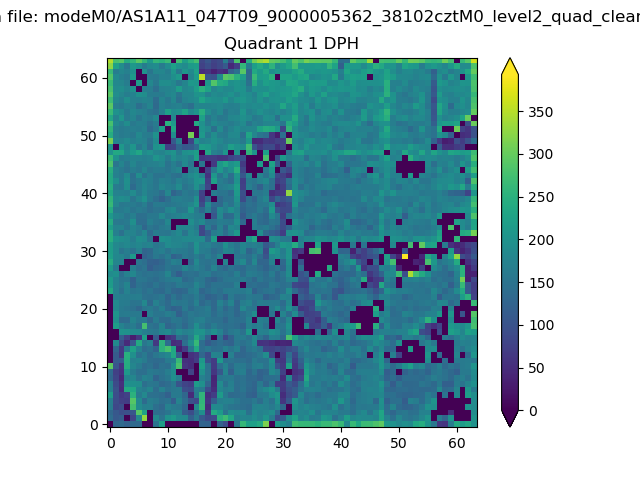 |
Quadrant B |
|---|---|---|---|
| Quadrant D | 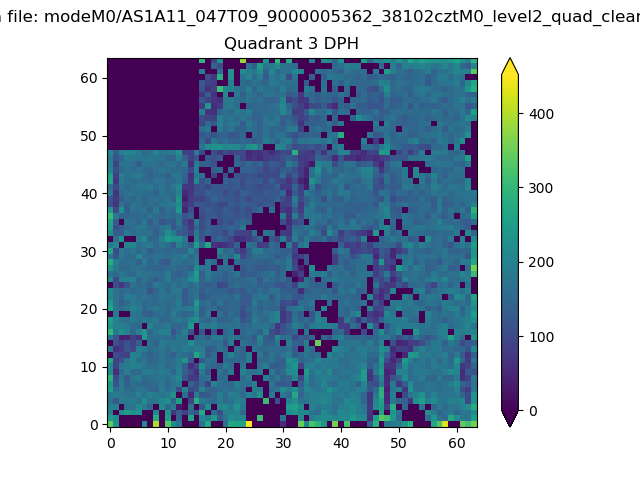 |
 |
Quadrant C |
| Plot type | Count rate plots | Images |
|---|---|---|
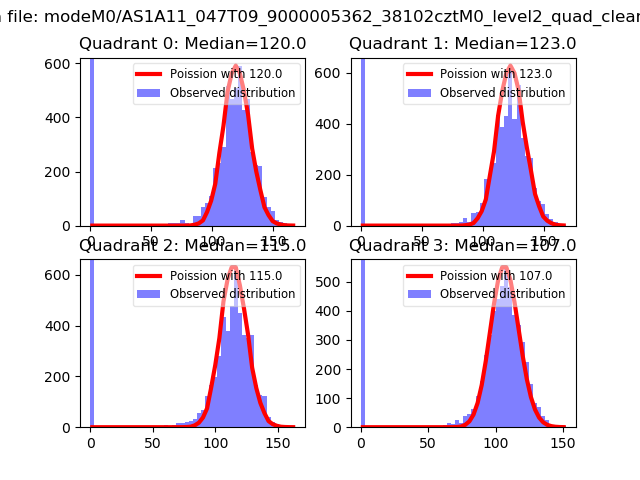
| Comparison with Poisson distribution Blue bars denote a histogram of data divided into 1 sec bins. Red curve is a Poisson curve with rate = median count rate of data. |
 |
 |
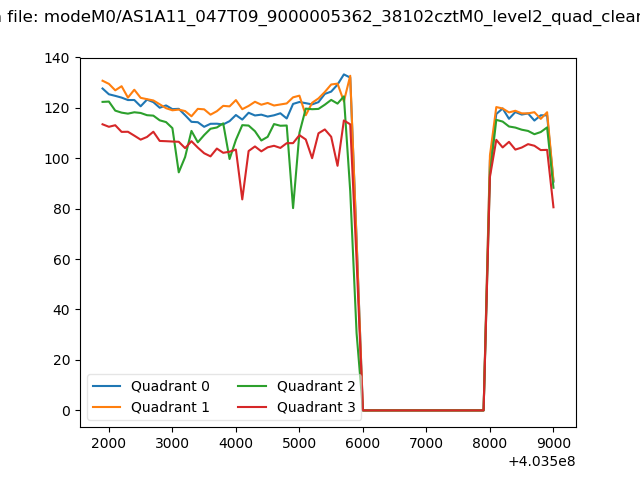
| Quadrant-wise count rates Data is divided into 100 sec bins |
 |
|
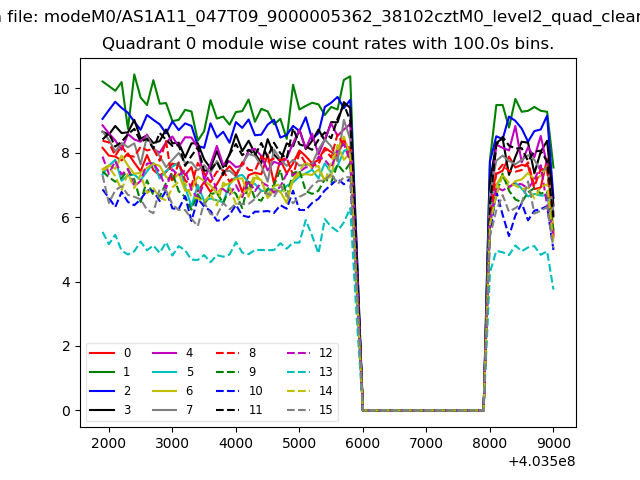
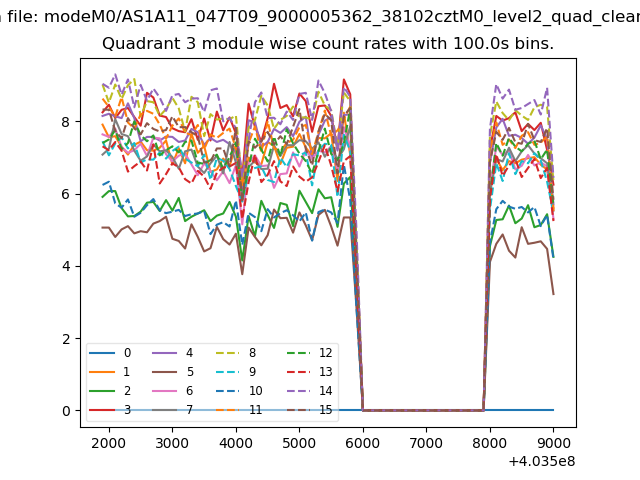
| Module-wise count rates for Quadrant A Data is divided into 100 sec bins |
 |
 |
| Module-wise count rates for Quadrant B Data is divided into 100 sec bins |
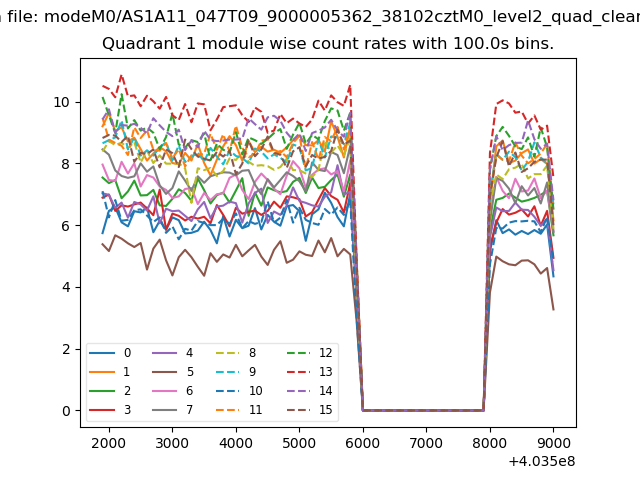 |
 |
| Module-wise count rates for Quadrant C Data is divided into 100 sec bins |
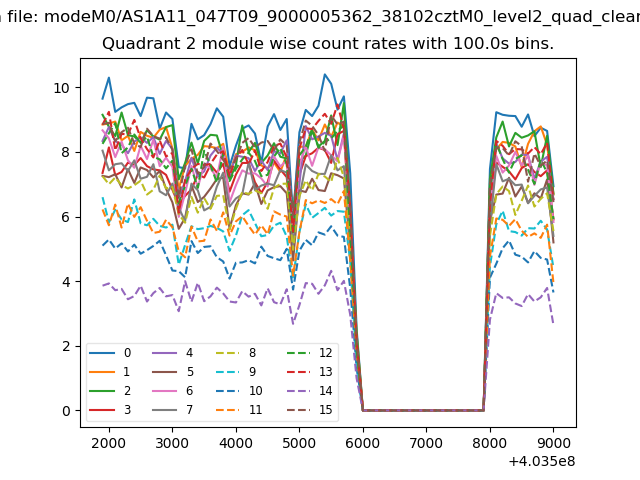 |
 |
| Module-wise count rates for Quadrant D Data is divided into 100 sec bins |
 |
 |
| Parameter | Plot |
|---|---|
| CZT HV Monitor | 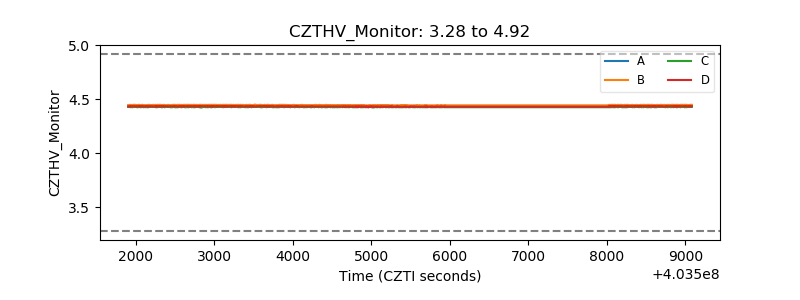 |
| D_VDD | 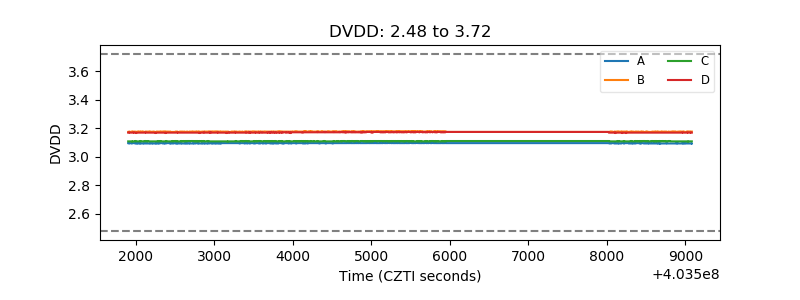 |
| Temperature 1 | 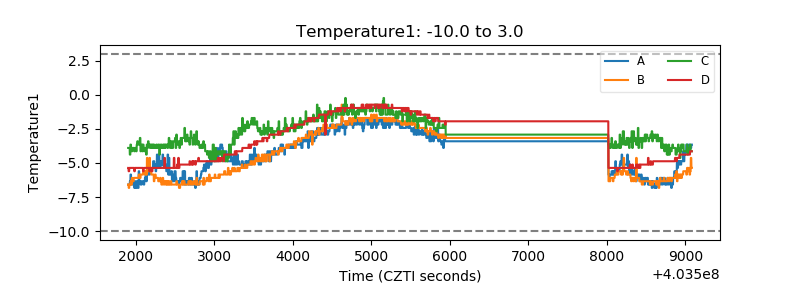 |
| Veto HV Monitor | 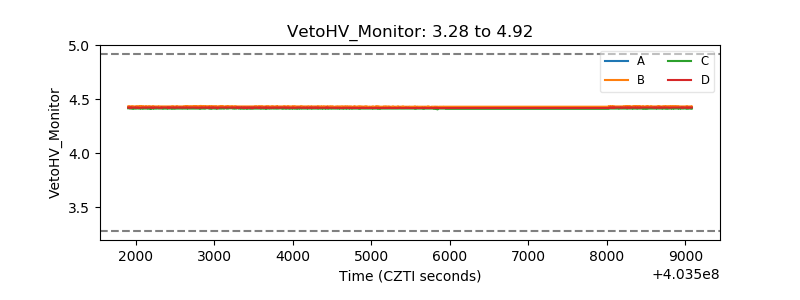 |
| Veto LLD |  |
| Alpha Counter | 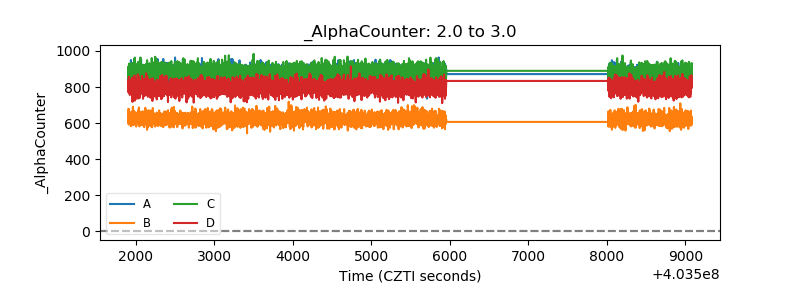 |
| _CPM_Rate | 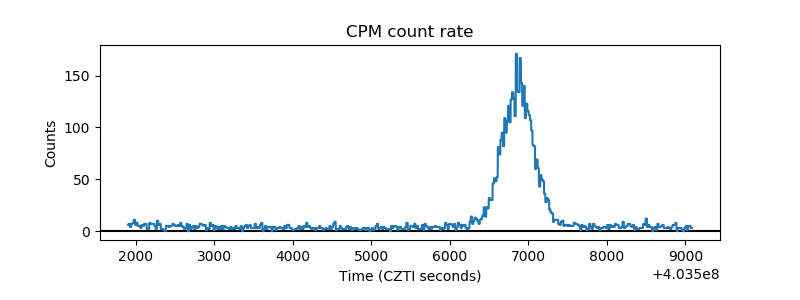 |
| CZT Counter | 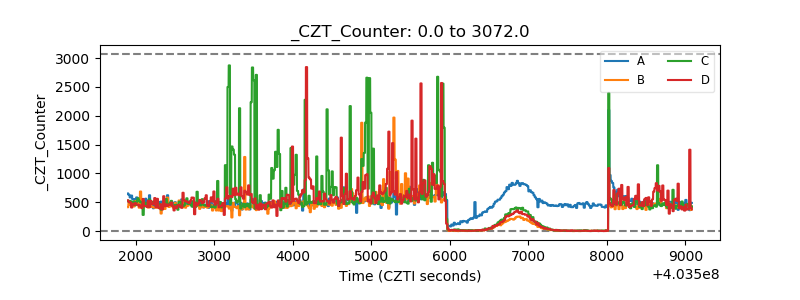 |
| +2.5 Volts monitor | 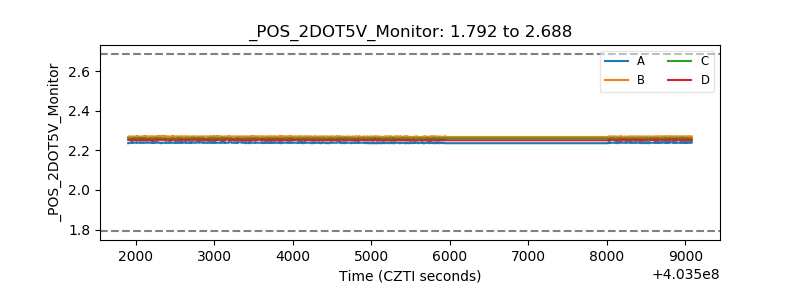 |
| +5 Volts monitor | 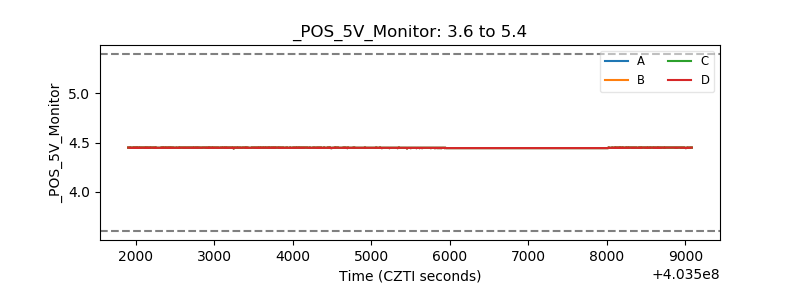 |
| _ROLL_ROT | 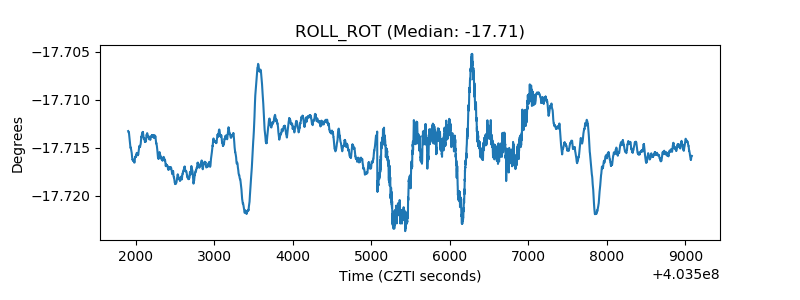 |
| _Roll_DEC | 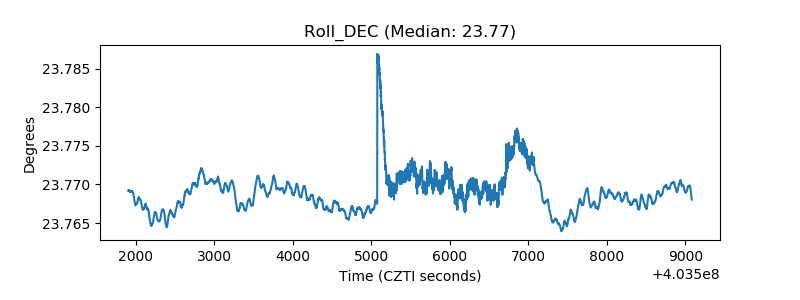 |
| _Roll_RA | 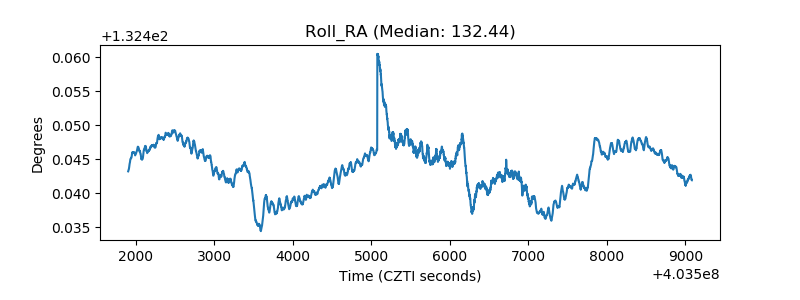 |
| Veto Counter | 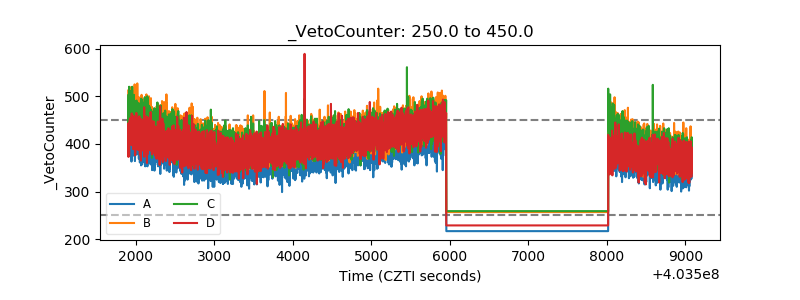 |