| Param | Original file | Final file |
|---|---|---|
| Filename | modeM0/AS1A11_047T09_9000005362_38103cztM0_level2.fits | modeM0/AS1A11_047T09_9000005362_38103cztM0_level2_quad_clean.evt |
| Size (bytes) | 333,440,640 | 90,535,680 |
| Size | 318.0 MB | 86.3 MB |
| Events in quadrant A | 3,012,531 | 611,063 |
| Events in quadrant B | 2,566,440 | 626,100 |
| Events in quadrant C | 2,701,655 | 589,009 |
| Events in quadrant D | 3,649,586 | 544,138 |
| Mode M0 | |||
|---|---|---|---|
| Quadrant | BADHDUFLAG | Total packets | Discarded packets |
| A | 0 | 12163 | 2 |
| B | 0 | 11172 | 1 |
| C | 0 | 11275 | 1 |
| D | 0 | 14569 | 1 |
| Mode SS | |||
|---|---|---|---|
| Quadrant | BADHDUFLAG | Total packets | Discarded packets |
| A | 0 | 108 | 0 |
| B | 0 | 108 | 0 |
| C | 0 | 108 | 0 |
| D | 0 | 108 | 0 |
| Mode M9 | |||
|---|---|---|---|
| Quadrant | BADHDUFLAG | Total packets | Discarded packets |
| A | 0 | 18 | 0 |
| B | 0 | 18 | 0 |
| C | 0 | 18 | 0 |
| D | 0 | 18 | 0 |
| Quadrant | Total seconds | Saturated seconds | Saturation percentage |
|---|---|---|---|
| A | 5299 | 26 | 0.490659% |
| B | 5299 | 24 | 0.452916% |
| C | 5299 | 32 | 0.603888% |
| D | 5299 | 97 | 1.830534% |
Noise dominated data is calculated using 1-second bins in cleaned event files. If a bin has >2000 counts, and if more than 50% of those come from <1% of pixels, then it is considered to be noise-dominated and hence unusable.
| Quadrant | # 1 sec bins | Bins with >0 counts | Bins with >2000 counts | High rate bins dominated by noise | Noise dominated (total time) | Noise dominated (detector-on time) | Marked lightcurve |
|---|---|---|---|---|---|---|---|
| A | 7092 | 5300 | 18 | 18 | 0.25% | 0.34% | 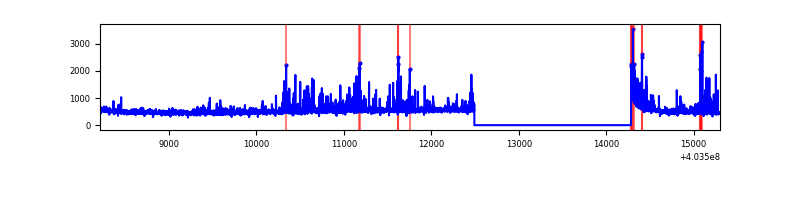 |
| B | 7092 | 5300 | 12 | 12 | 0.17% | 0.23% | 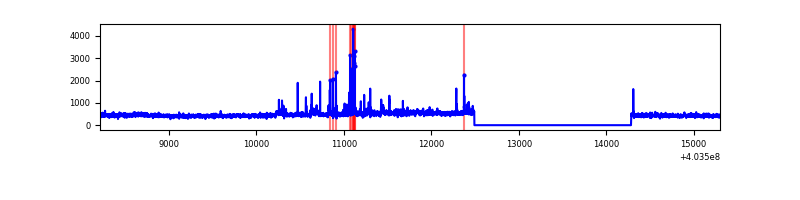 |
| C | 7092 | 5300 | 31 | 31 | 0.44% | 0.58% | 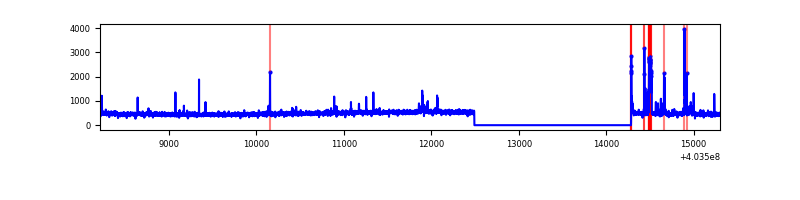 |
| D | 7092 | 5300 | 88 | 88 | 1.24% | 1.66% | 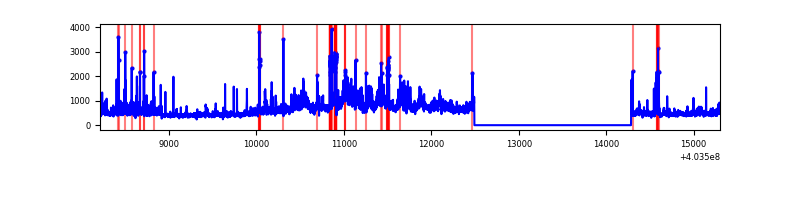 |
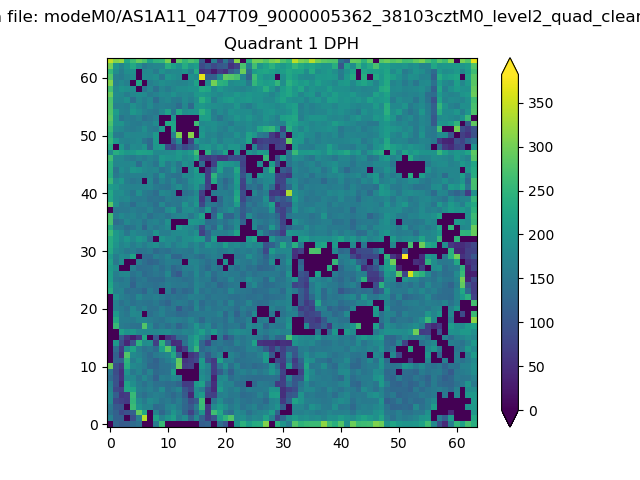
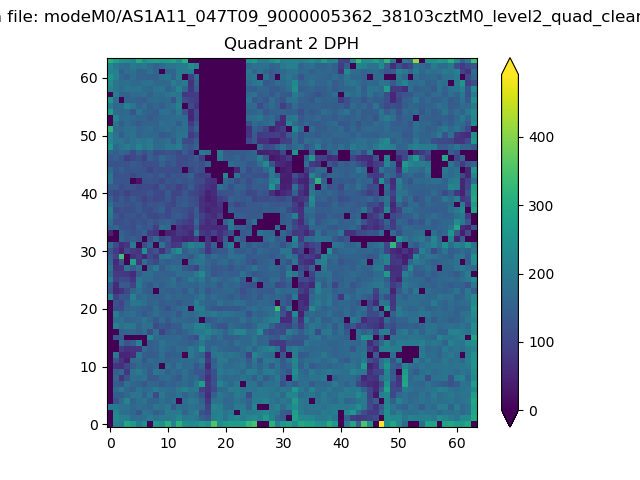
Top three noisy pixels from each quadrant. If the there are fewer than three noisy pixels in the level2.evt file, extra rows are filled as -1
| Pixel properties | Quadrant properties | ||||||
|---|---|---|---|---|---|---|---|
| Quadrant | DetID | PixID | Counts | Sigma | Mean | Median | Sigma |
| A | 10 | 83 | 321743 | 2615.43 | 606 | 594 | 122.8 |
| A | 12 | 16 | 258400 | 2099.56 | 606 | 594 | 122.8 |
| A | 12 | 194 | 42193 | 338.78 | 606 | 594 | 122.8 |
| B | 0 | 229 | 95436 | 805.48 | 599 | 582 | 117.8 |
| B | 15 | 85 | 32022 | 266.98 | 599 | 582 | 117.8 |
| B | 0 | 230 | 29267 | 243.59 | 599 | 582 | 117.8 |
| C | 15 | 214 | 219308 | 1591.98 | 586 | 590 | 137.4 |
| C | 1 | 23 | 142687 | 1034.28 | 586 | 590 | 137.4 |
| C | 14 | 254 | 26702 | 190.06 | 586 | 590 | 137.4 |
| D | 12 | 235 | 642318 | 4492.06 | 585 | 570 | 142.9 |
| D | 13 | 249 | 204359 | 1426.47 | 585 | 570 | 142.9 |
| D | 12 | 233 | 119734 | 834.11 | 585 | 570 | 142.9 |
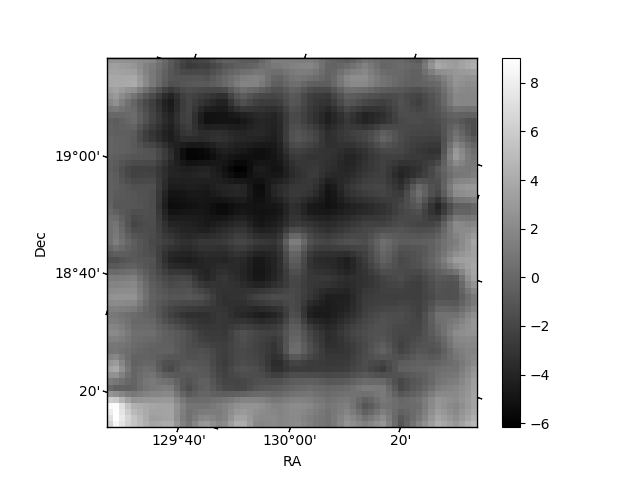
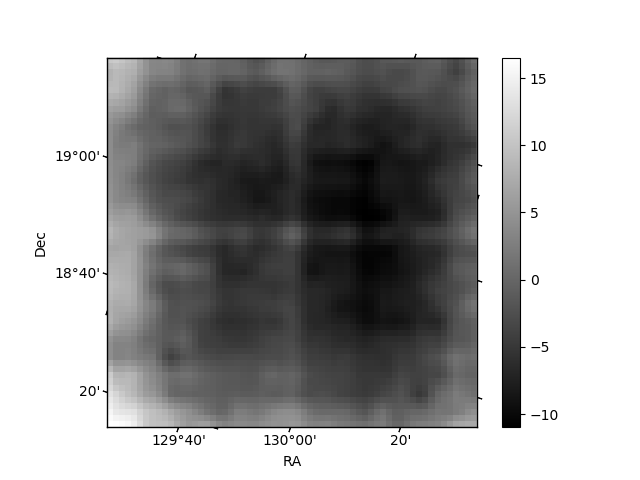
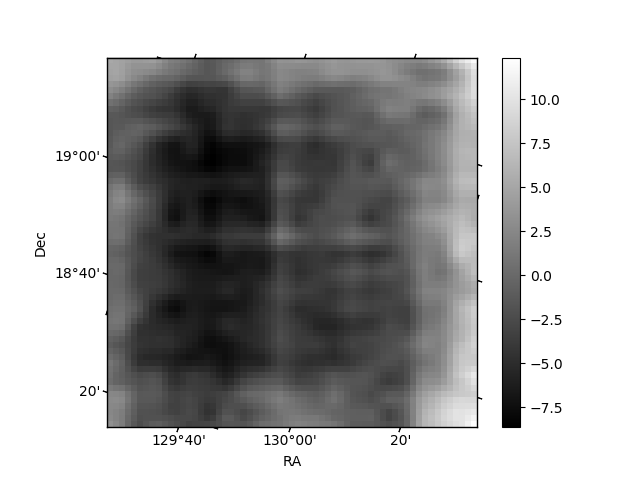
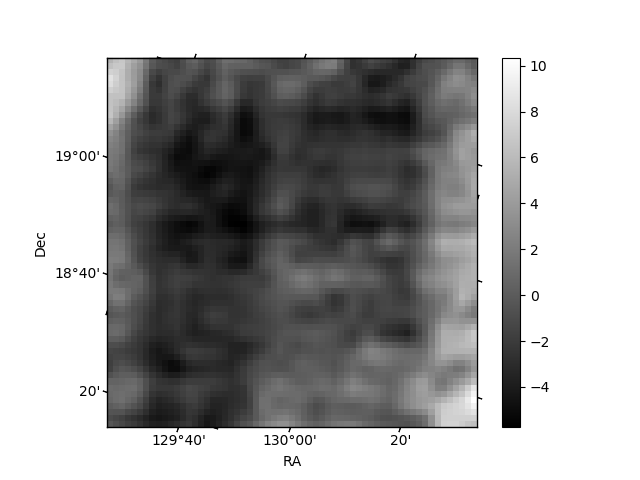
Histogram calculated using DETX and DETY for each event in the final _common_clean file
| Quadrant A | 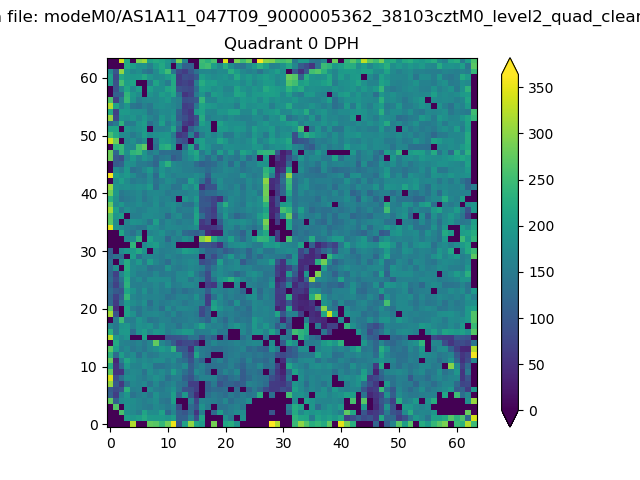 |
 |
Quadrant B |
|---|---|---|---|
| Quadrant D | 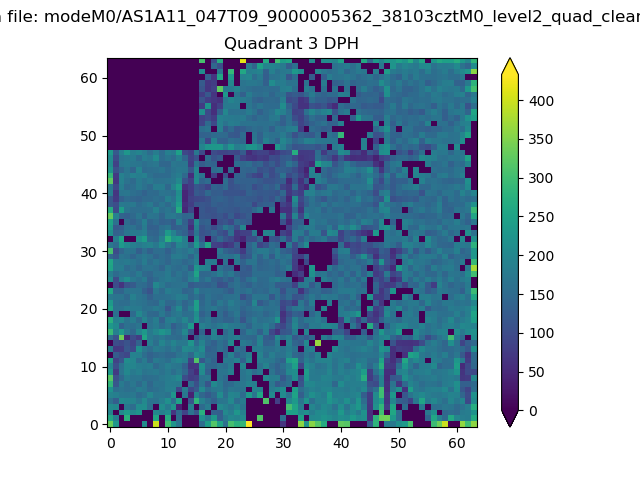 |
 |
Quadrant C |
| Plot type | Count rate plots | Images |
|---|---|---|
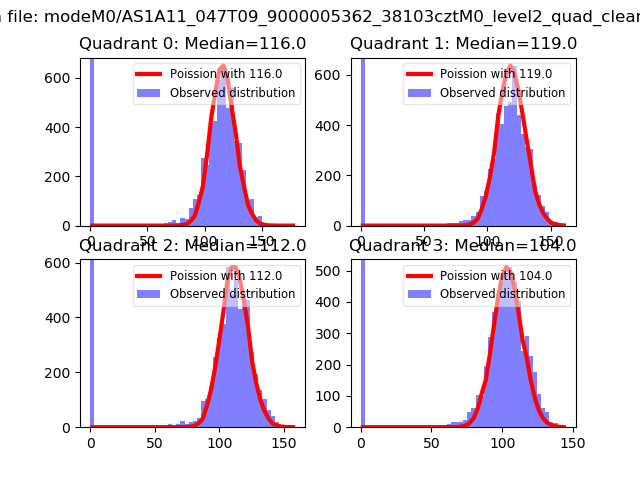
| Comparison with Poisson distribution Blue bars denote a histogram of data divided into 1 sec bins. Red curve is a Poisson curve with rate = median count rate of data. |
 |
 |
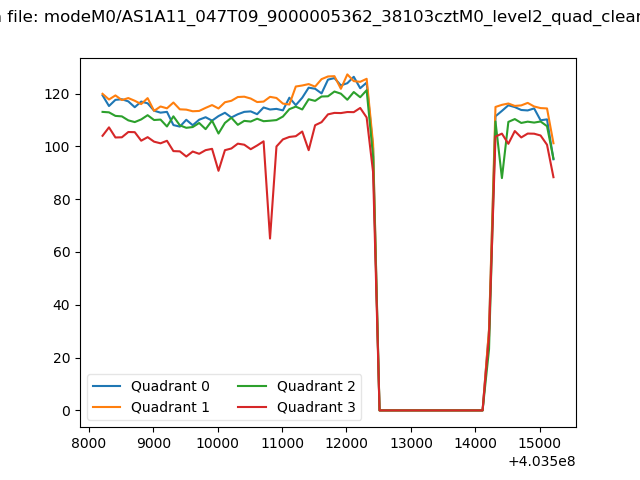
| Quadrant-wise count rates Data is divided into 100 sec bins |
 |
|
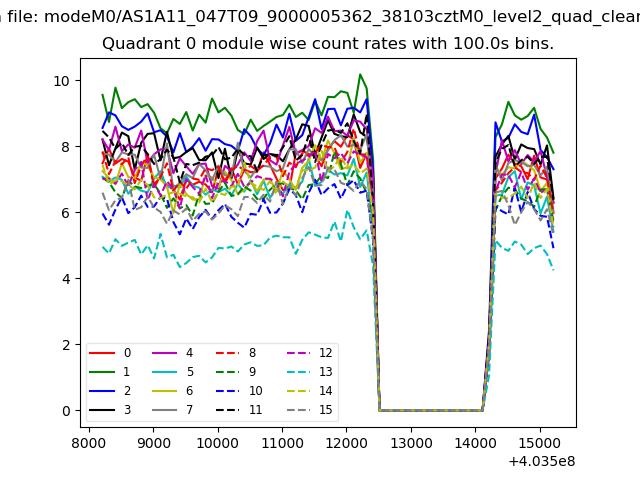
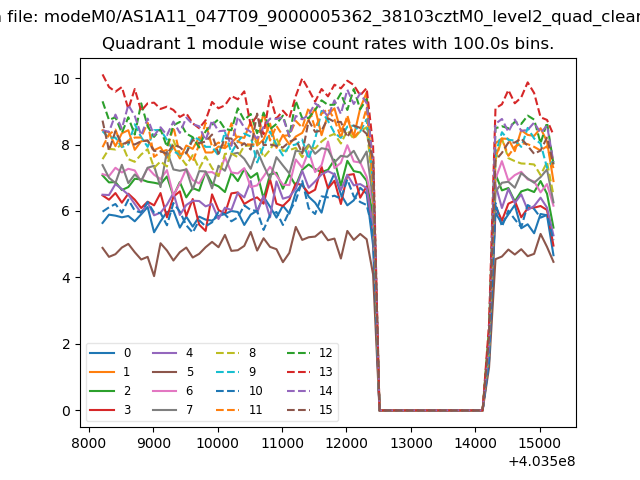
| Module-wise count rates for Quadrant A Data is divided into 100 sec bins |
 |
 |
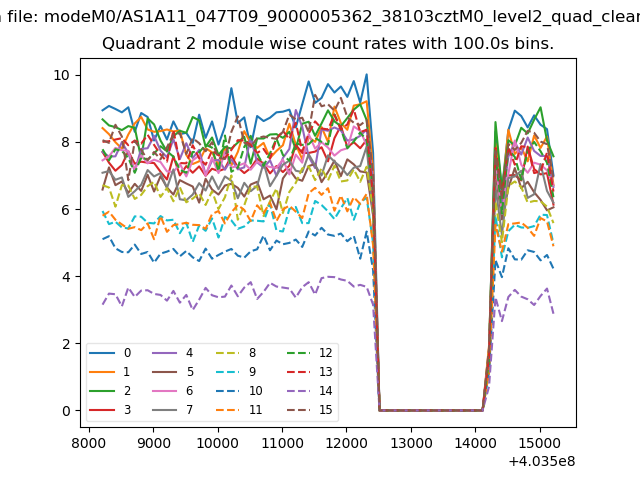
| Module-wise count rates for Quadrant B Data is divided into 100 sec bins |
 |
 |
| Module-wise count rates for Quadrant C Data is divided into 100 sec bins |
 |
 |
| Module-wise count rates for Quadrant D Data is divided into 100 sec bins |
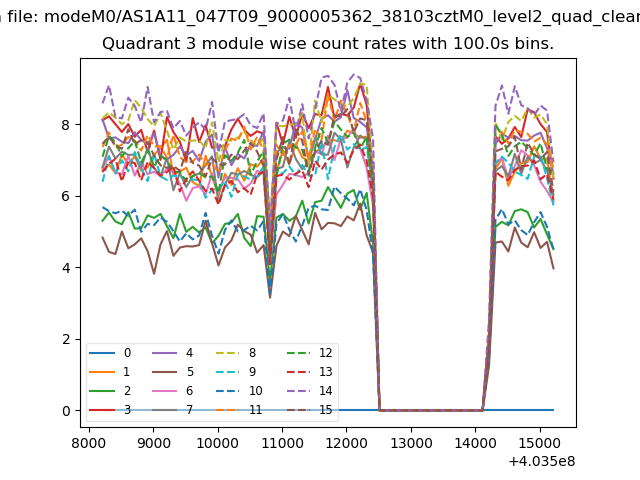 |
 |
| Parameter | Plot |
|---|---|
| CZT HV Monitor | 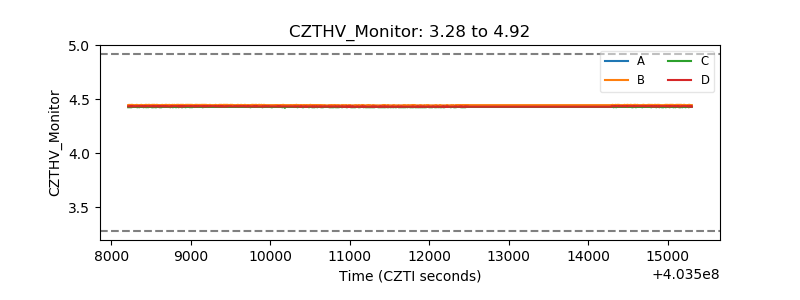 |
| D_VDD | 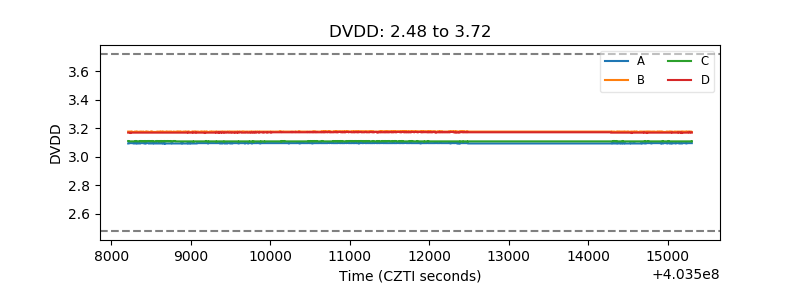 |
| Temperature 1 | 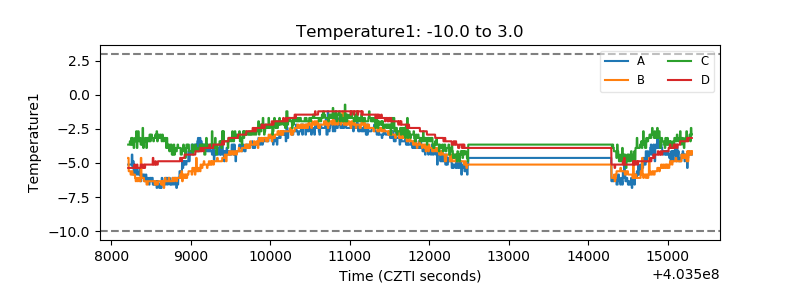 |
| Veto HV Monitor | 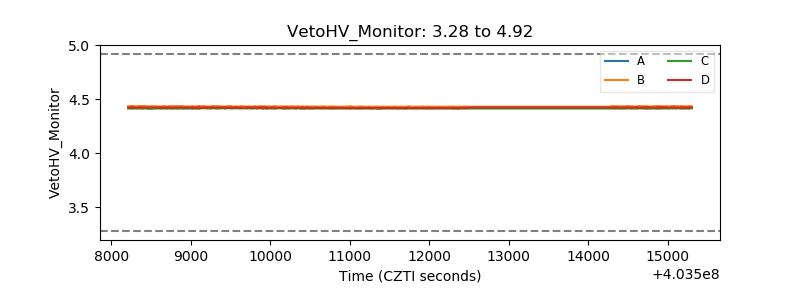 |
| Veto LLD | 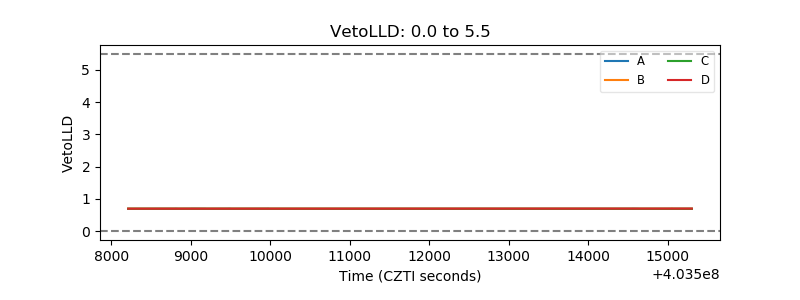 |
| Alpha Counter | 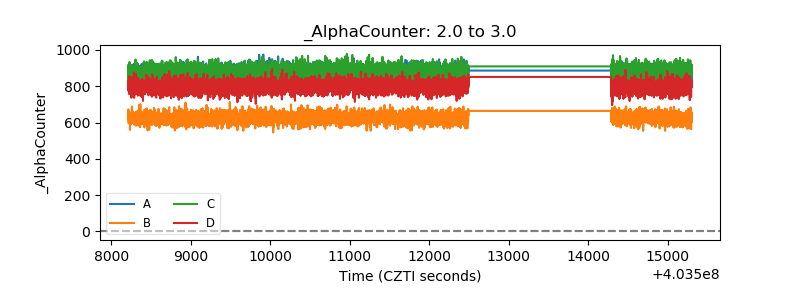 |
| _CPM_Rate | 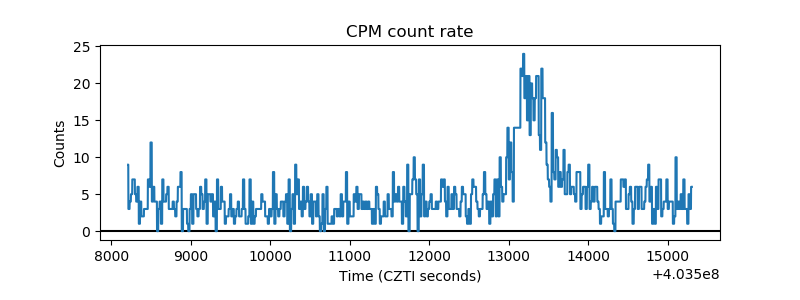 |
| CZT Counter | 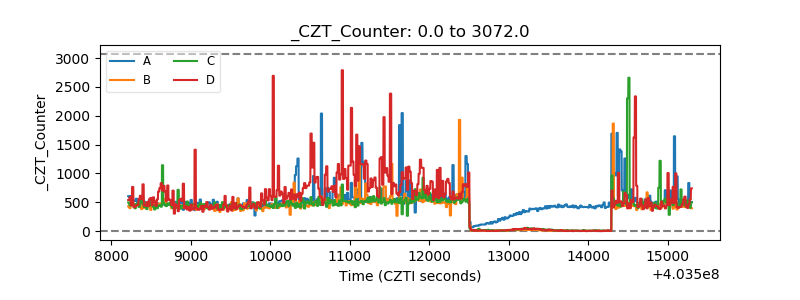 |
| +2.5 Volts monitor | 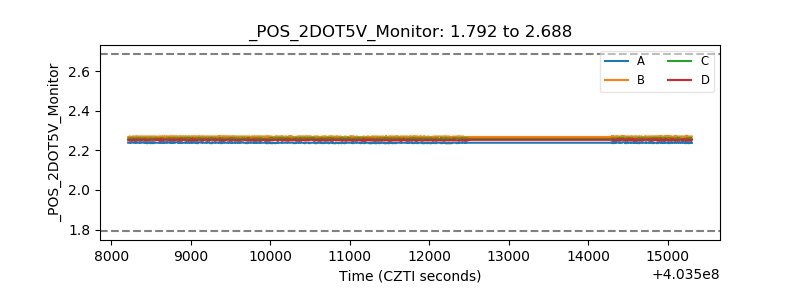 |
| +5 Volts monitor | 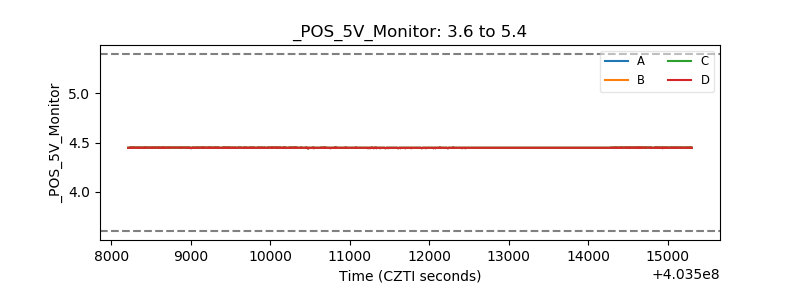 |
| _ROLL_ROT | 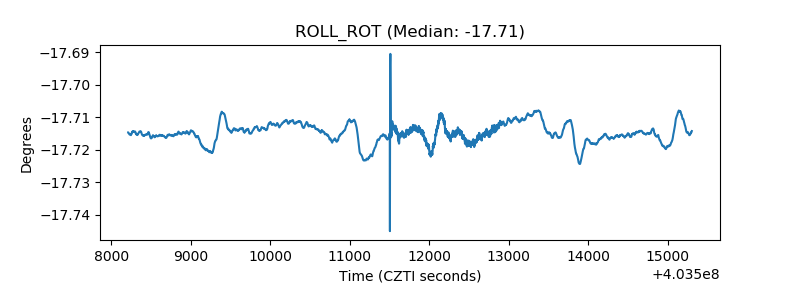 |
| _Roll_DEC | 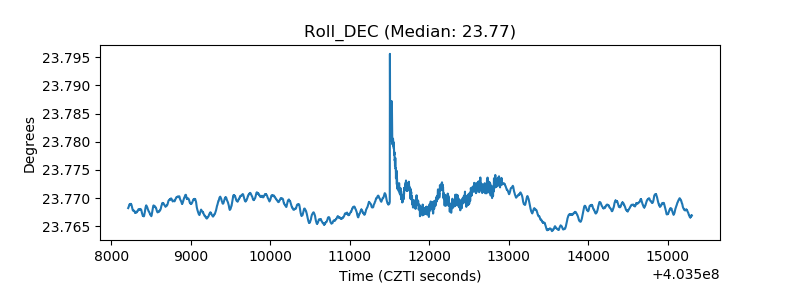 |
| _Roll_RA | 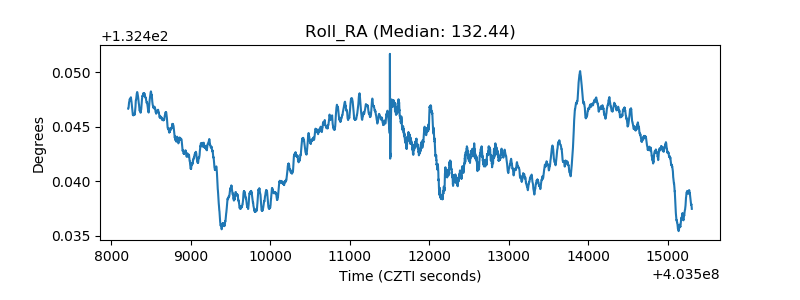 |
| Veto Counter | 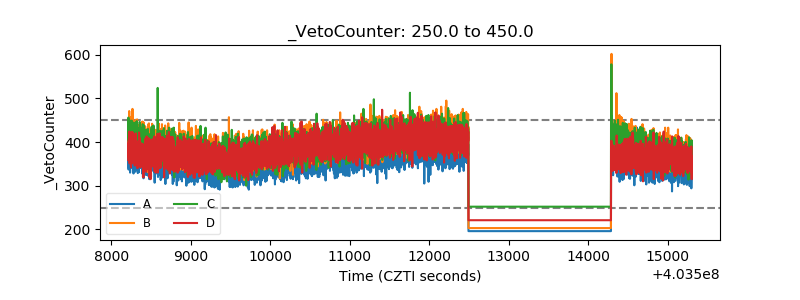 |