| Param | Original file | Final file |
|---|---|---|
| Filename | modeM0/AS1A11_047T09_9000005362_38104cztM0_level2.fits | modeM0/AS1A11_047T09_9000005362_38104cztM0_level2_quad_clean.evt |
| Size (bytes) | 347,454,720 | 91,160,640 |
| Size | 331.4 MB | 86.9 MB |
| Events in quadrant A | 2,921,651 | 615,724 |
| Events in quadrant B | 2,671,801 | 627,748 |
| Events in quadrant C | 2,900,082 | 594,892 |
| Events in quadrant D | 3,948,053 | 544,683 |
| Mode M0 | |||
|---|---|---|---|
| Quadrant | BADHDUFLAG | Total packets | Discarded packets |
| A | 0 | 11792 | 2 |
| B | 0 | 11503 | 1 |
| C | 0 | 11827 | 1 |
| D | 0 | 15255 | 1 |
| Mode SS | |||
|---|---|---|---|
| Quadrant | BADHDUFLAG | Total packets | Discarded packets |
| A | 0 | 108 | 0 |
| B | 0 | 108 | 0 |
| C | 0 | 108 | 0 |
| D | 0 | 108 | 0 |
| Mode M9 | |||
|---|---|---|---|
| Quadrant | BADHDUFLAG | Total packets | Discarded packets |
| A | 0 | 15 | 0 |
| B | 0 | 15 | 0 |
| C | 0 | 15 | 0 |
| D | 0 | 15 | 0 |
| Quadrant | Total seconds | Saturated seconds | Saturation percentage |
|---|---|---|---|
| A | 5396 | 24 | 0.444774% |
| B | 5396 | 40 | 0.741290% |
| C | 5396 | 28 | 0.518903% |
| D | 5396 | 176 | 3.261675% |
Noise dominated data is calculated using 1-second bins in cleaned event files. If a bin has >2000 counts, and if more than 50% of those come from <1% of pixels, then it is considered to be noise-dominated and hence unusable.
| Quadrant | # 1 sec bins | Bins with >0 counts | Bins with >2000 counts | High rate bins dominated by noise | Noise dominated (total time) | Noise dominated (detector-on time) | Marked lightcurve |
|---|---|---|---|---|---|---|---|
| A | 6858 | 5397 | 19 | 19 | 0.28% | 0.35% | 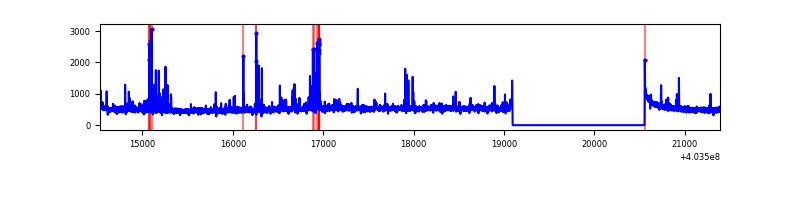 |
| B | 6858 | 5397 | 22 | 22 | 0.32% | 0.41% | 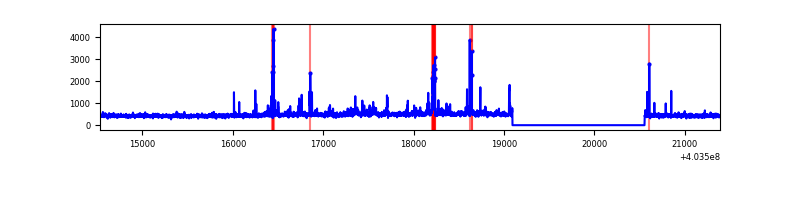 |
| C | 6858 | 5397 | 32 | 32 | 0.47% | 0.59% | 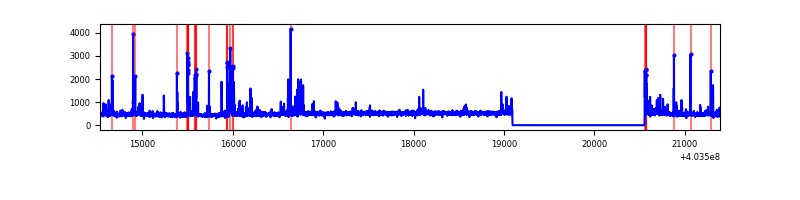 |
| D | 6858 | 5397 | 252 | 252 | 3.67% | 4.67% | 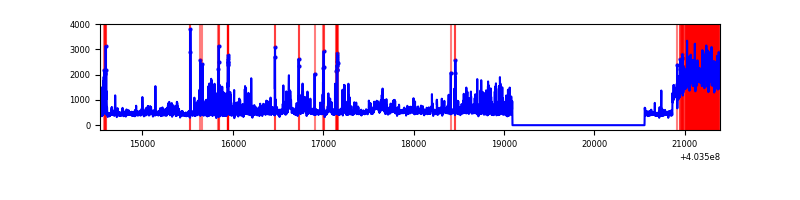 |
Top three noisy pixels from each quadrant. If the there are fewer than three noisy pixels in the level2.evt file, extra rows are filled as -1
| Pixel properties | Quadrant properties | ||||||
|---|---|---|---|---|---|---|---|
| Quadrant | DetID | PixID | Counts | Sigma | Mean | Median | Sigma |
| A | 10 | 83 | 323203 | 2568.53 | 618 | 606 | 125.6 |
| A | 12 | 16 | 110089 | 871.71 | 618 | 606 | 125.6 |
| A | 13 | 248 | 26183 | 203.65 | 618 | 606 | 125.6 |
| B | 0 | 229 | 145673 | 1209.69 | 612 | 595 | 119.9 |
| B | 5 | 172 | 81538 | 674.92 | 612 | 595 | 119.9 |
| B | 12 | 111 | 14827 | 118.67 | 612 | 595 | 119.9 |
| C | 1 | 23 | 234680 | 1655.57 | 599 | 604 | 141.4 |
| C | 15 | 214 | 220578 | 1555.83 | 599 | 604 | 141.4 |
| C | 0 | 239 | 40711 | 283.67 | 599 | 604 | 141.4 |
| D | 1 | 20 | 1060194 | 7181.99 | 598 | 581 | 147.5 |
| D | 13 | 249 | 152356 | 1028.72 | 598 | 581 | 147.5 |
| D | 12 | 235 | 132546 | 894.45 | 598 | 581 | 147.5 |
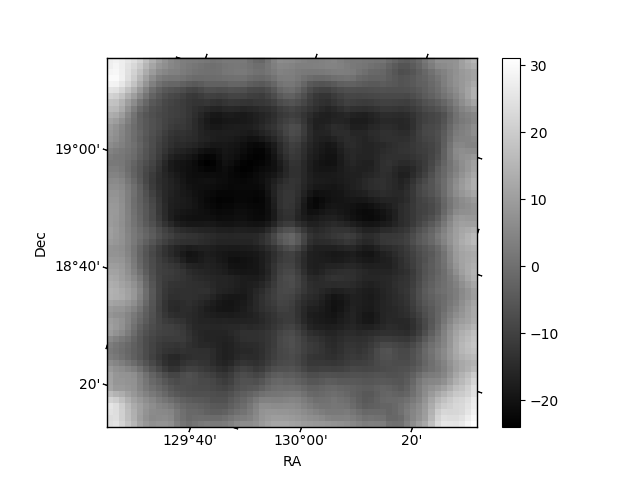
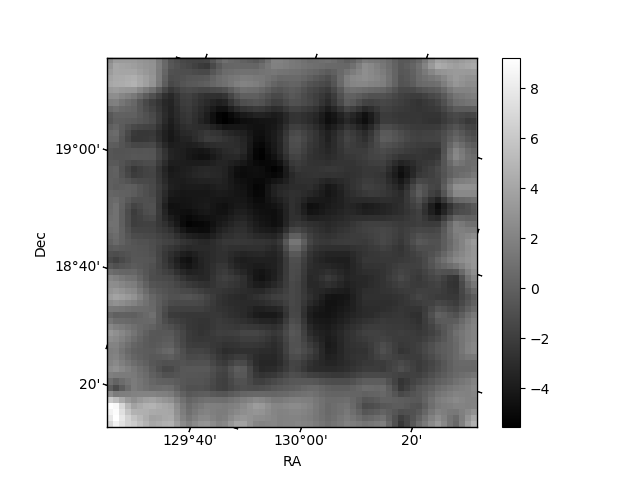
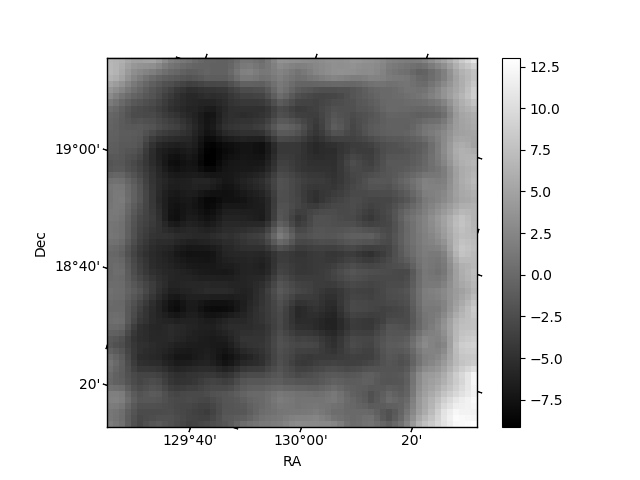
Histogram calculated using DETX and DETY for each event in the final _common_clean file
| Quadrant A | 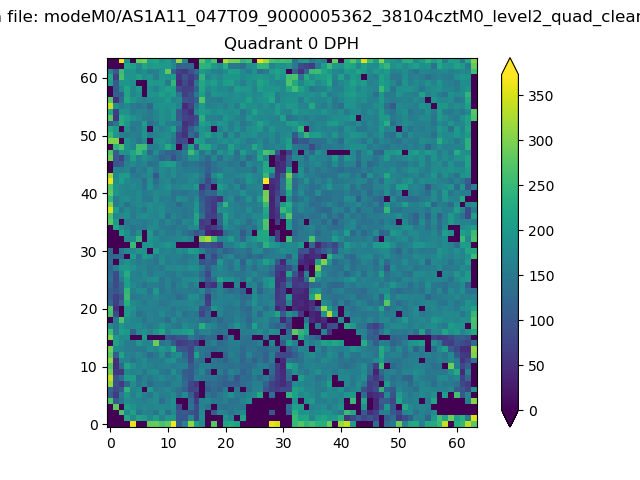 |
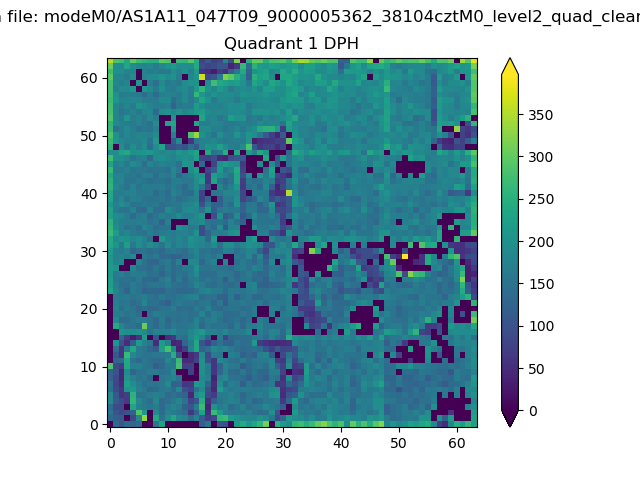 |
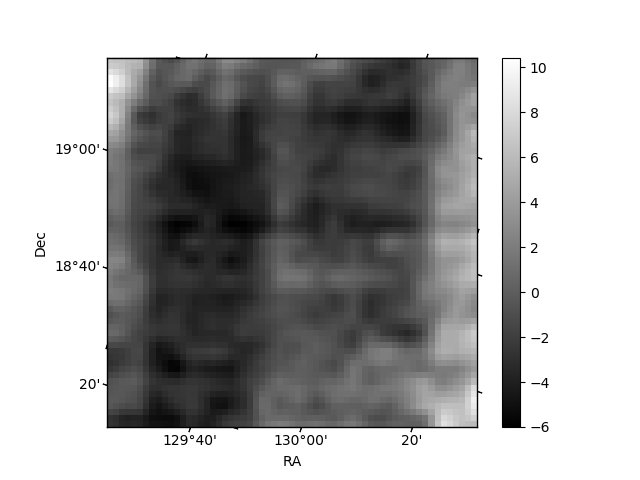
Quadrant B |
|---|---|---|---|
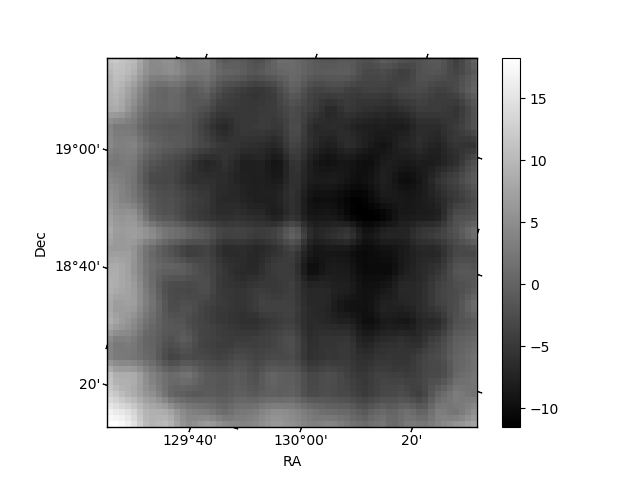
| Quadrant D | 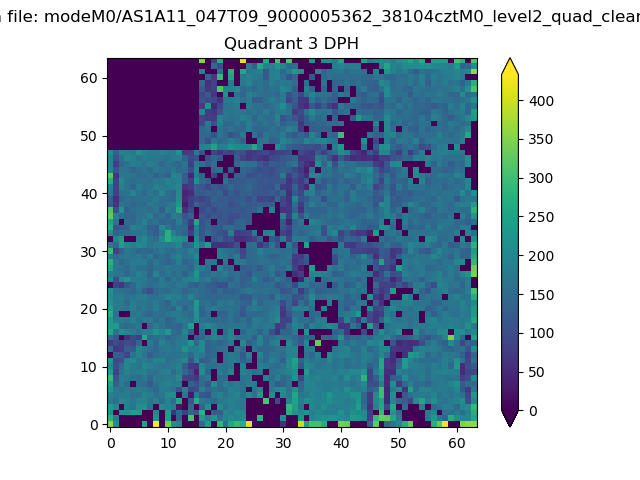 |
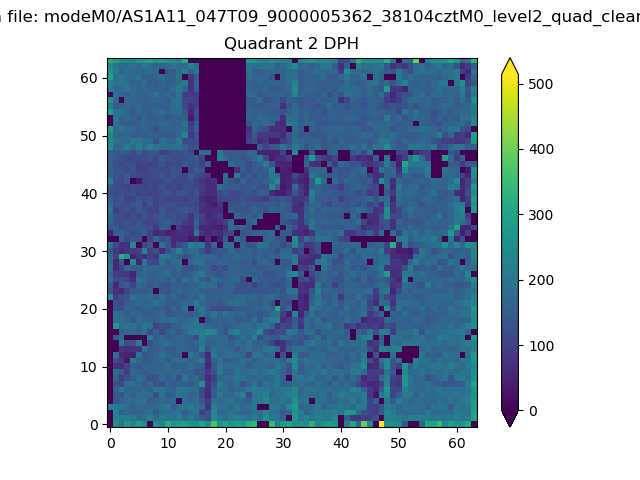 |
Quadrant C |
| Plot type | Count rate plots | Images |
|---|---|---|
| Comparison with Poisson distribution Blue bars denote a histogram of data divided into 1 sec bins. Red curve is a Poisson curve with rate = median count rate of data. |
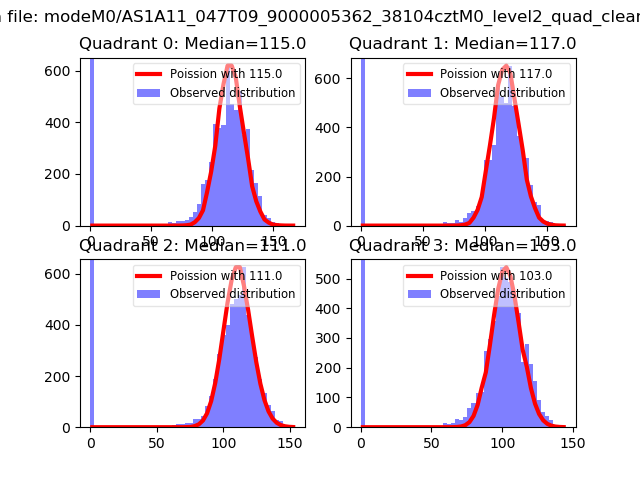 |
 |
| Quadrant-wise count rates Data is divided into 100 sec bins |
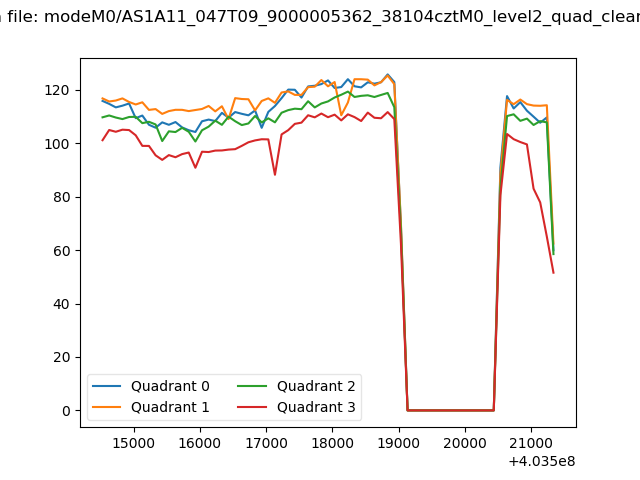 |
|
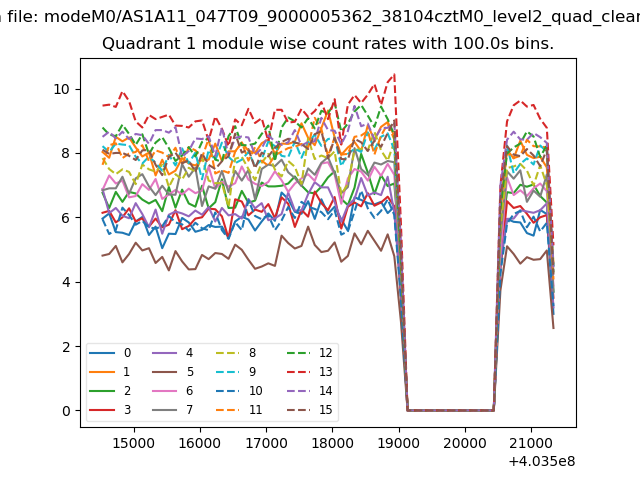
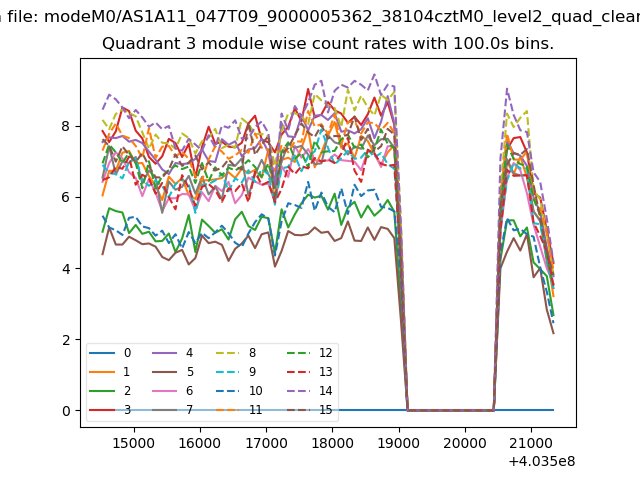
| Module-wise count rates for Quadrant A Data is divided into 100 sec bins |
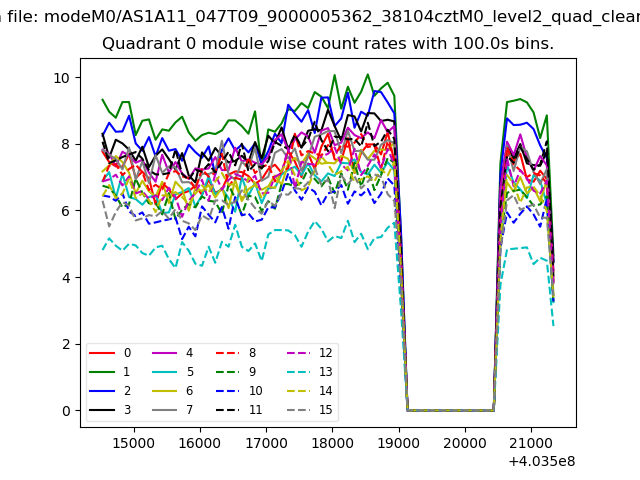 |
 |
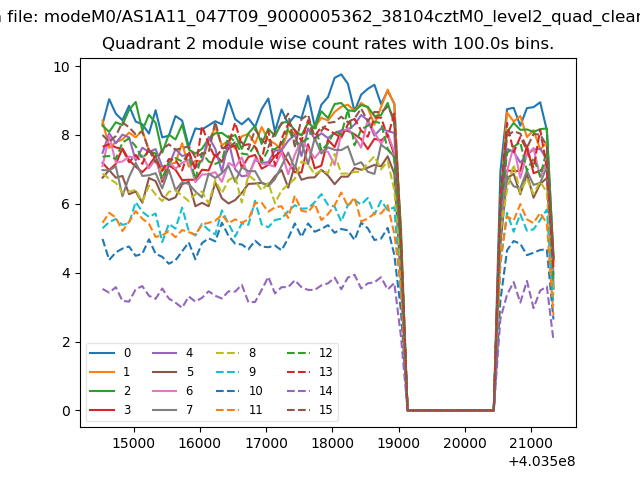
| Module-wise count rates for Quadrant B Data is divided into 100 sec bins |
 |
 |
| Module-wise count rates for Quadrant C Data is divided into 100 sec bins |
 |
 |
| Module-wise count rates for Quadrant D Data is divided into 100 sec bins |
 |
 |
| Parameter | Plot |
|---|---|
| CZT HV Monitor |  |
| D_VDD | 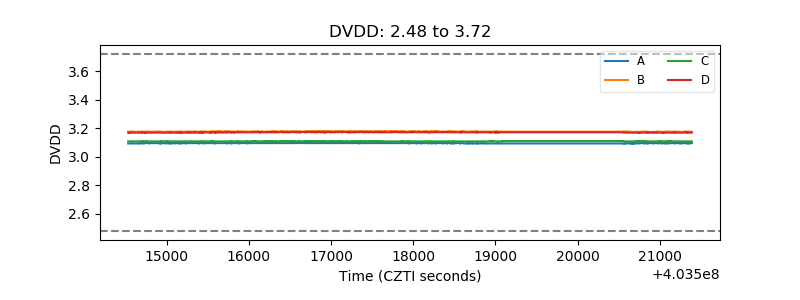 |
| Temperature 1 | 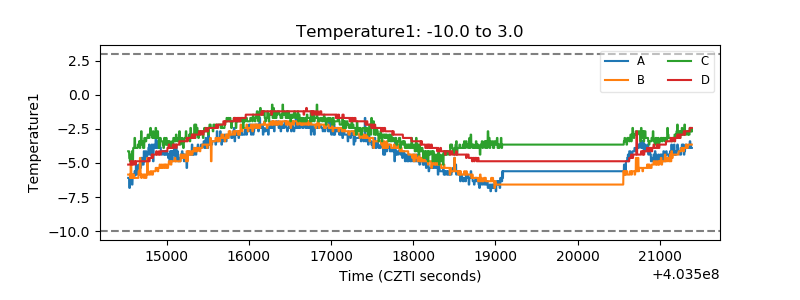 |
| Veto HV Monitor | 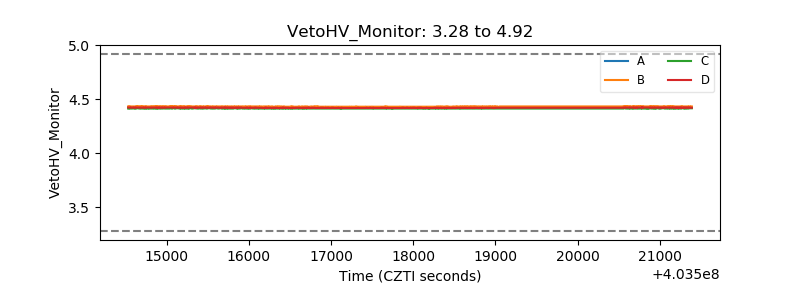 |
| Veto LLD | 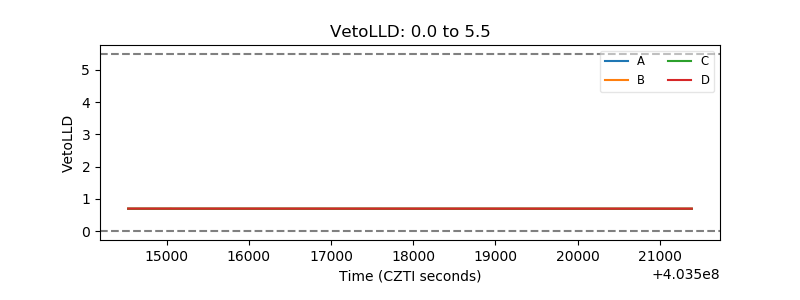 |
| Alpha Counter | 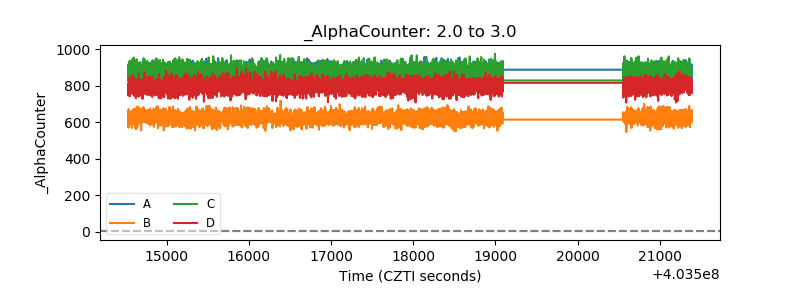 |
| _CPM_Rate | 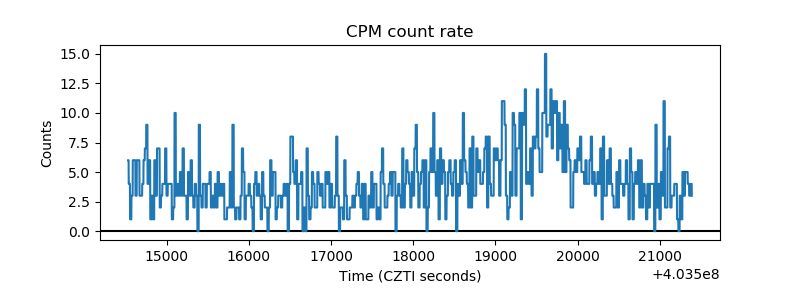 |
| CZT Counter | 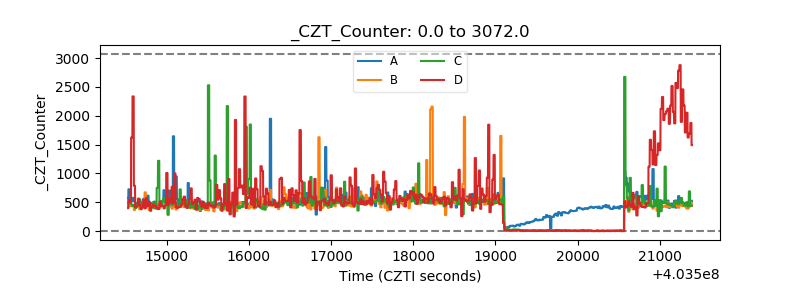 |
| +2.5 Volts monitor | 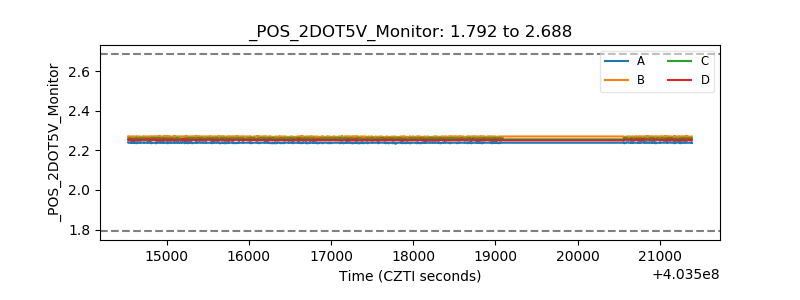 |
| +5 Volts monitor |  |
| _ROLL_ROT | 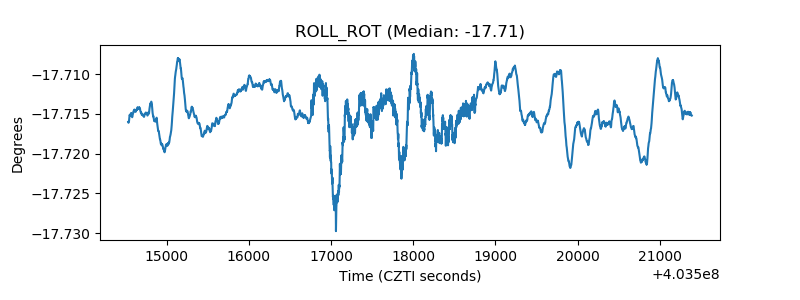 |
| _Roll_DEC | 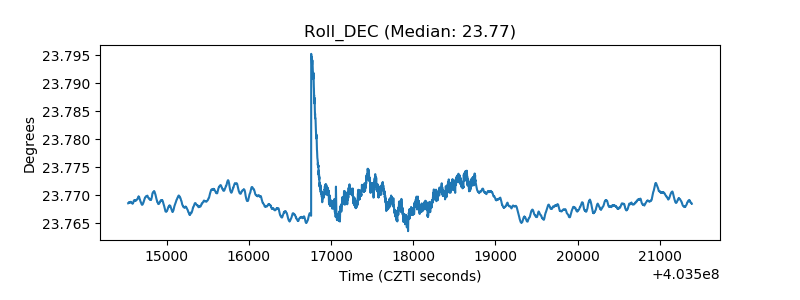 |
| _Roll_RA |  |
| Veto Counter | 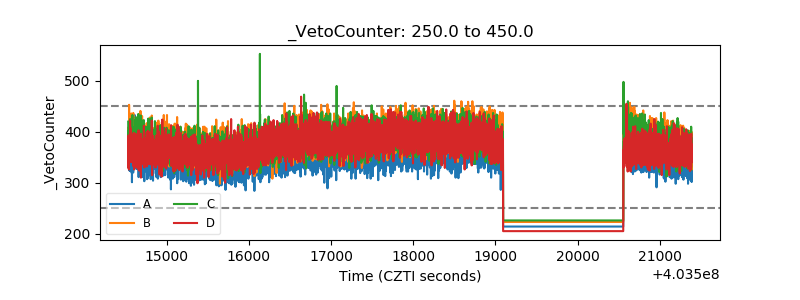 |