| Param | Original file | Final file |
|---|---|---|
| Filename | modeM0/AS1A11_047T09_9000005362_38105cztM0_level2.fits | modeM0/AS1A11_047T09_9000005362_38105cztM0_level2_quad_clean.evt |
| Size (bytes) | 421,588,800 | 96,583,680 |
| Size | 402.1 MB | 92.1 MB |
| Events in quadrant A | 3,259,048 | 658,484 |
| Events in quadrant B | 2,933,557 | 670,398 |
| Events in quadrant C | 3,423,205 | 626,828 |
| Events in quadrant D | 5,535,235 | 559,899 |
| Mode M0 | |||
|---|---|---|---|
| Quadrant | BADHDUFLAG | Total packets | Discarded packets |
| A | 0 | 13093 | 3 |
| B | 0 | 12507 | 2 |
| C | 0 | 13633 | 2 |
| D | 0 | 20319 | 2 |
| Mode SS | |||
|---|---|---|---|
| Quadrant | BADHDUFLAG | Total packets | Discarded packets |
| A | 0 | 118 | 0 |
| B | 0 | 118 | 0 |
| C | 0 | 118 | 0 |
| D | 0 | 118 | 0 |
| Mode M9 | |||
|---|---|---|---|
| Quadrant | BADHDUFLAG | Total packets | Discarded packets |
| A | 0 | 20 | 0 |
| B | 0 | 20 | 0 |
| C | 0 | 20 | 0 |
| D | 0 | 21 | 0 |
| Quadrant | Total seconds | Saturated seconds | Saturation percentage |
|---|---|---|---|
| A | 5852 | 36 | 0.615174% |
| B | 5852 | 44 | 0.751880% |
| C | 5852 | 164 | 2.802461% |
| D | 5852 | 464 | 7.928913% |
Noise dominated data is calculated using 1-second bins in cleaned event files. If a bin has >2000 counts, and if more than 50% of those come from <1% of pixels, then it is considered to be noise-dominated and hence unusable.
| Quadrant | # 1 sec bins | Bins with >0 counts | Bins with >2000 counts | High rate bins dominated by noise | Noise dominated (total time) | Noise dominated (detector-on time) | Marked lightcurve |
|---|---|---|---|---|---|---|---|
| A | 7165 | 5853 | 26 | 26 | 0.36% | 0.44% | 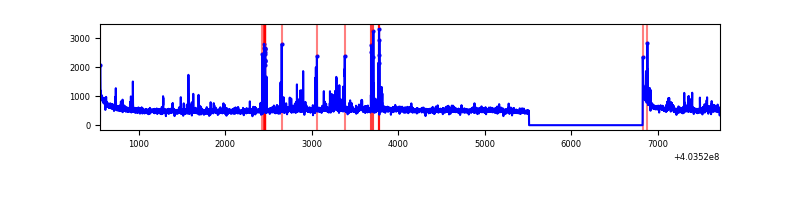 |
| B | 7165 | 5853 | 33 | 33 | 0.46% | 0.56% | 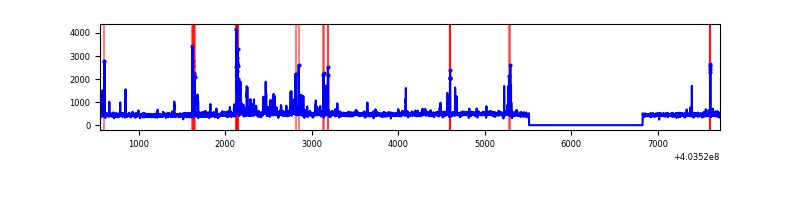 |
| C | 7165 | 5853 | 148 | 148 | 2.07% | 2.53% | 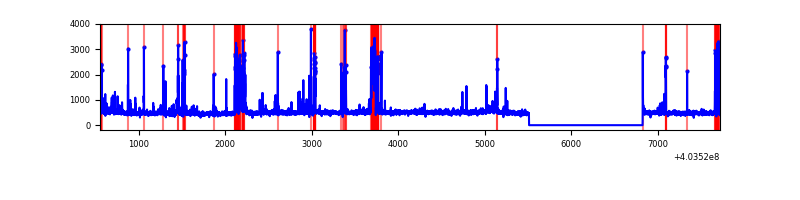 |
| D | 7165 | 5853 | 534 | 534 | 7.45% | 9.12% | 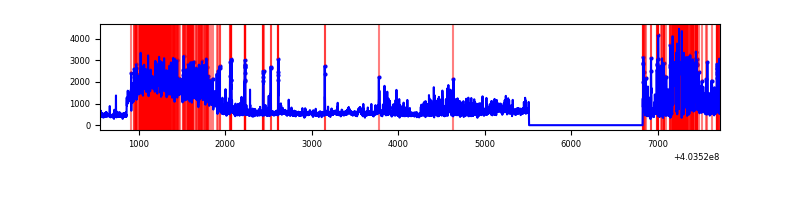 |
Top three noisy pixels from each quadrant. If the there are fewer than three noisy pixels in the level2.evt file, extra rows are filled as -1
| Pixel properties | Quadrant properties | ||||||
|---|---|---|---|---|---|---|---|
| Quadrant | DetID | PixID | Counts | Sigma | Mean | Median | Sigma |
| A | 10 | 83 | 397613 | 2920.94 | 667 | 655 | 135.9 |
| A | 13 | 248 | 103738 | 758.52 | 667 | 655 | 135.9 |
| A | 12 | 16 | 76007 | 554.46 | 667 | 655 | 135.9 |
| B | 0 | 229 | 145762 | 1109.27 | 664 | 645 | 130.8 |
| B | 5 | 172 | 84203 | 638.71 | 664 | 645 | 130.8 |
| B | 15 | 85 | 23877 | 177.58 | 664 | 645 | 130.8 |
| C | 1 | 23 | 494908 | 3250.4 | 644 | 649 | 152.1 |
| C | 15 | 214 | 244476 | 1603.48 | 644 | 649 | 152.1 |
| C | 5 | 250 | 70712 | 460.76 | 644 | 649 | 152.1 |
| D | 1 | 20 | 1909055 | 12266.44 | 635 | 617 | 155.6 |
| D | 13 | 138 | 614003 | 3942.52 | 635 | 617 | 155.6 |
| D | 12 | 235 | 145301 | 929.95 | 635 | 617 | 155.6 |
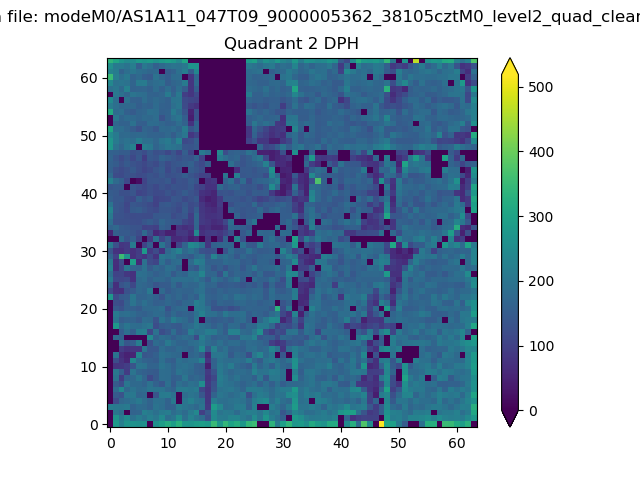
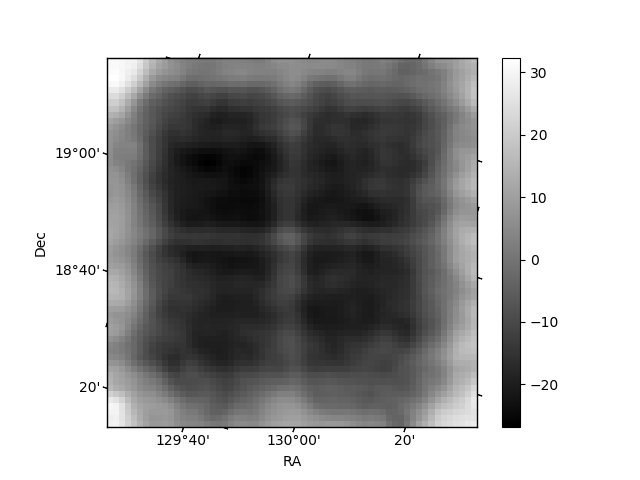
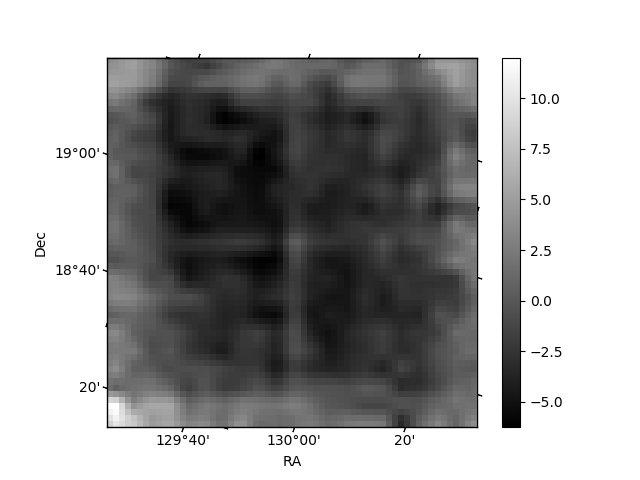
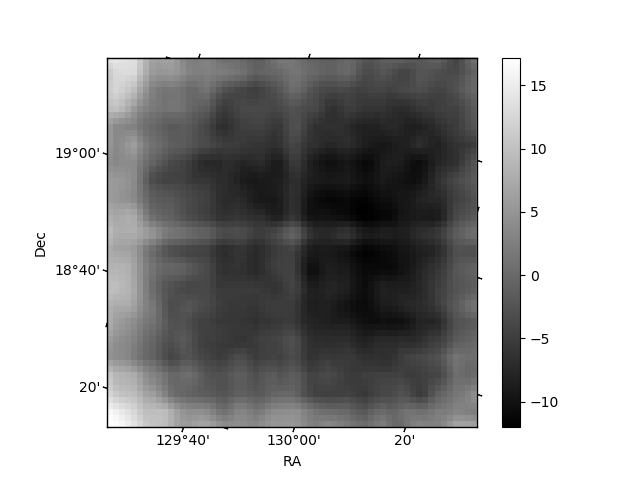
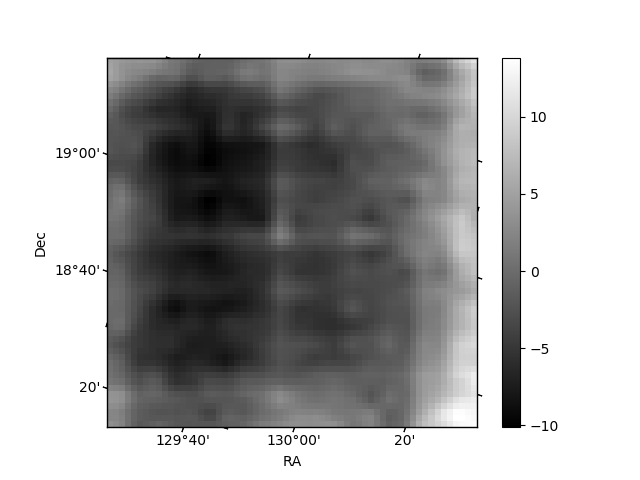
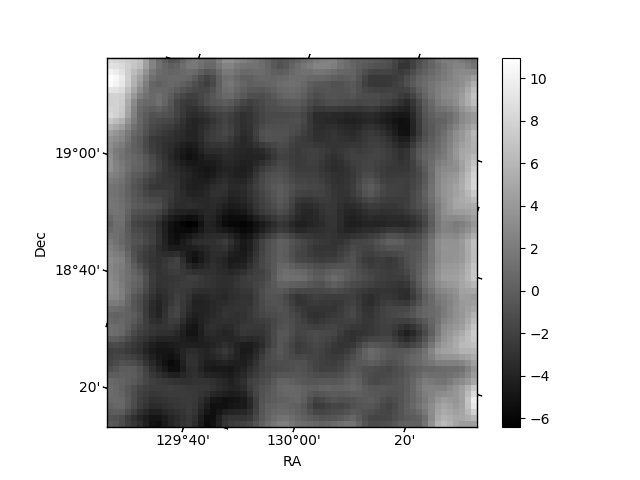
Histogram calculated using DETX and DETY for each event in the final _common_clean file
| Quadrant A | 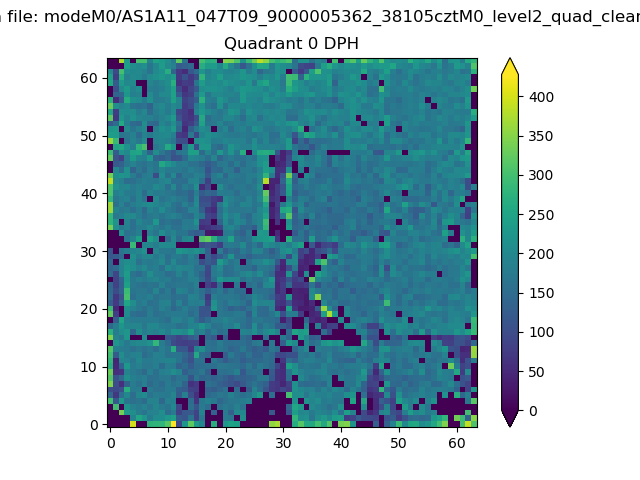 |
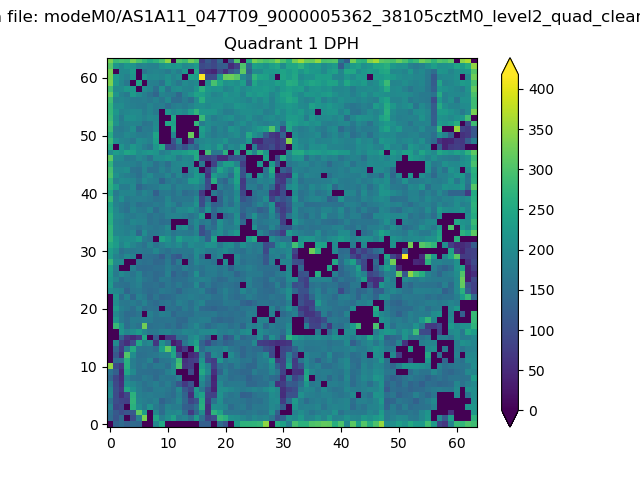 |
Quadrant B |
|---|---|---|---|
| Quadrant D | 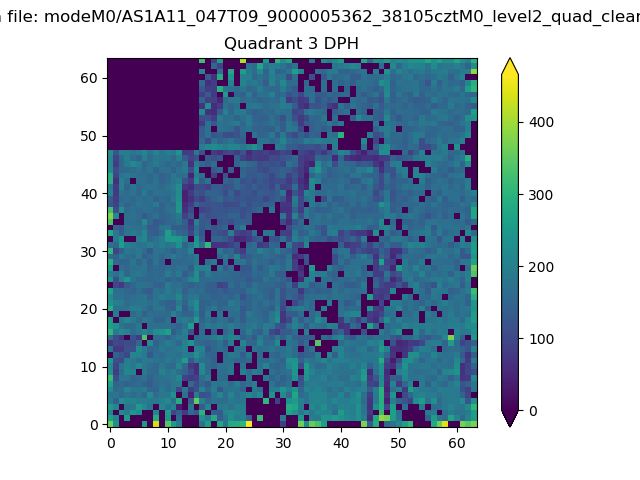 |
 |
Quadrant C |
| Plot type | Count rate plots | Images |
|---|---|---|
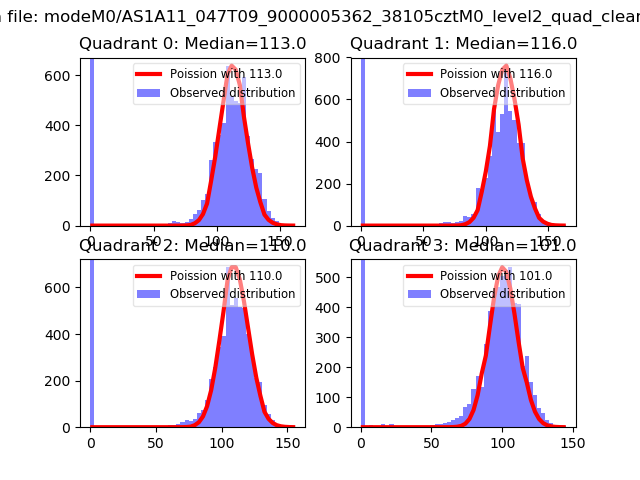
| Comparison with Poisson distribution Blue bars denote a histogram of data divided into 1 sec bins. Red curve is a Poisson curve with rate = median count rate of data. |
 |
 |
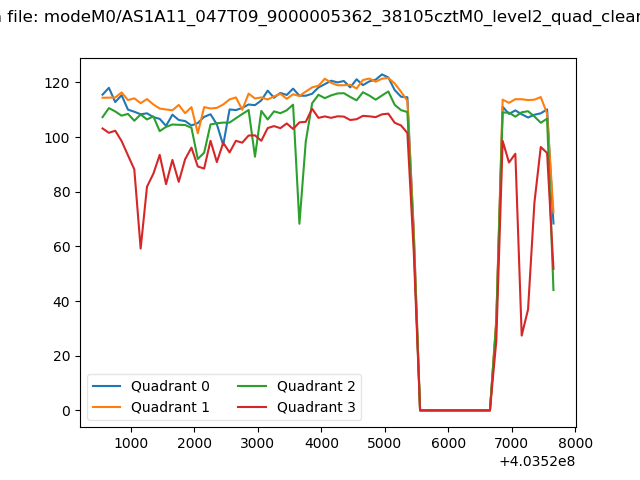
| Quadrant-wise count rates Data is divided into 100 sec bins |
 |
|
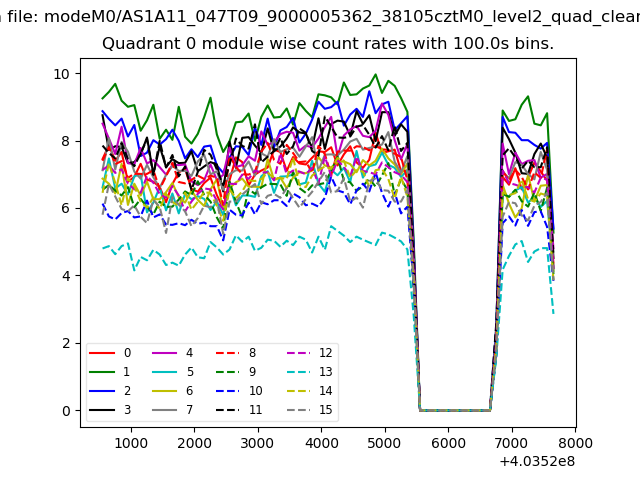
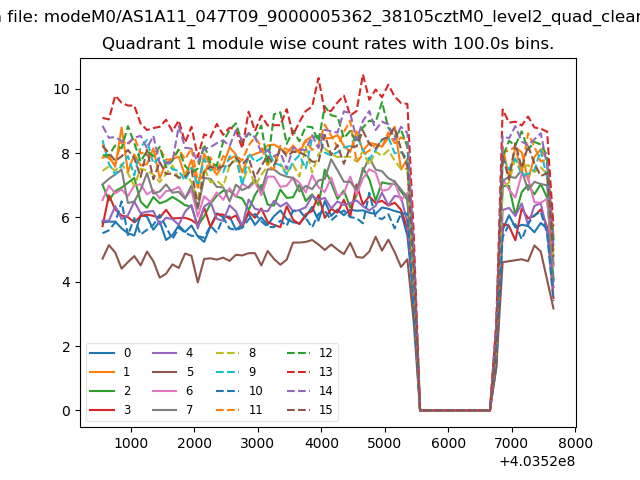
| Module-wise count rates for Quadrant A Data is divided into 100 sec bins |
 |
 |
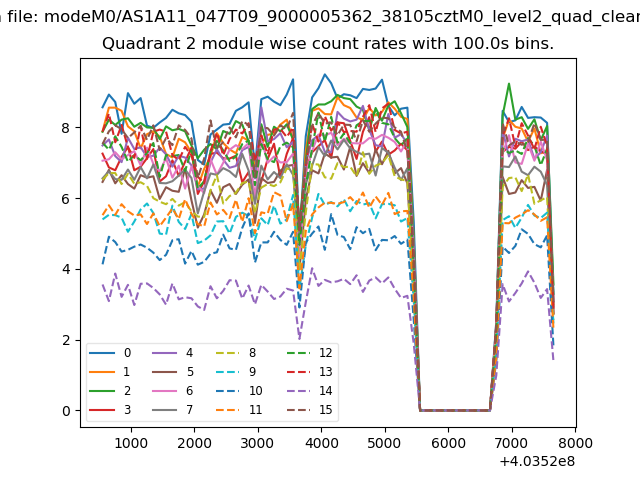
| Module-wise count rates for Quadrant B Data is divided into 100 sec bins |
 |
 |
| Module-wise count rates for Quadrant C Data is divided into 100 sec bins |
 |
 |
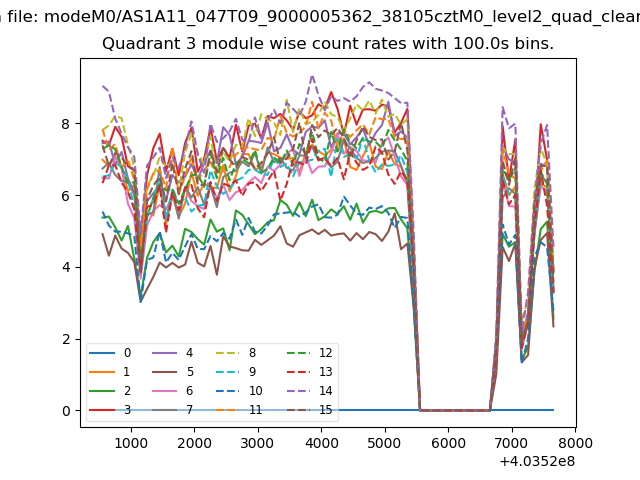
| Module-wise count rates for Quadrant D Data is divided into 100 sec bins |
 |
 |
| Parameter | Plot |
|---|---|
| CZT HV Monitor | 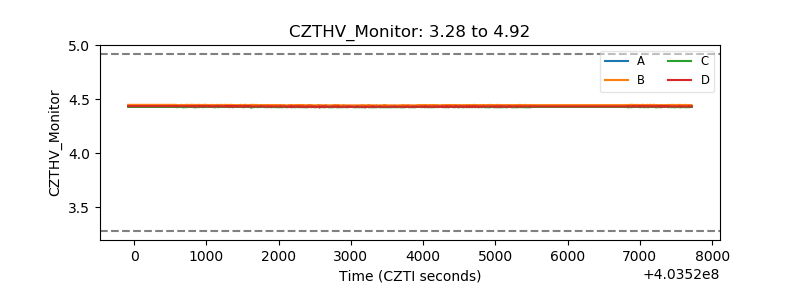 |
| D_VDD | 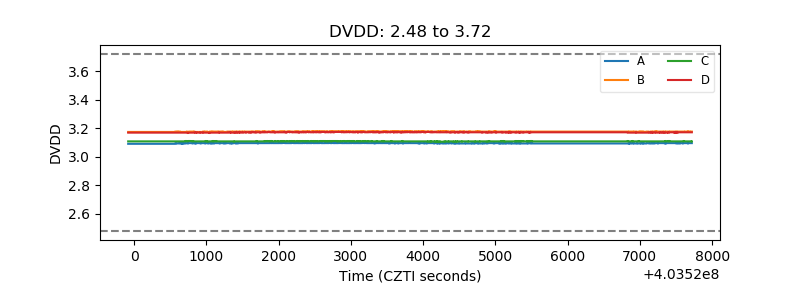 |
| Temperature 1 | 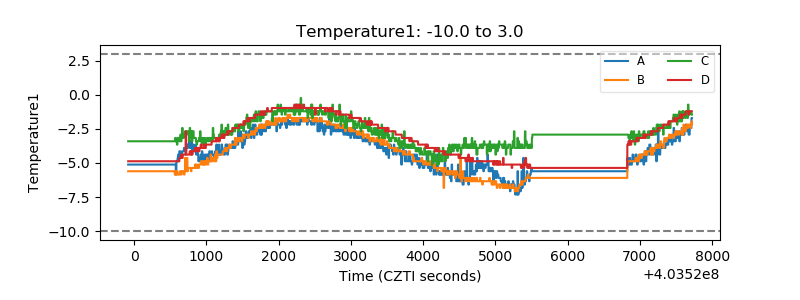 |
| Veto HV Monitor | 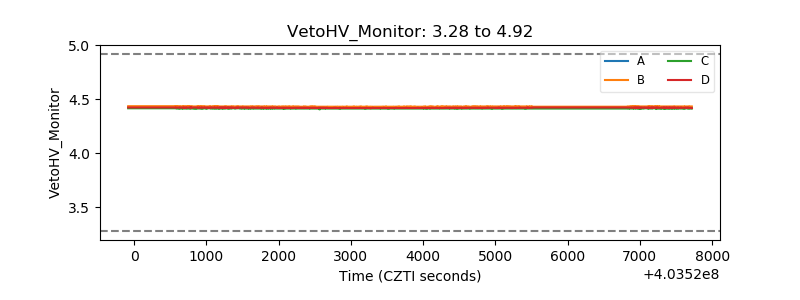 |
| Veto LLD | 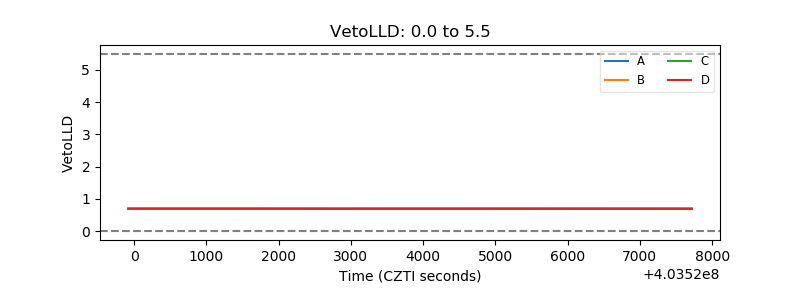 |
| Alpha Counter | 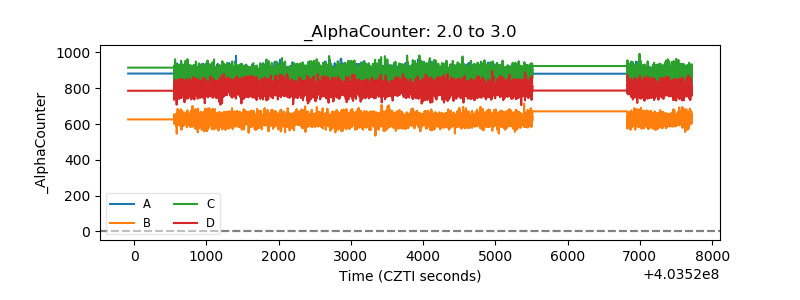 |
| _CPM_Rate | 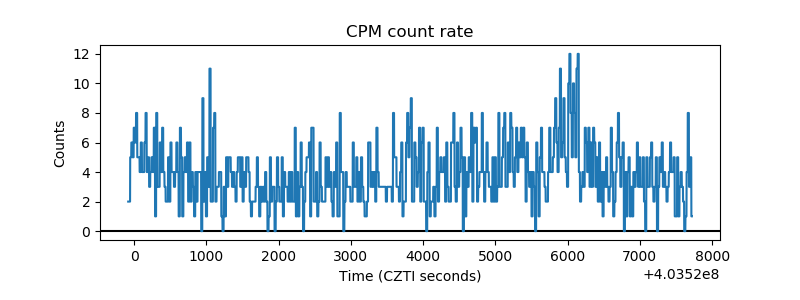 |
| CZT Counter | 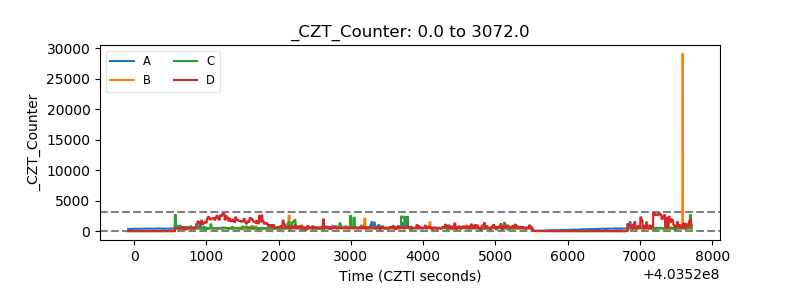 |
| +2.5 Volts monitor | 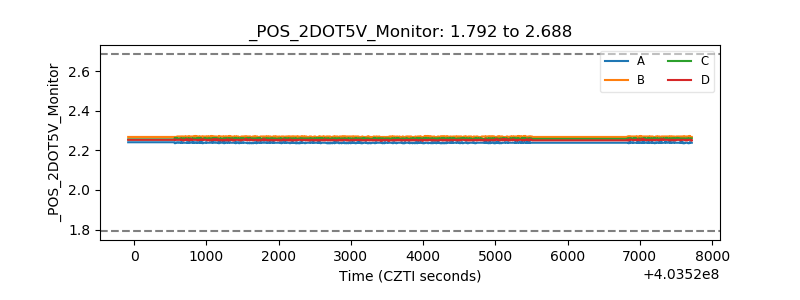 |
| +5 Volts monitor | 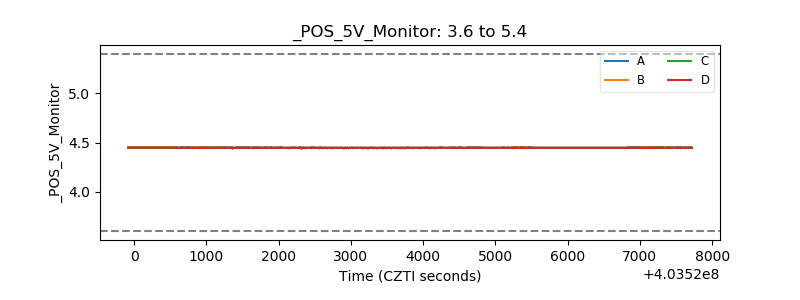 |
| _ROLL_ROT | 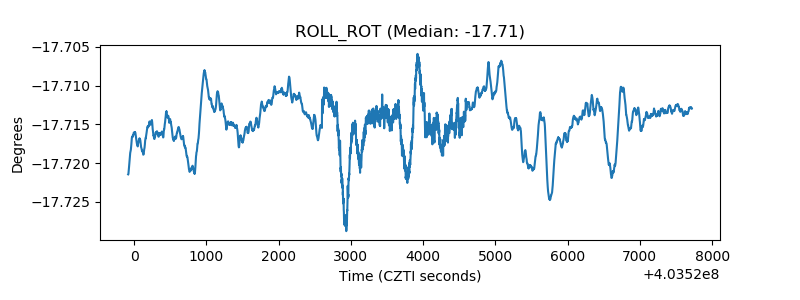 |
| _Roll_DEC | 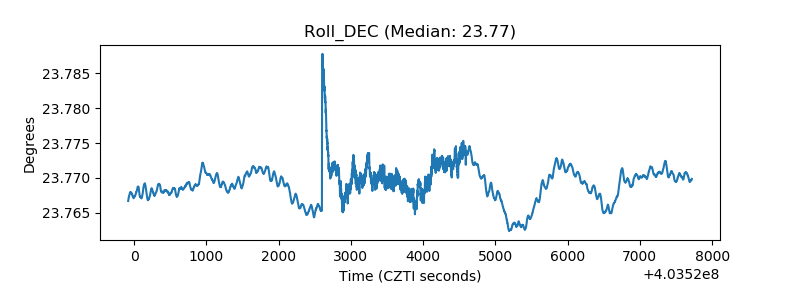 |
| _Roll_RA | 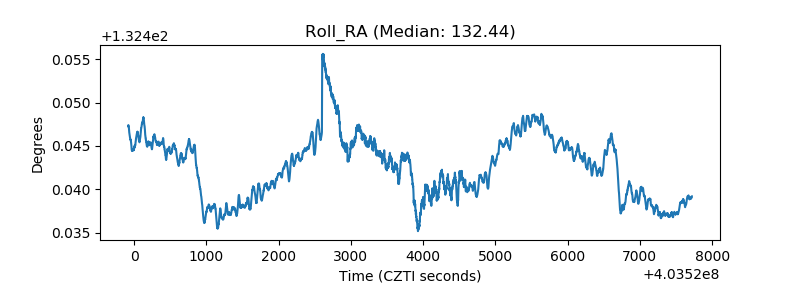 |
| Veto Counter |  |