| Param | Original file | Final file |
|---|---|---|
| Filename | modeM0/AS1A11_047T09_9000005362_38106cztM0_level2.fits | modeM0/AS1A11_047T09_9000005362_38106cztM0_level2_quad_clean.evt |
| Size (bytes) | 427,443,840 | 79,248,960 |
| Size | 407.6 MB | 75.6 MB |
| Events in quadrant A | 2,714,687 | 560,195 |
| Events in quadrant B | 2,684,376 | 559,377 |
| Events in quadrant C | 3,660,755 | 508,027 |
| Events in quadrant D | 6,378,065 | 425,005 |
| Mode M0 | |||
|---|---|---|---|
| Quadrant | BADHDUFLAG | Total packets | Discarded packets |
| A | 0 | 10987 | 16 |
| B | 0 | 11174 | 7 |
| C | 0 | 13935 | 5 |
| D | 0 | 22504 | 63 |
| Mode SS | |||
|---|---|---|---|
| Quadrant | BADHDUFLAG | Total packets | Discarded packets |
| A | 0 | 98 | 0 |
| B | 0 | 98 | 0 |
| C | 0 | 98 | 0 |
| D | 0 | 98 | 0 |
| Mode M9 | |||
|---|---|---|---|
| Quadrant | BADHDUFLAG | Total packets | Discarded packets |
| A | 0 | 7 | 0 |
| B | 0 | 6 | 0 |
| C | 0 | 6 | 0 |
| D | 0 | 7 | 0 |
| Quadrant | Total seconds | Saturated seconds | Saturation percentage |
|---|---|---|---|
| A | 4946 | 13 | 0.262839% |
| B | 4952 | 123 | 2.483845% |
| C | 4953 | 376 | 7.591359% |
| D | 4944 | 943 | 19.073625% |
Noise dominated data is calculated using 1-second bins in cleaned event files. If a bin has >2000 counts, and if more than 50% of those come from <1% of pixels, then it is considered to be noise-dominated and hence unusable.
| Quadrant | # 1 sec bins | Bins with >0 counts | Bins with >2000 counts | High rate bins dominated by noise | Noise dominated (total time) | Noise dominated (detector-on time) | Marked lightcurve |
|---|---|---|---|---|---|---|---|
| A | 4956 | 4953 | 4 | 4 | 0.08% | 0.08% | 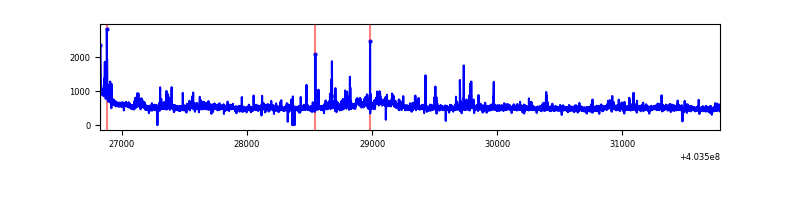 |
| B | 4956 | 4955 | 92 | 92 | 1.86% | 1.86% | 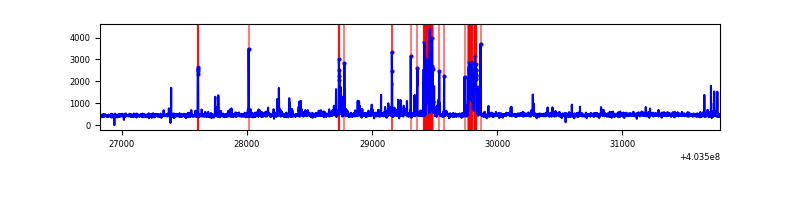 |
| C | 4956 | 4955 | 342 | 342 | 6.90% | 6.90% | 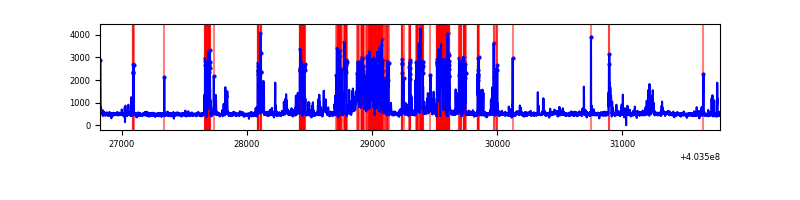 |
| D | 4956 | 4952 | 924 | 924 | 18.64% | 18.66% | 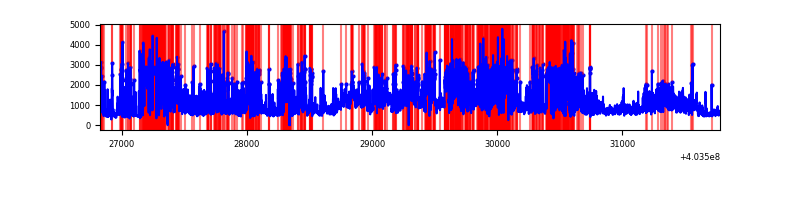 |
Top three noisy pixels from each quadrant. If the there are fewer than three noisy pixels in the level2.evt file, extra rows are filled as -1
| Pixel properties | Quadrant properties | ||||||
|---|---|---|---|---|---|---|---|
| Quadrant | DetID | PixID | Counts | Sigma | Mean | Median | Sigma |
| A | 10 | 83 | 286944 | 2476.84 | 564 | 553 | 115.6 |
| A | 12 | 189 | 110349 | 949.57 | 564 | 553 | 115.6 |
| A | 12 | 16 | 46624 | 398.44 | 564 | 553 | 115.6 |
| B | 5 | 172 | 272466 | 2500.17 | 557 | 542 | 108.8 |
| B | 0 | 229 | 178543 | 1636.61 | 557 | 542 | 108.8 |
| B | 12 | 111 | 13792 | 121.83 | 557 | 542 | 108.8 |
| C | 1 | 23 | 1167514 | 9308.92 | 529 | 531 | 125.4 |
| C | 15 | 214 | 197735 | 1573.08 | 529 | 531 | 125.4 |
| C | 14 | 254 | 155199 | 1233.77 | 529 | 531 | 125.4 |
| D | 13 | 138 | 1786450 | 14135.24 | 506 | 491 | 126.3 |
| D | 12 | 235 | 1048658 | 8295.88 | 506 | 491 | 126.3 |
| D | 1 | 20 | 981425 | 7763.75 | 506 | 491 | 126.3 |
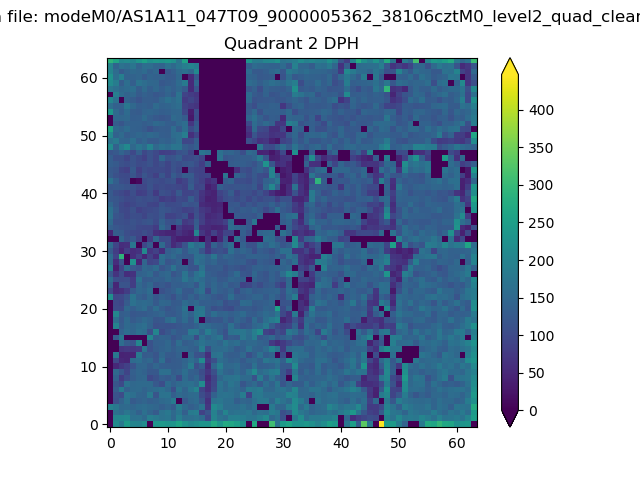
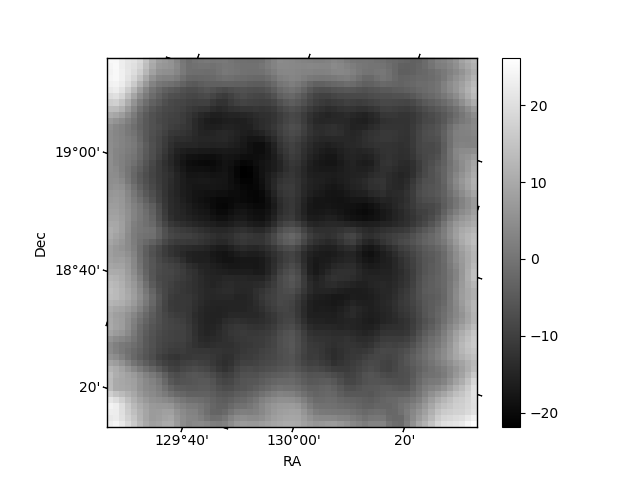
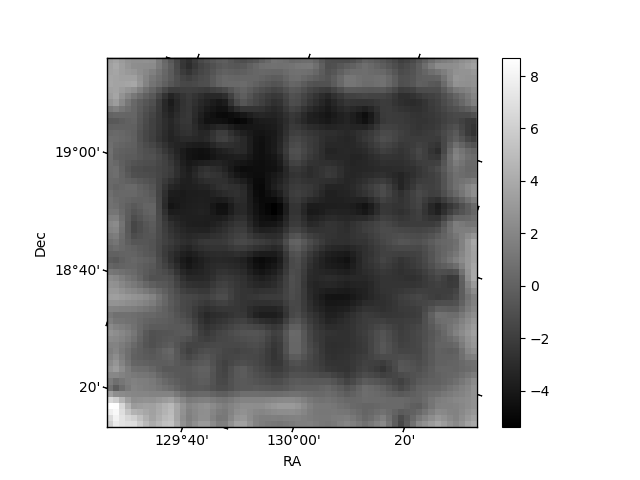
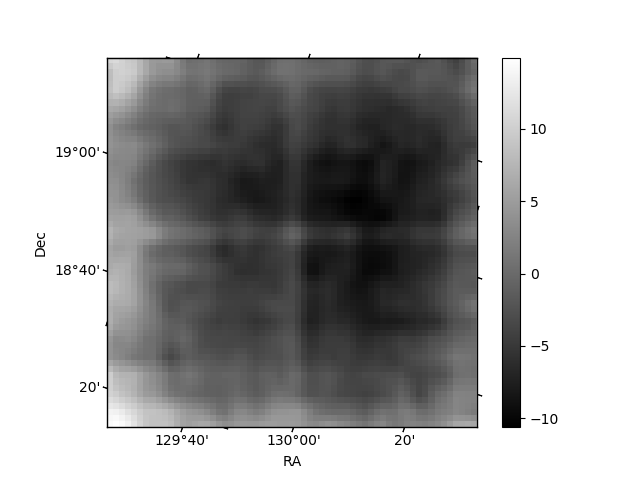
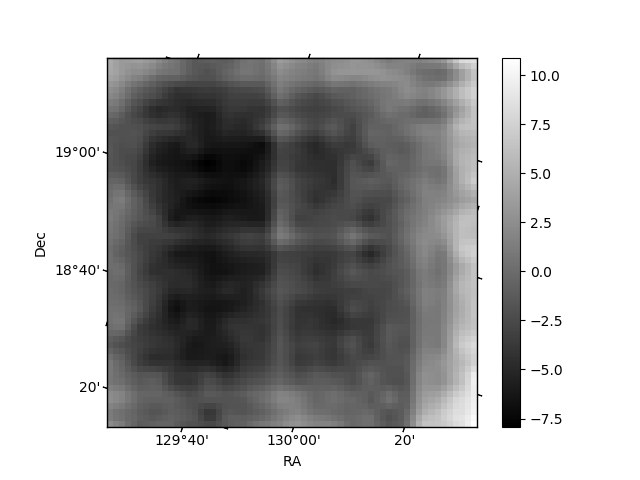
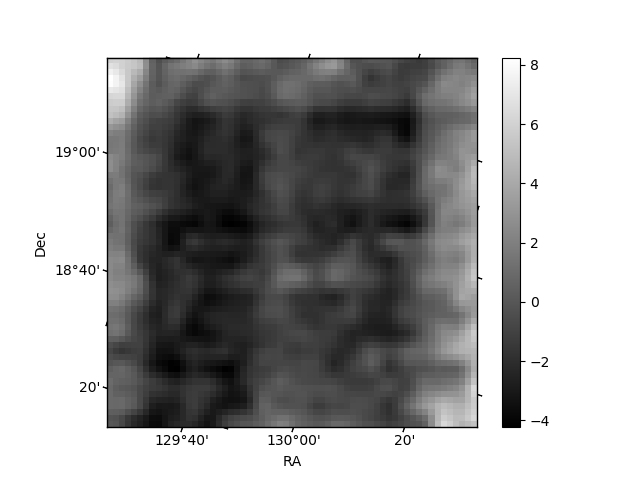
Histogram calculated using DETX and DETY for each event in the final _common_clean file
| Quadrant A | 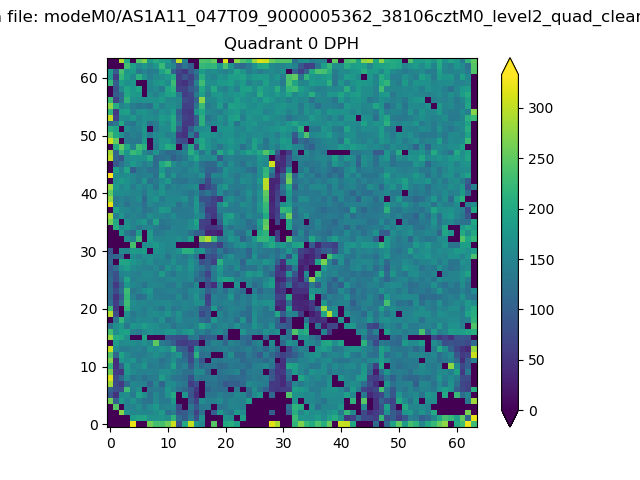 |
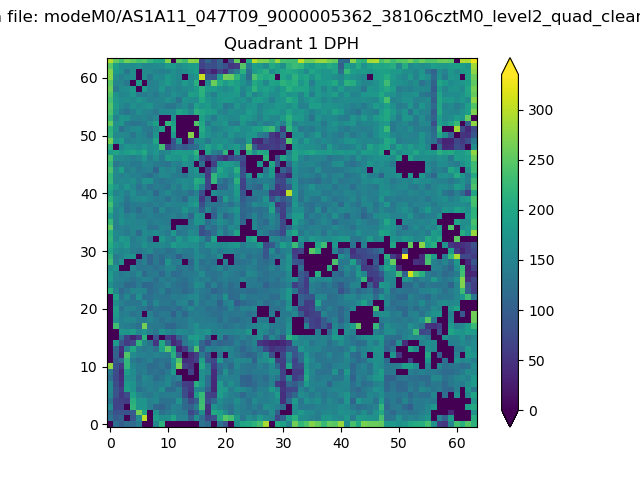 |
Quadrant B |
|---|---|---|---|
| Quadrant D | 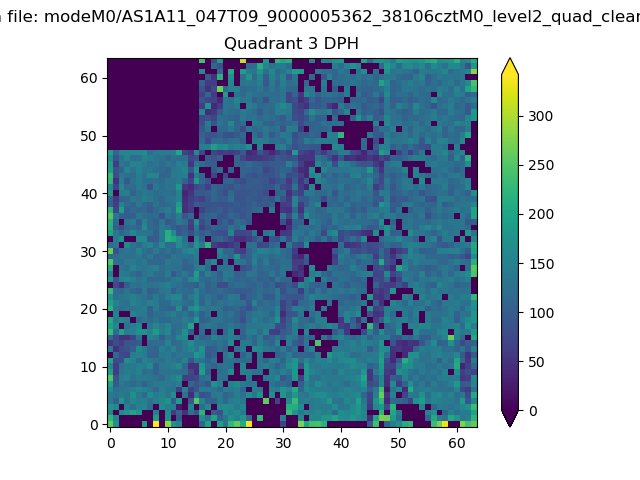 |
 |
Quadrant C |
| Plot type | Count rate plots | Images |
|---|---|---|
| Comparison with Poisson distribution Blue bars denote a histogram of data divided into 1 sec bins. Red curve is a Poisson curve with rate = median count rate of data. |
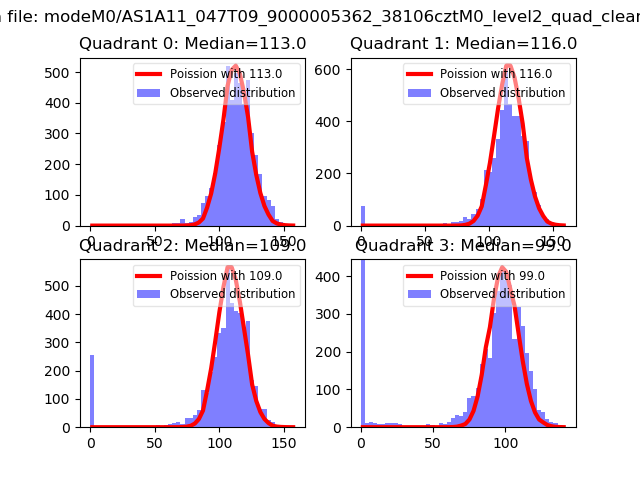 |
 |
| Quadrant-wise count rates Data is divided into 100 sec bins |
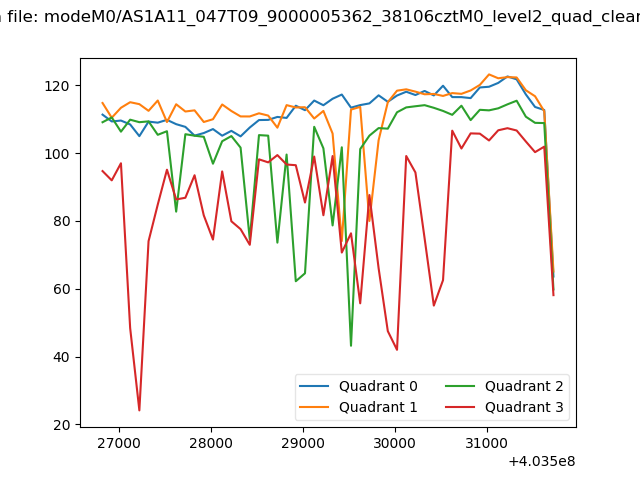 |
|
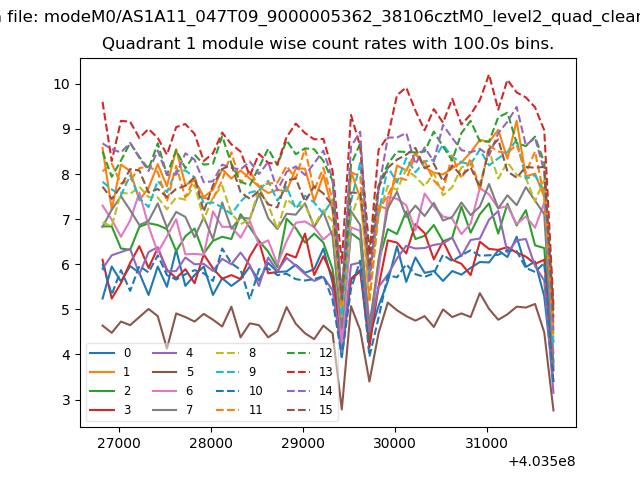
| Module-wise count rates for Quadrant A Data is divided into 100 sec bins |
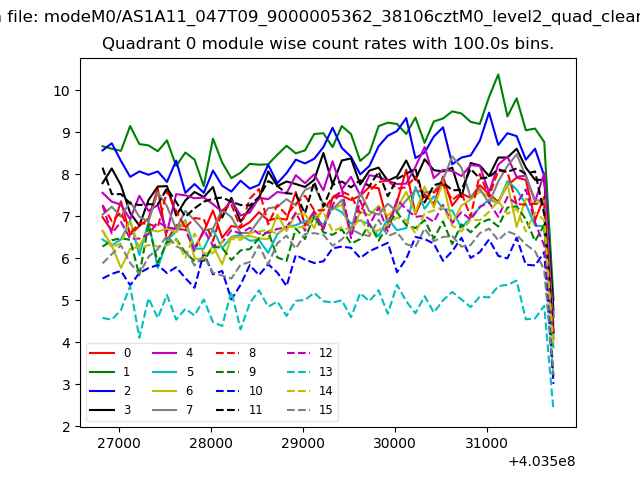 |
 |
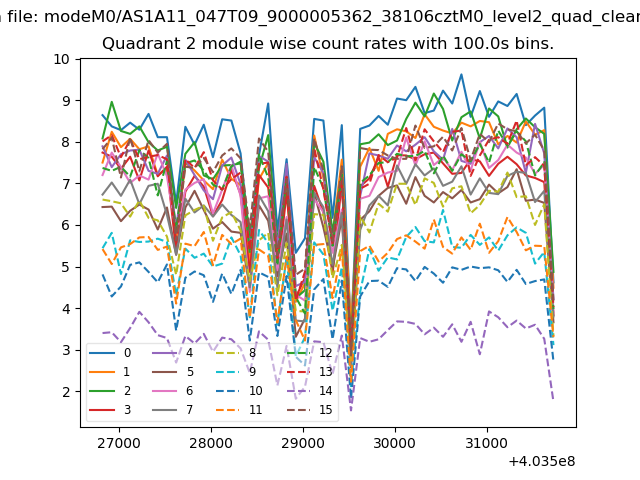
| Module-wise count rates for Quadrant B Data is divided into 100 sec bins |
 |
 |
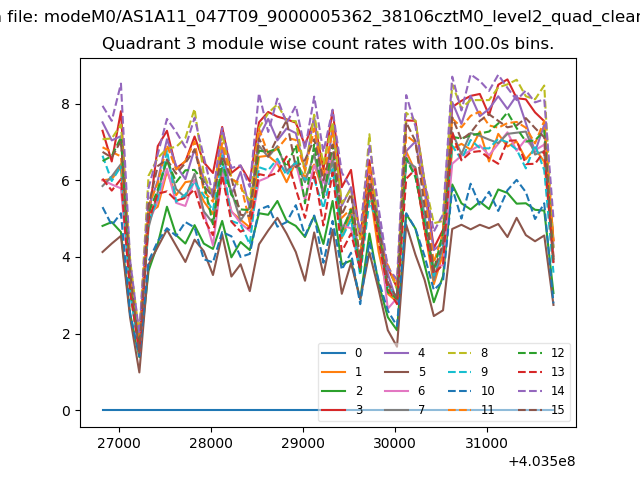
| Module-wise count rates for Quadrant C Data is divided into 100 sec bins |
 |
 |
| Module-wise count rates for Quadrant D Data is divided into 100 sec bins |
 |
 |
| Parameter | Plot |
|---|---|
| CZT HV Monitor | 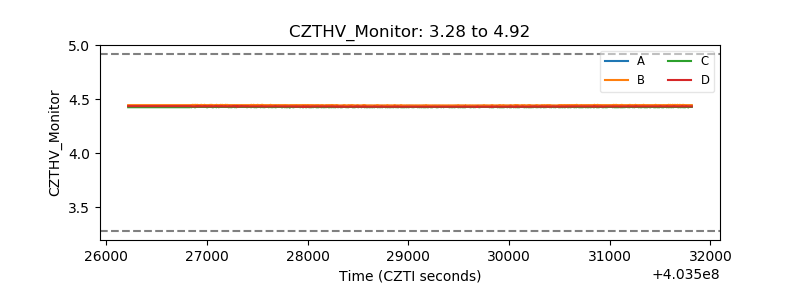 |
| D_VDD | 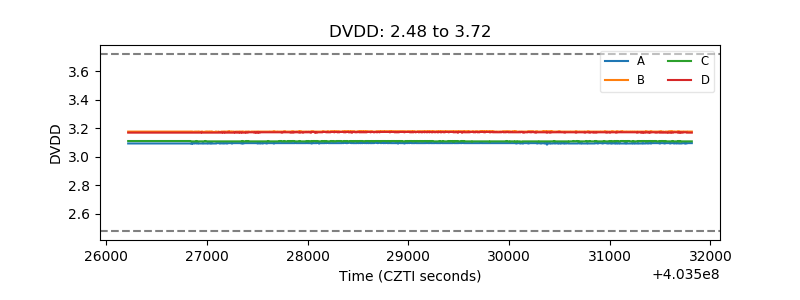 |
| Temperature 1 | 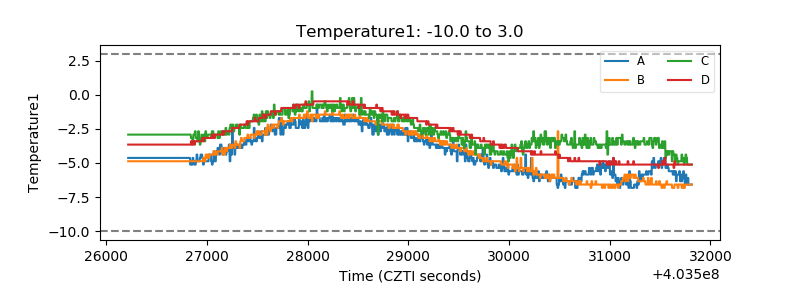 |
| Veto HV Monitor | 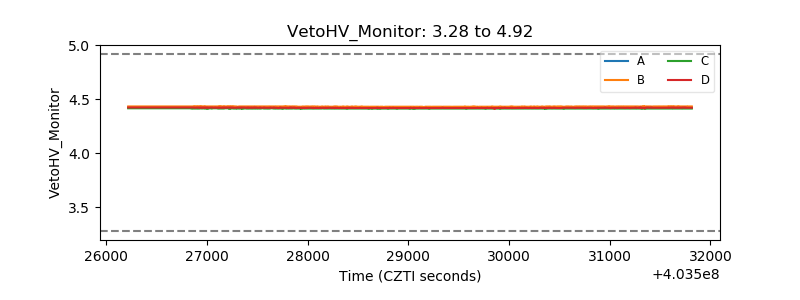 |
| Veto LLD | 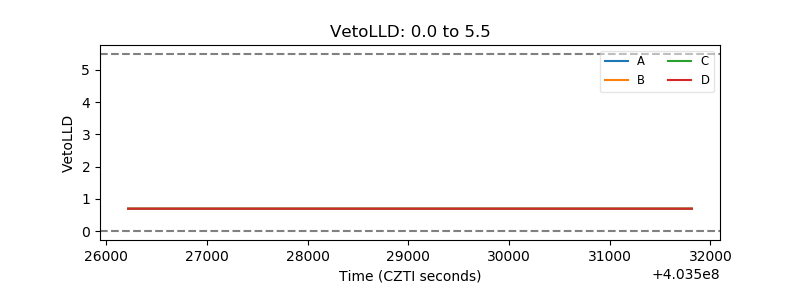 |
| Alpha Counter | 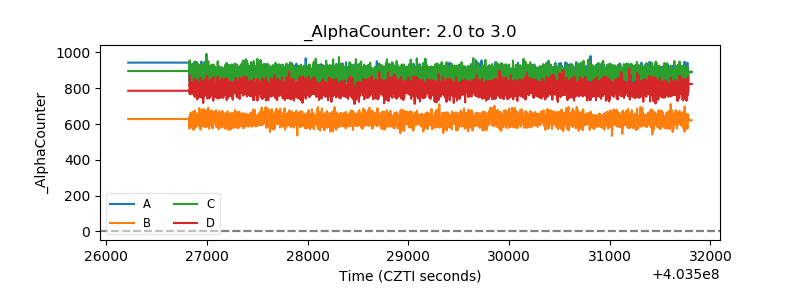 |
| _CPM_Rate | 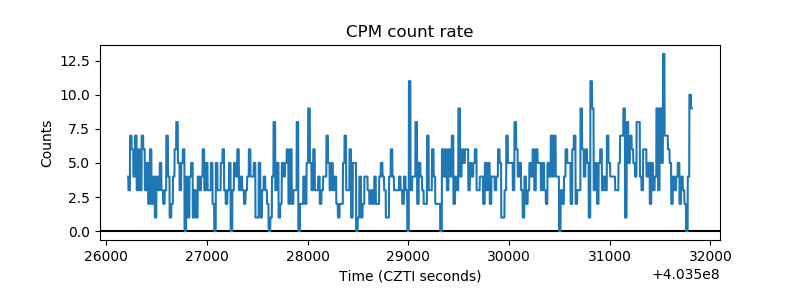 |
| CZT Counter | 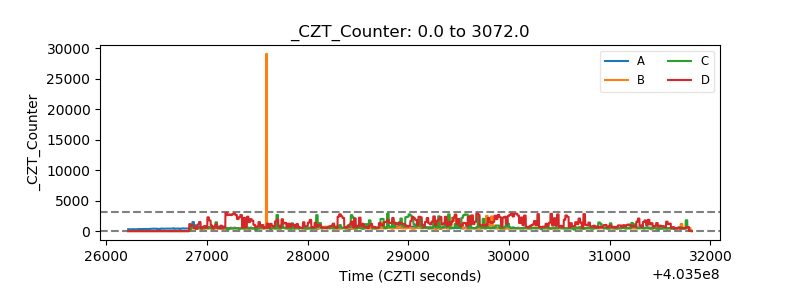 |
| +2.5 Volts monitor | 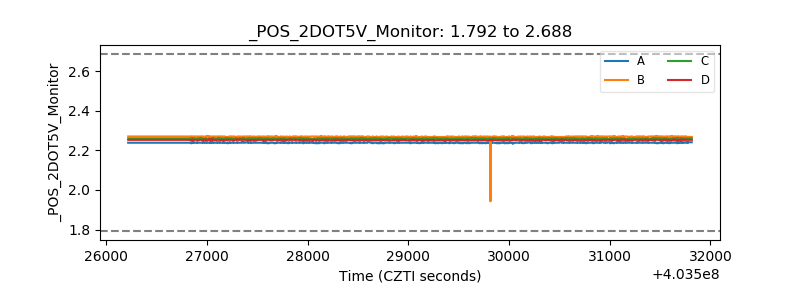 |
| +5 Volts monitor | 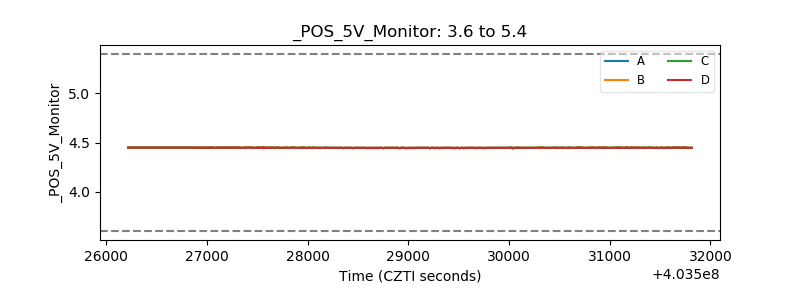 |
| _ROLL_ROT | 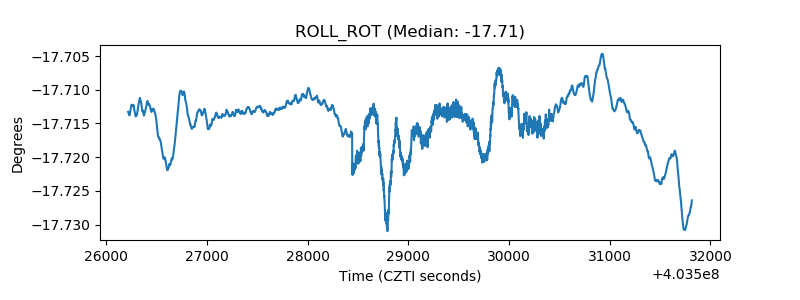 |
| _Roll_DEC | 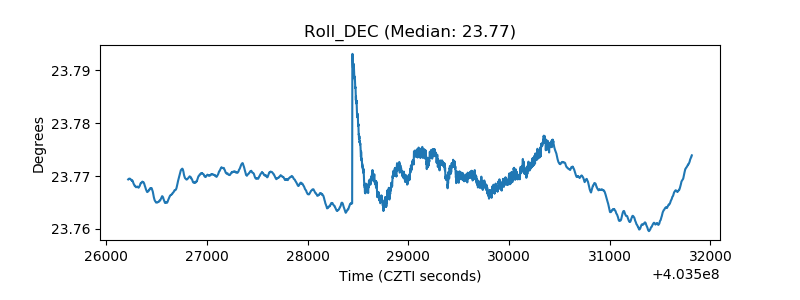 |
| _Roll_RA | 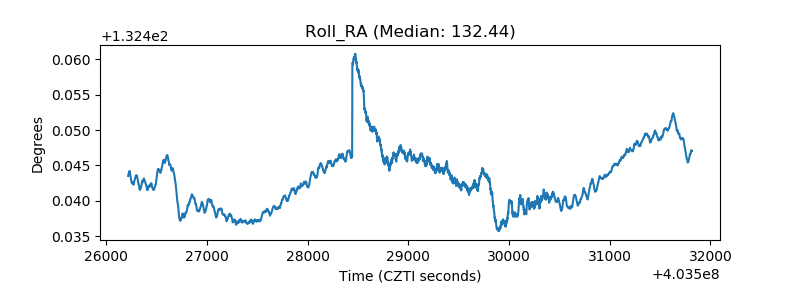 |
| Veto Counter | 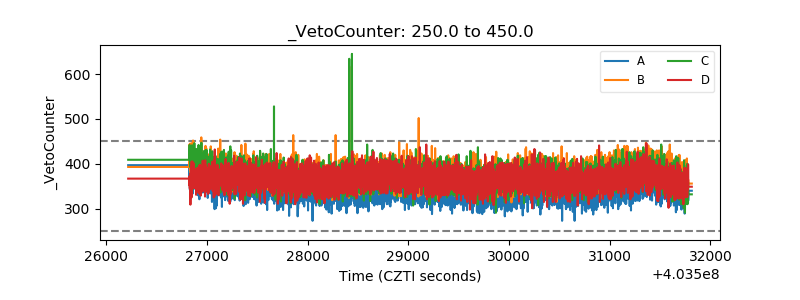 |