| Param | Original file | Final file |
|---|---|---|
| Filename | modeM0/AS1A11_047T09_9000005362_38108cztM0_level2.fits | modeM0/AS1A11_047T09_9000005362_38108cztM0_level2_quad_clean.evt |
| Size (bytes) | 282,055,680 | 61,502,400 |
| Size | 269.0 MB | 58.7 MB |
| Events in quadrant A | 2,406,115 | 416,061 |
| Events in quadrant B | 1,965,489 | 421,501 |
| Events in quadrant C | 2,050,572 | 395,612 |
| Events in quadrant D | 3,728,182 | 365,216 |
| Mode M0 | |||
|---|---|---|---|
| Quadrant | BADHDUFLAG | Total packets | Discarded packets |
| A | 0 | 9457 | 25 |
| B | 0 | 8185 | 5 |
| C | 0 | 8292 | 15 |
| D | 0 | 13690 | 44 |
| Mode SS | |||
|---|---|---|---|
| Quadrant | BADHDUFLAG | Total packets | Discarded packets |
| A | 0 | 78 | 0 |
| B | 0 | 78 | 0 |
| C | 0 | 78 | 0 |
| D | 0 | 78 | 0 |
| Mode M9 | |||
|---|---|---|---|
| Quadrant | BADHDUFLAG | Total packets | Discarded packets |
| A | 0 | 13 | 0 |
| B | 0 | 13 | 0 |
| C | 0 | 13 | 0 |
| D | 0 | 13 | 0 |
| Quadrant | Total seconds | Saturated seconds | Saturation percentage |
|---|---|---|---|
| A | 3722 | 38 | 1.020956% |
| B | 3731 | 39 | 1.045296% |
| C | 3726 | 67 | 1.798175% |
| D | 3721 | 146 | 3.923676% |
Noise dominated data is calculated using 1-second bins in cleaned event files. If a bin has >2000 counts, and if more than 50% of those come from <1% of pixels, then it is considered to be noise-dominated and hence unusable.
| Quadrant | # 1 sec bins | Bins with >0 counts | Bins with >2000 counts | High rate bins dominated by noise | Noise dominated (total time) | Noise dominated (detector-on time) | Marked lightcurve |
|---|---|---|---|---|---|---|---|
| A | 5047 | 3731 | 24 | 24 | 0.48% | 0.64% | 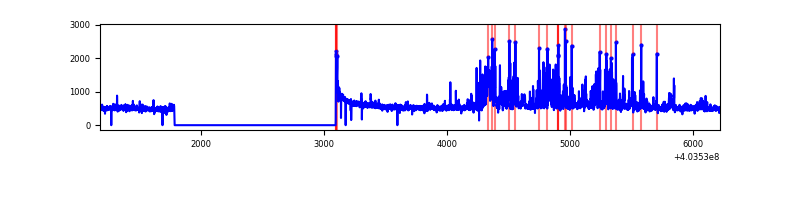 |
| B | 5047 | 3734 | 27 | 27 | 0.53% | 0.72% | 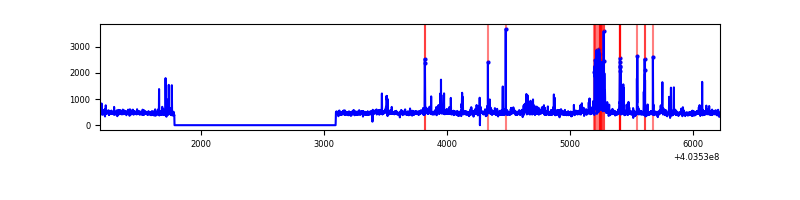 |
| C | 5047 | 3732 | 55 | 55 | 1.09% | 1.47% | 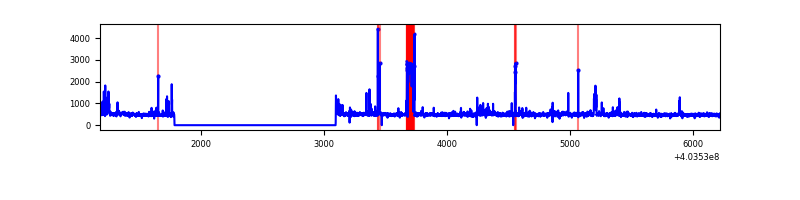 |
| D | 5047 | 3730 | 148 | 148 | 2.93% | 3.97% | 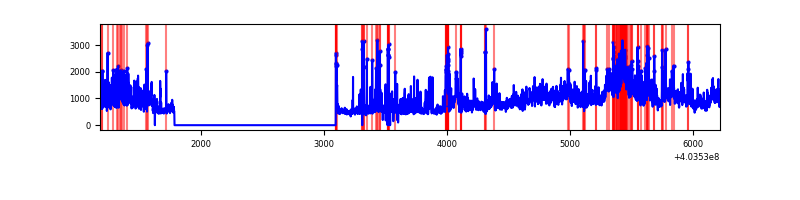 |
Top three noisy pixels from each quadrant. If the there are fewer than three noisy pixels in the level2.evt file, extra rows are filled as -1
| Pixel properties | Quadrant properties | ||||||
|---|---|---|---|---|---|---|---|
| Quadrant | DetID | PixID | Counts | Sigma | Mean | Median | Sigma |
| A | 12 | 16 | 324440 | 3642.24 | 426 | 416 | 89.0 |
| A | 10 | 83 | 241862 | 2714.01 | 426 | 416 | 89.0 |
| A | 12 | 189 | 122667 | 1374.18 | 426 | 416 | 89.0 |
| B | 0 | 229 | 123052 | 1469.59 | 423 | 412 | 83.5 |
| B | 5 | 172 | 105468 | 1258.88 | 423 | 412 | 83.5 |
| B | 0 | 189 | 24970 | 294.28 | 423 | 412 | 83.5 |
| C | 1 | 23 | 243246 | 2481.67 | 410 | 413 | 97.9 |
| C | 15 | 214 | 153409 | 1563.57 | 410 | 413 | 97.9 |
| C | 3 | 233 | 17966 | 179.39 | 410 | 413 | 97.9 |
| D | 12 | 235 | 1243997 | 12178.87 | 411 | 399 | 102.1 |
| D | 1 | 20 | 429421 | 4201.52 | 411 | 399 | 102.1 |
| D | 1 | 52 | 124779 | 1218.09 | 411 | 399 | 102.1 |
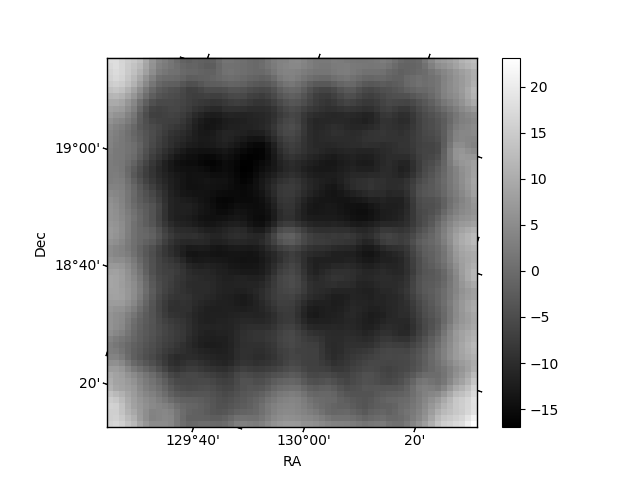
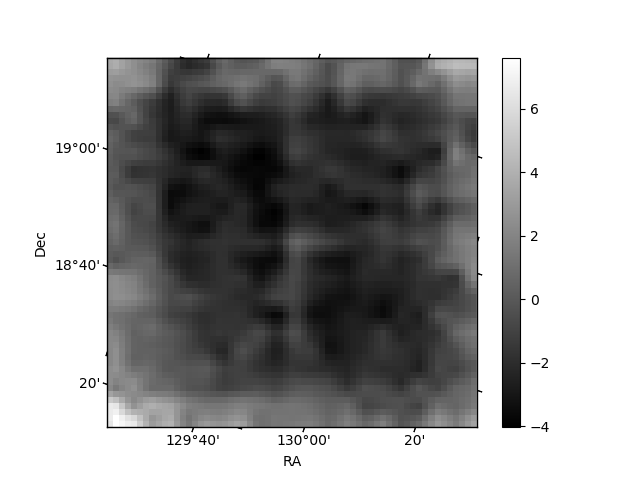
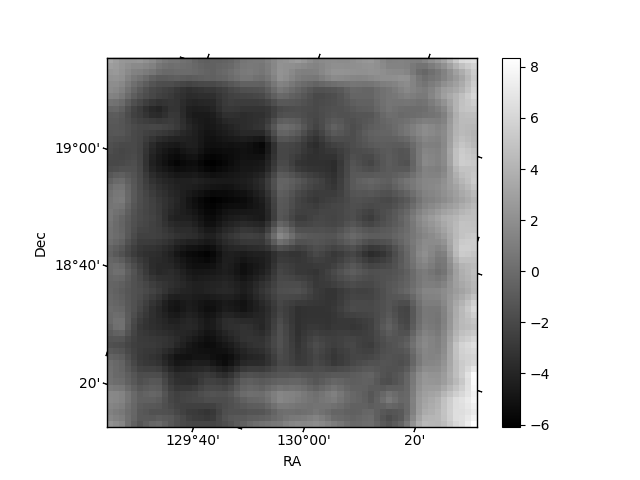
Histogram calculated using DETX and DETY for each event in the final _common_clean file
| Quadrant A | 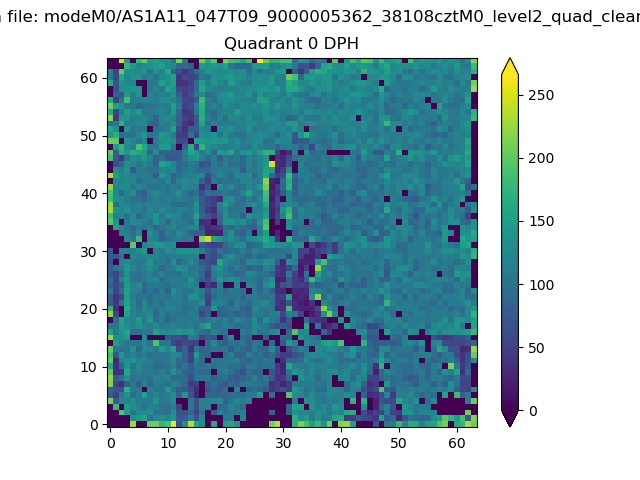 |
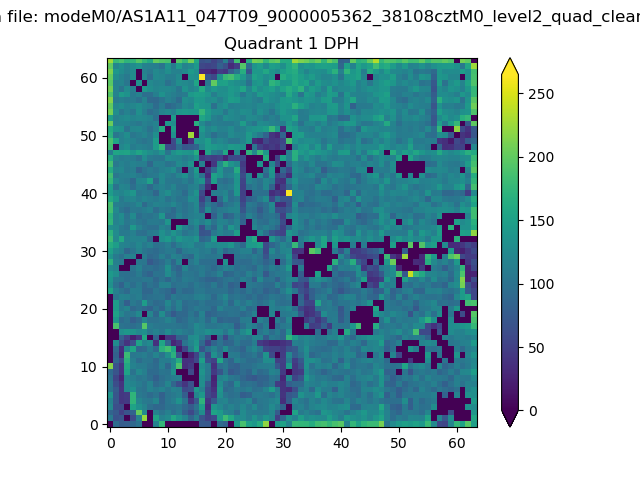 |
Quadrant B |
|---|---|---|---|
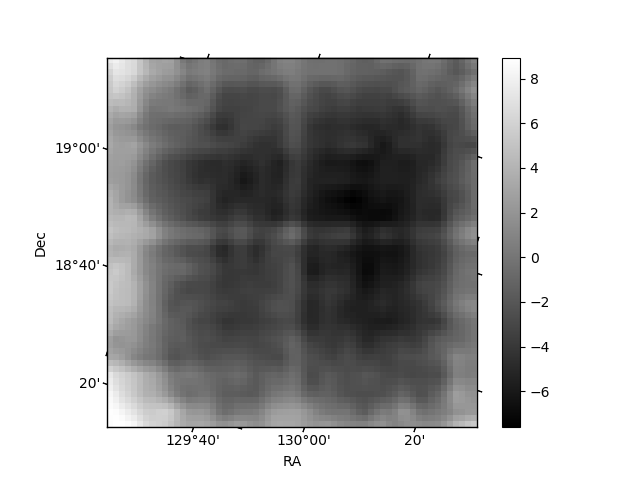
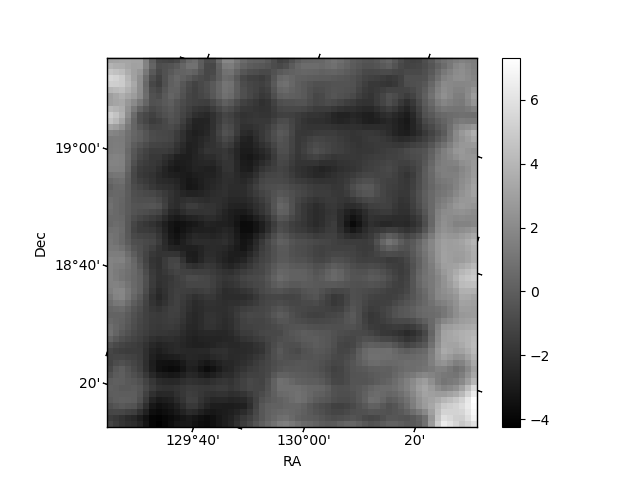
| Quadrant D | 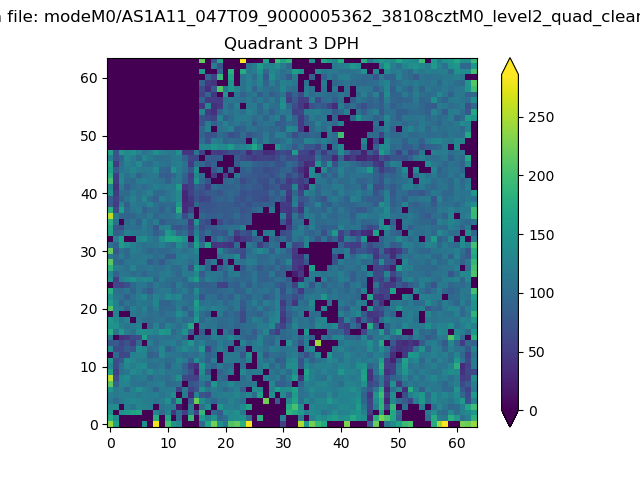 |
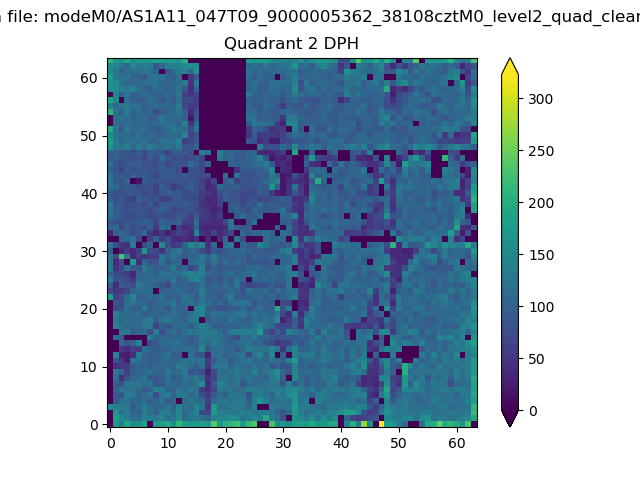 |
Quadrant C |
| Plot type | Count rate plots | Images |
|---|---|---|
| Comparison with Poisson distribution Blue bars denote a histogram of data divided into 1 sec bins. Red curve is a Poisson curve with rate = median count rate of data. |
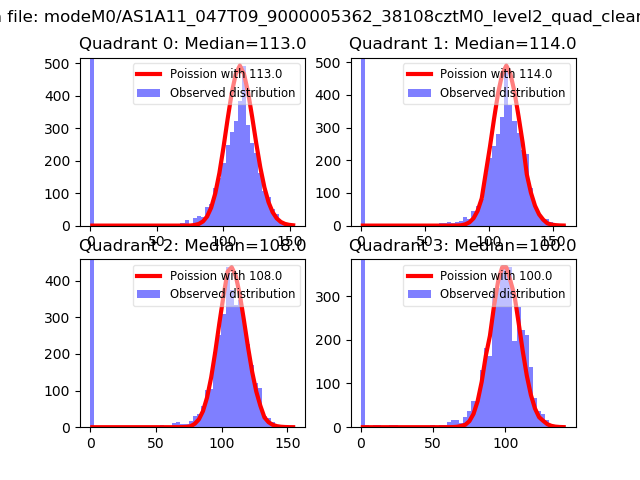 |
 |
| Quadrant-wise count rates Data is divided into 100 sec bins |
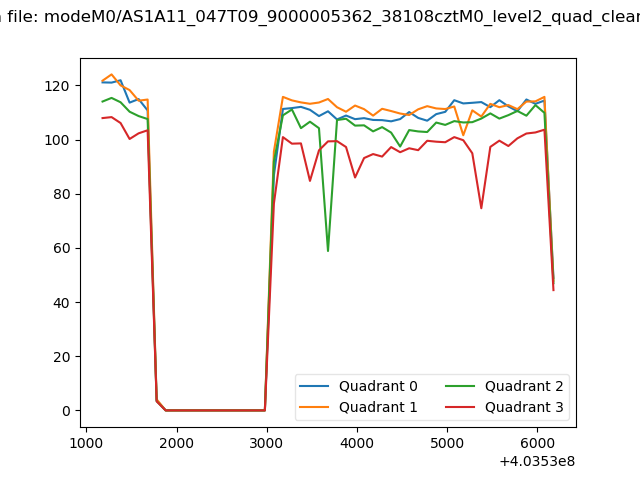 |
|
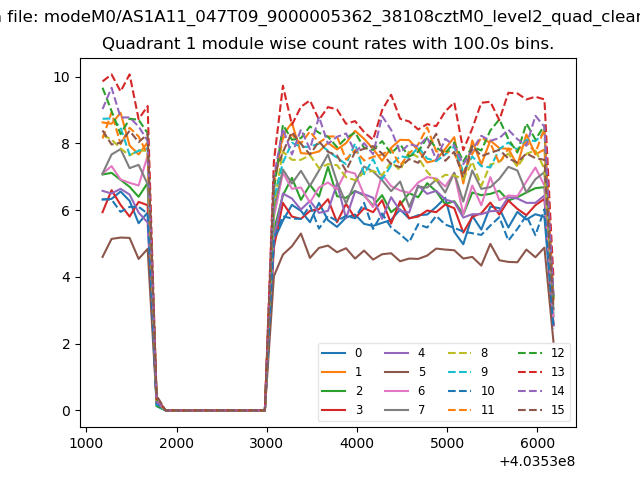
| Module-wise count rates for Quadrant A Data is divided into 100 sec bins |
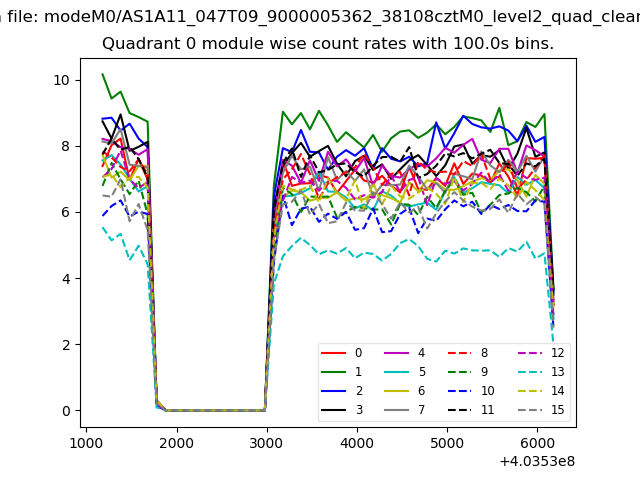 |
 |
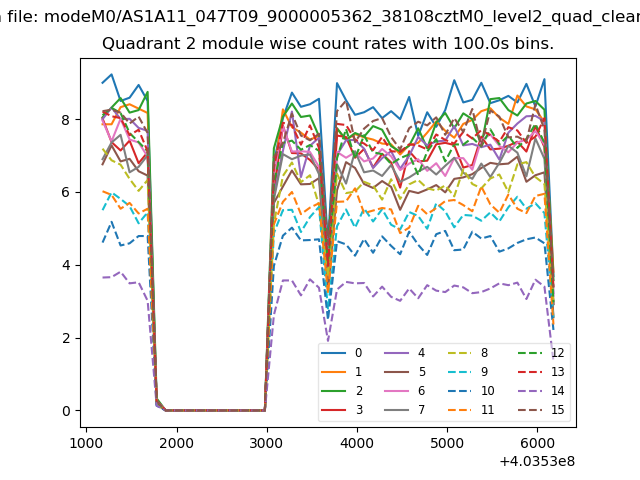
| Module-wise count rates for Quadrant B Data is divided into 100 sec bins |
 |
 |
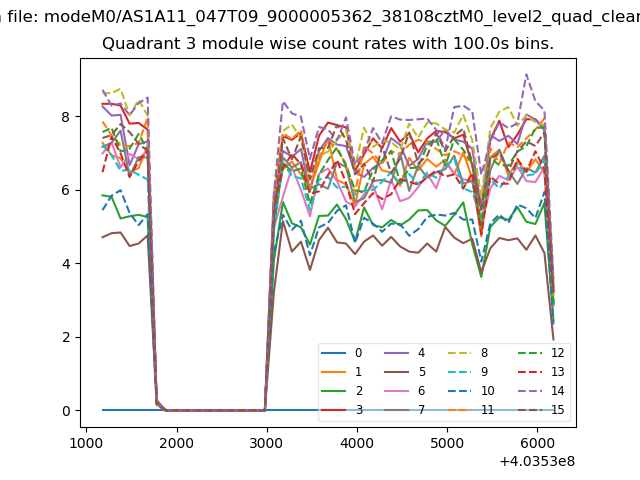
| Module-wise count rates for Quadrant C Data is divided into 100 sec bins |
 |
 |
| Module-wise count rates for Quadrant D Data is divided into 100 sec bins |
 |
 |
| Parameter | Plot |
|---|---|
| CZT HV Monitor | 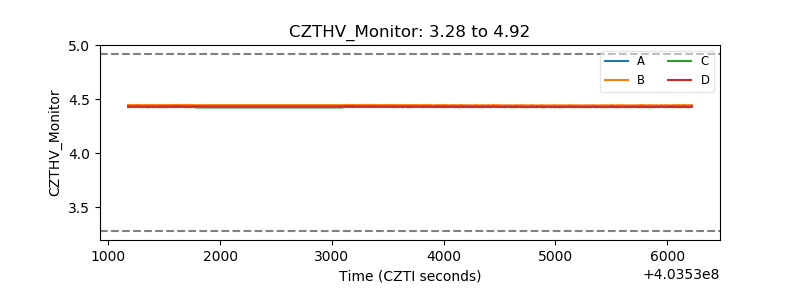 |
| D_VDD | 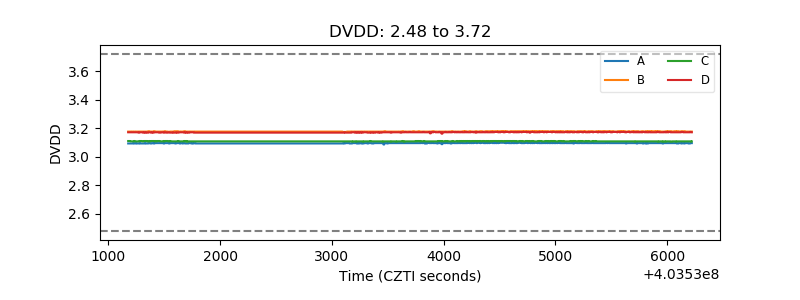 |
| Temperature 1 | 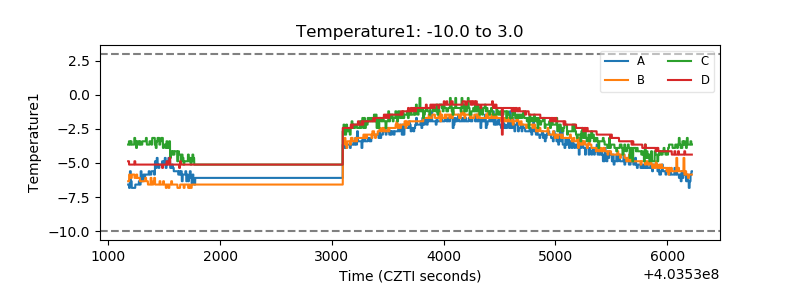 |
| Veto HV Monitor | 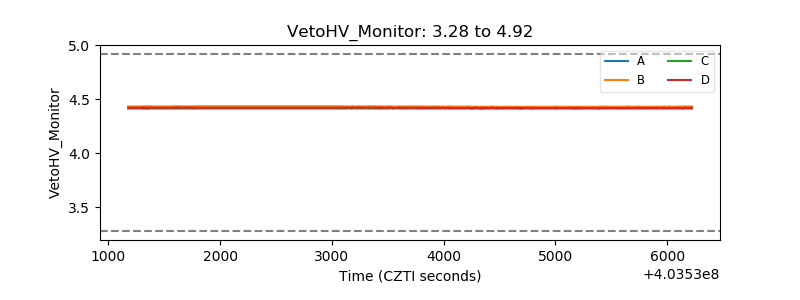 |
| Veto LLD | 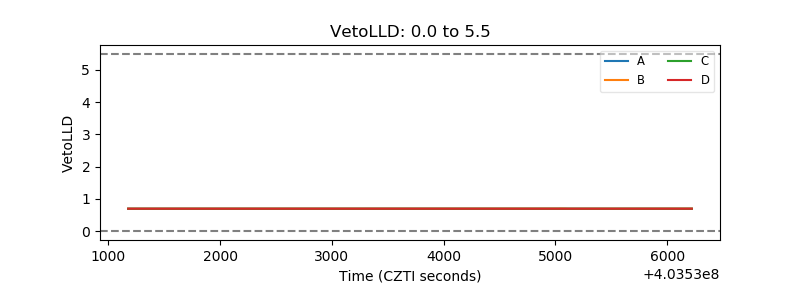 |
| Alpha Counter | 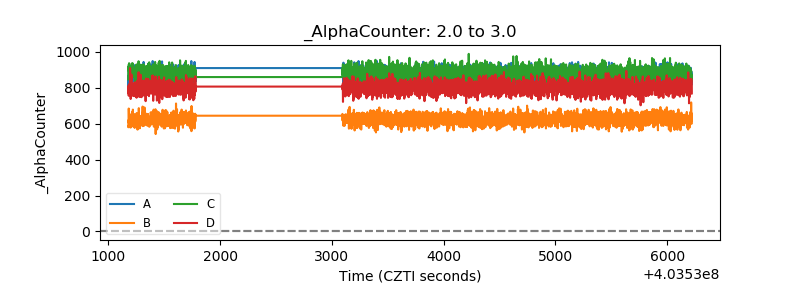 |
| _CPM_Rate | 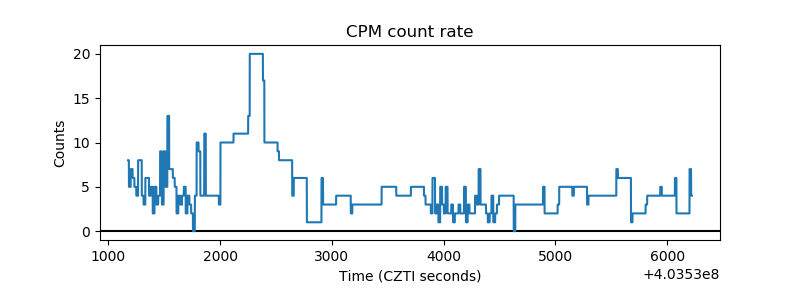 |
| CZT Counter | 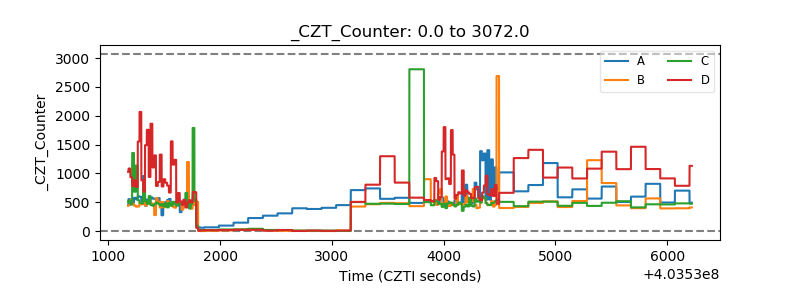 |
| +2.5 Volts monitor | 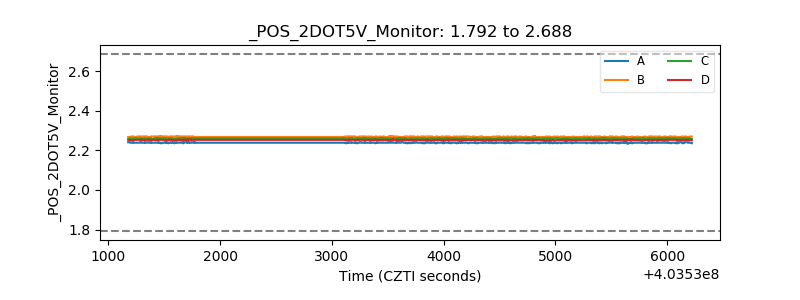 |
| +5 Volts monitor | 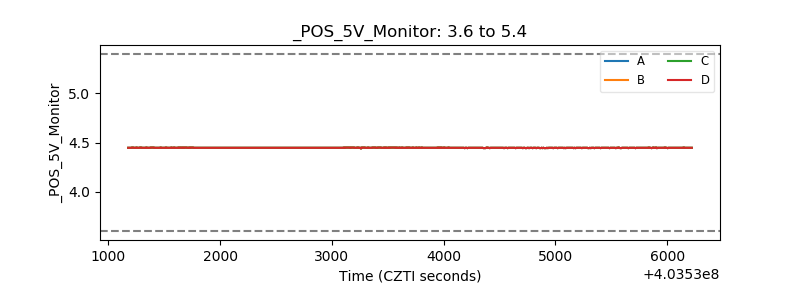 |
| _ROLL_ROT | 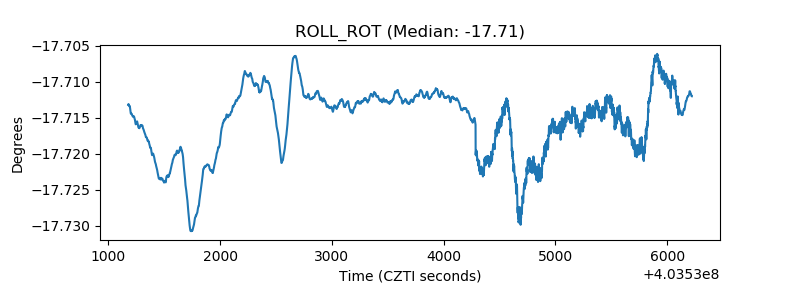 |
| _Roll_DEC | 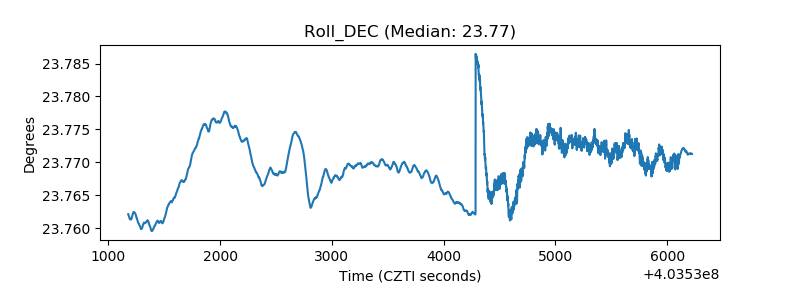 |
| _Roll_RA | 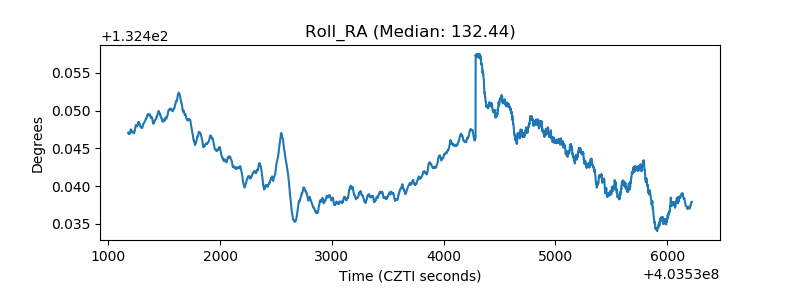 |
| Veto Counter | 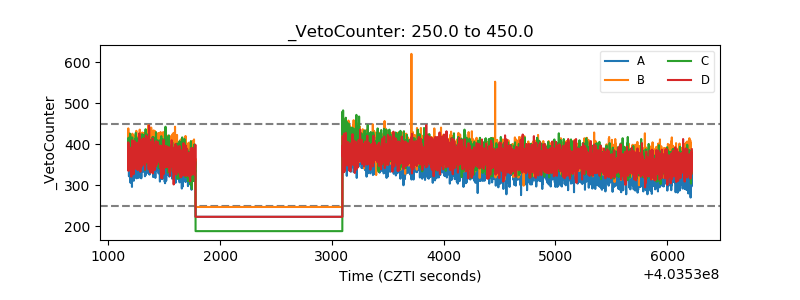 |