| Param | Original file | Final file |
|---|---|---|
| Filename | modeM0/AS1A11_065T21_9000005364_38108cztM0_level2.fits | modeM0/AS1A11_065T21_9000005364_38108cztM0_level2_quad_clean.evt |
| Size (bytes) | 541,123,200 | 117,584,640 |
| Size | 516.1 MB | 112.1 MB |
| Events in quadrant A | 5,286,104 | 792,313 |
| Events in quadrant B | 3,446,643 | 808,807 |
| Events in quadrant C | 3,708,045 | 770,914 |
| Events in quadrant D | 7,045,985 | 699,225 |
| Mode M9 | |||
|---|---|---|---|
| Quadrant | BADHDUFLAG | Total packets | Discarded packets |
| A | 0 | 29 | 0 |
| B | 0 | 29 | 0 |
| C | 0 | 29 | 0 |
| D | 0 | 29 | 0 |
| Mode M0 | |||
|---|---|---|---|
| Quadrant | BADHDUFLAG | Total packets | Discarded packets |
| A | 0 | 20408 | 53 |
| B | 0 | 14787 | 38 |
| C | 0 | 15233 | 70 |
| D | 0 | 26125 | 249 |
| Mode SS | |||
|---|---|---|---|
| Quadrant | BADHDUFLAG | Total packets | Discarded packets |
| A | 0 | 144 | 0 |
| B | 0 | 144 | 0 |
| C | 0 | 144 | 0 |
| D | 0 | 144 | 0 |
| Quadrant | Total seconds | Saturated seconds | Saturation percentage |
|---|---|---|---|
| A | 7033 | 199 | 2.829518% |
| B | 7032 | 51 | 0.725256% |
| C | 7020 | 48 | 0.683761% |
| D | 6992 | 301 | 4.304920% |
Noise dominated data is calculated using 1-second bins in cleaned event files. If a bin has >2000 counts, and if more than 50% of those come from <1% of pixels, then it is considered to be noise-dominated and hence unusable.
| Quadrant | # 1 sec bins | Bins with >0 counts | Bins with >2000 counts | High rate bins dominated by noise | Noise dominated (total time) | Noise dominated (detector-on time) | Marked lightcurve |
|---|---|---|---|---|---|---|---|
| A | 9923 | 7053 | 150 | 150 | 1.51% | 2.13% | 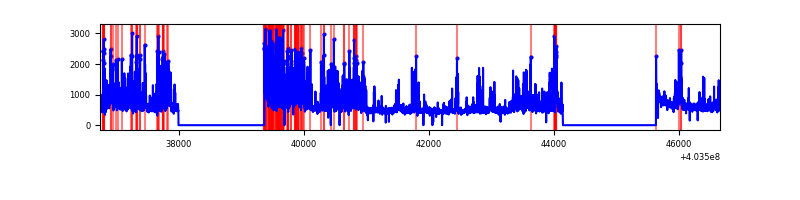 |
| B | 9923 | 7050 | 26 | 26 | 0.26% | 0.37% | 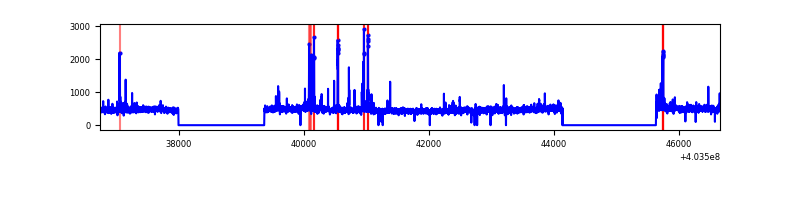 |
| C | 9923 | 7048 | 40 | 40 | 0.40% | 0.57% | 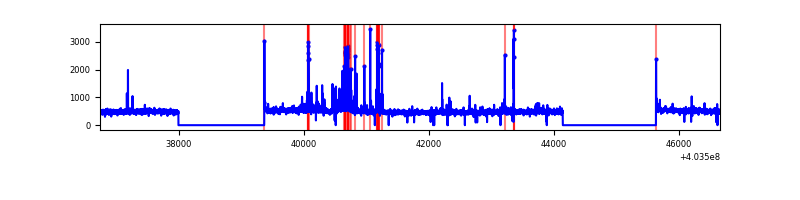 |
| D | 9923 | 7041 | 225 | 225 | 2.27% | 3.20% | 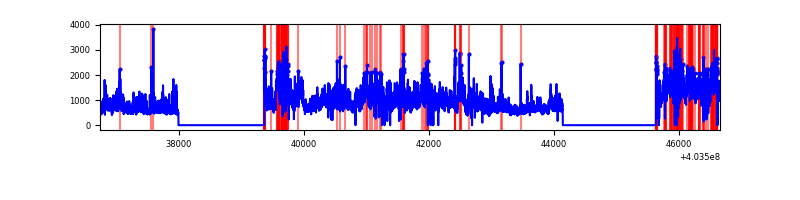 |
Top three noisy pixels from each quadrant. If the there are fewer than three noisy pixels in the level2.evt file, extra rows are filled as -1
| Pixel properties | Quadrant properties | ||||||
|---|---|---|---|---|---|---|---|
| Quadrant | DetID | PixID | Counts | Sigma | Mean | Median | Sigma |
| A | 12 | 16 | 1343413 | 8268.74 | 800 | 783 | 162.4 |
| A | 10 | 83 | 430787 | 2648.23 | 800 | 783 | 162.4 |
| A | 12 | 194 | 202609 | 1242.97 | 800 | 783 | 162.4 |
| B | 0 | 229 | 158493 | 1018.18 | 802 | 778 | 154.9 |
| B | 5 | 172 | 45789 | 290.58 | 802 | 778 | 154.9 |
| B | 0 | 230 | 30069 | 189.1 | 802 | 778 | 154.9 |
| C | 15 | 214 | 287218 | 1555.88 | 782 | 788 | 184.1 |
| C | 1 | 23 | 245112 | 1327.16 | 782 | 788 | 184.1 |
| C | 3 | 233 | 70536 | 378.87 | 782 | 788 | 184.1 |
| D | 12 | 235 | 3244643 | 17036.52 | 769 | 745 | 190.4 |
| D | 13 | 138 | 240611 | 1259.74 | 769 | 745 | 190.4 |
| D | 1 | 52 | 117715 | 614.31 | 769 | 745 | 190.4 |
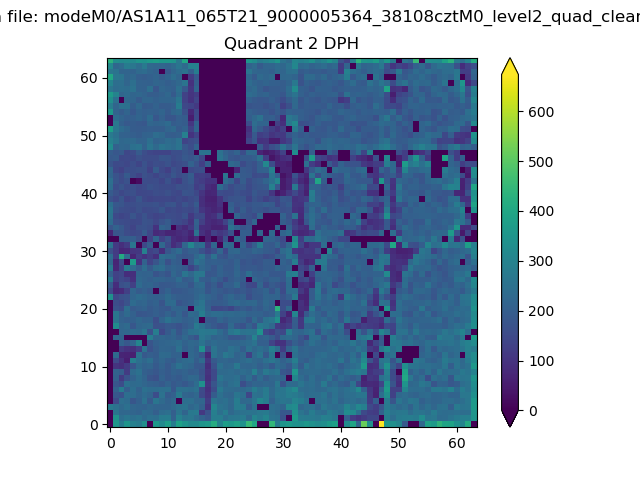
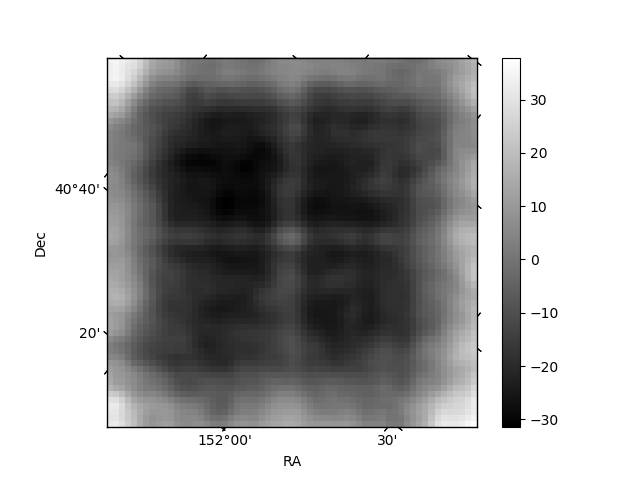
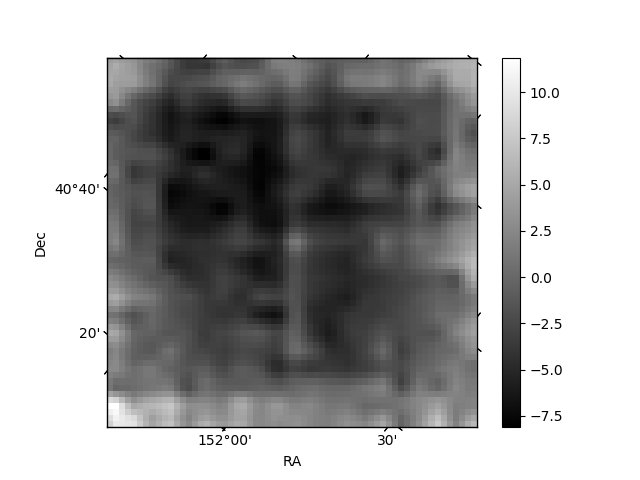
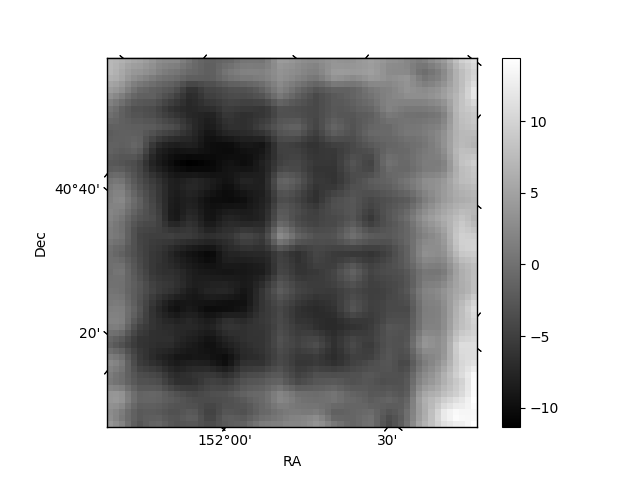
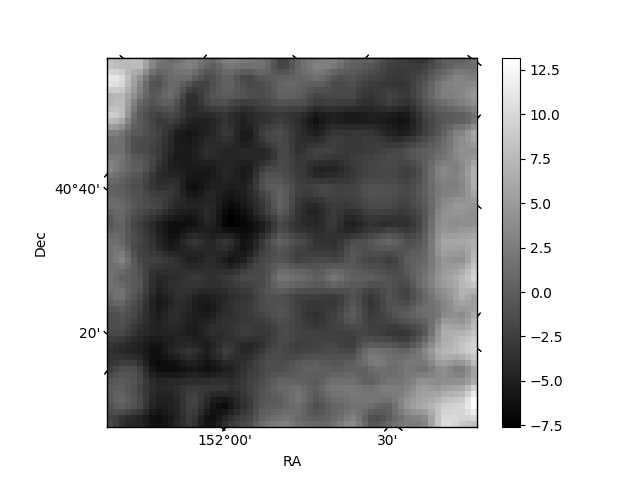
Histogram calculated using DETX and DETY for each event in the final _common_clean file
| Quadrant A | 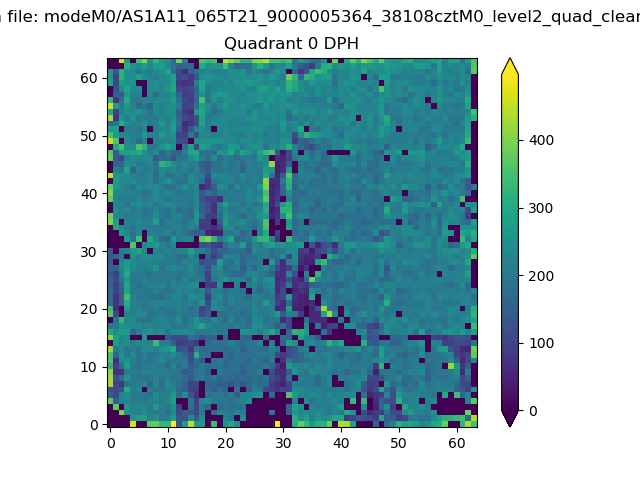 |
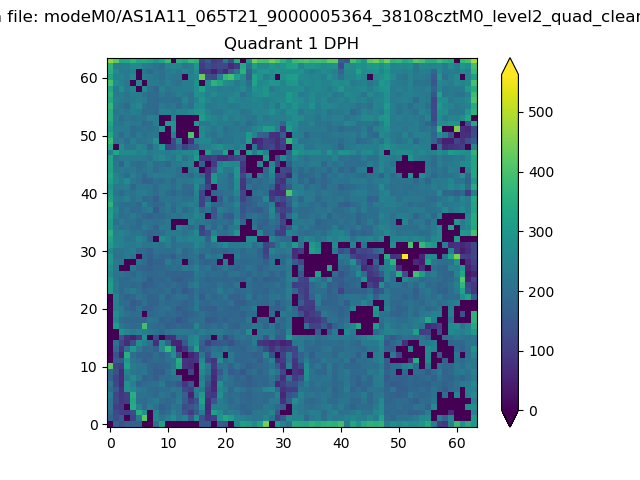 |
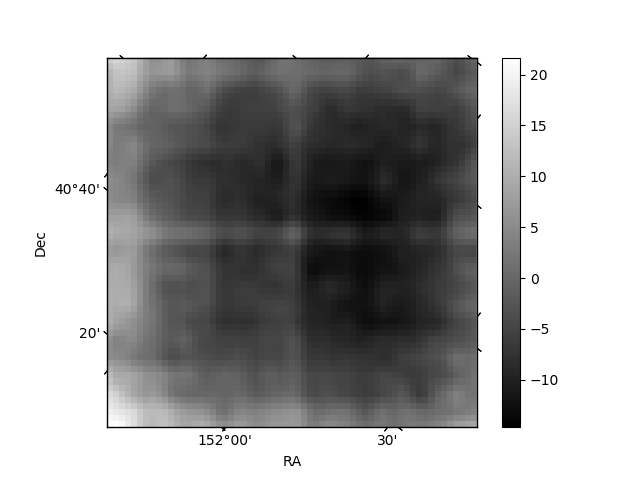
Quadrant B |
|---|---|---|---|
| Quadrant D | 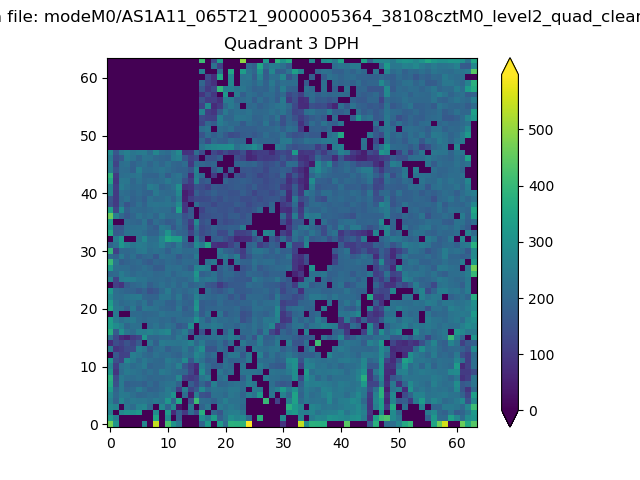 |
 |
Quadrant C |
| Plot type | Count rate plots | Images |
|---|---|---|
| Comparison with Poisson distribution Blue bars denote a histogram of data divided into 1 sec bins. Red curve is a Poisson curve with rate = median count rate of data. |
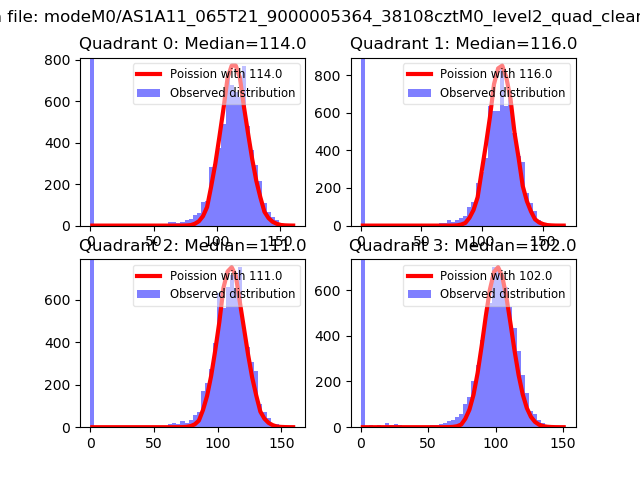 |
 |
| Quadrant-wise count rates Data is divided into 100 sec bins |
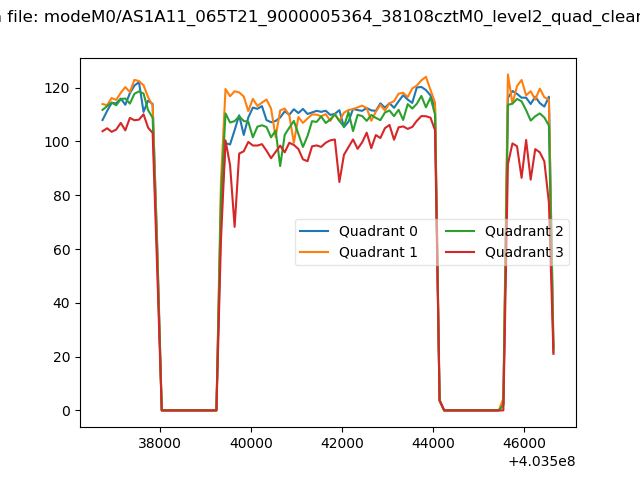 |
|
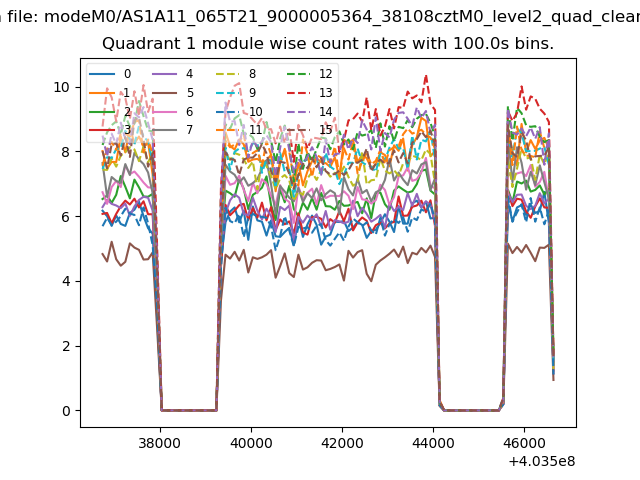
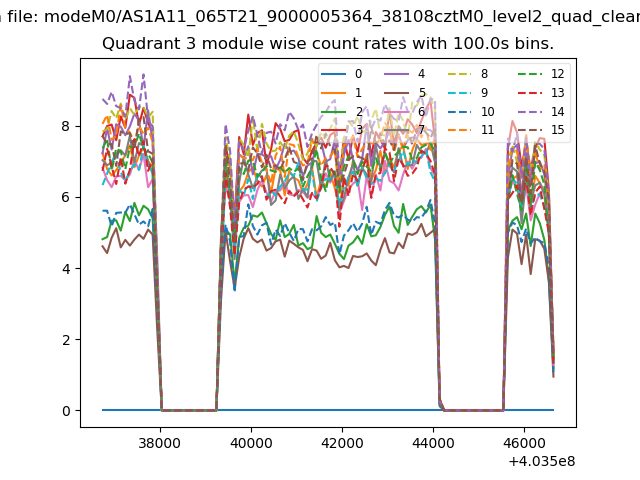
| Module-wise count rates for Quadrant A Data is divided into 100 sec bins |
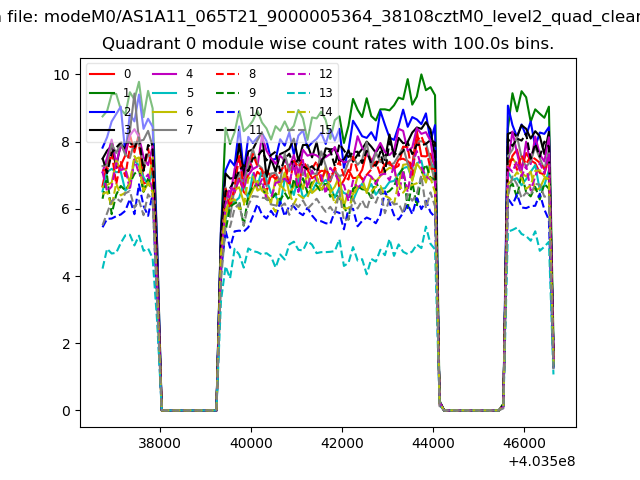 |
 |
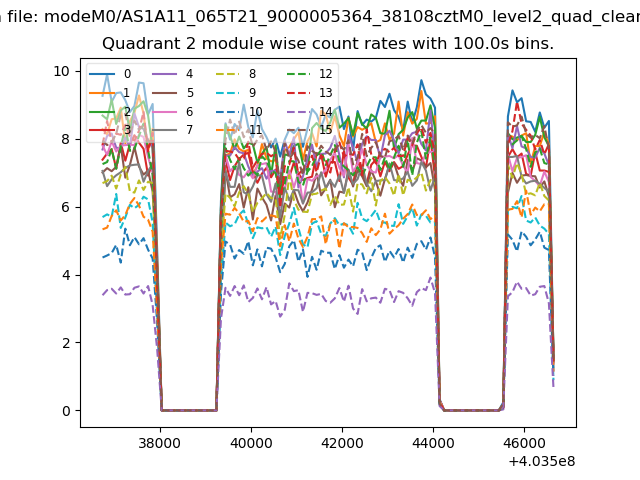
| Module-wise count rates for Quadrant B Data is divided into 100 sec bins |
 |
 |
| Module-wise count rates for Quadrant C Data is divided into 100 sec bins |
 |
 |
| Module-wise count rates for Quadrant D Data is divided into 100 sec bins |
 |
 |
| Parameter | Plot |
|---|---|
| CZT HV Monitor | 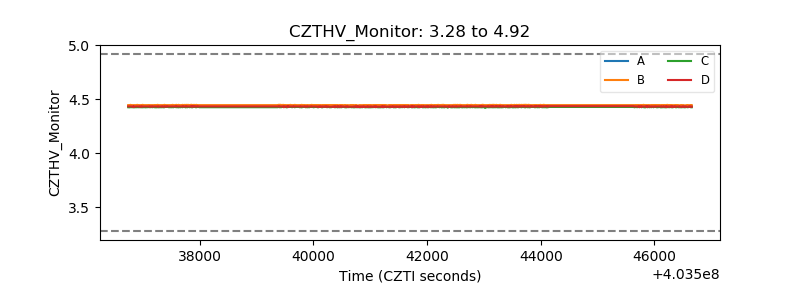 |
| D_VDD | 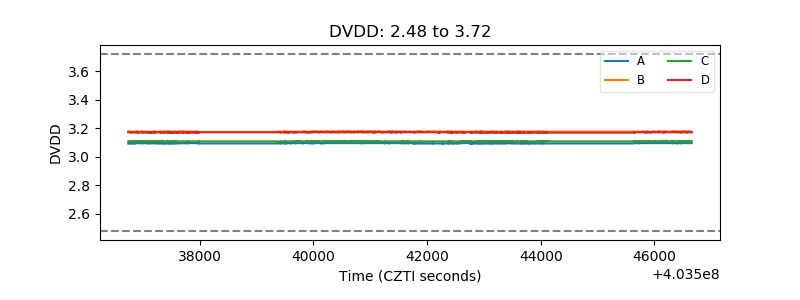 |
| Temperature 1 | 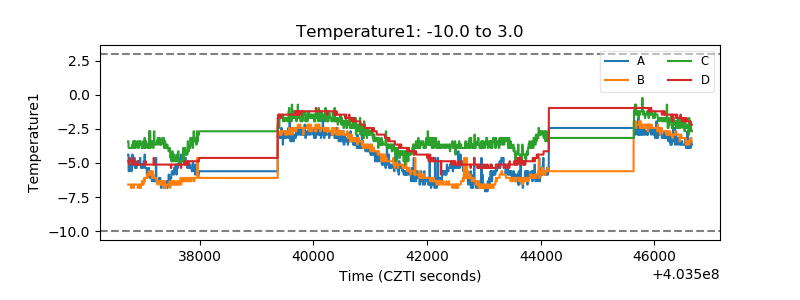 |
| Veto HV Monitor | 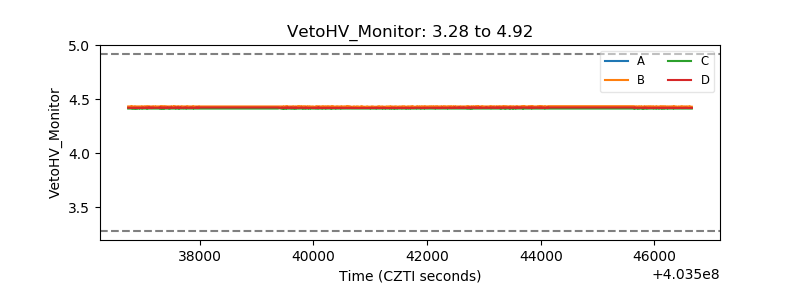 |
| Veto LLD | 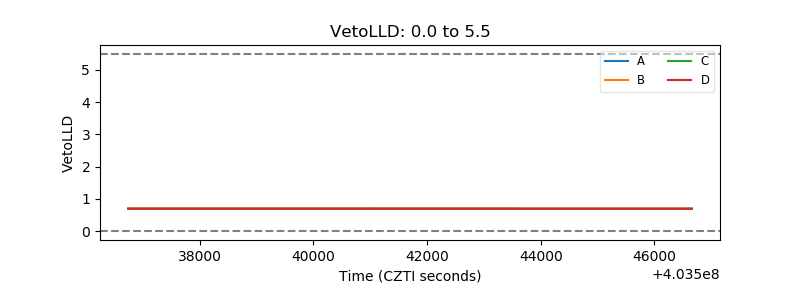 |
| Alpha Counter | 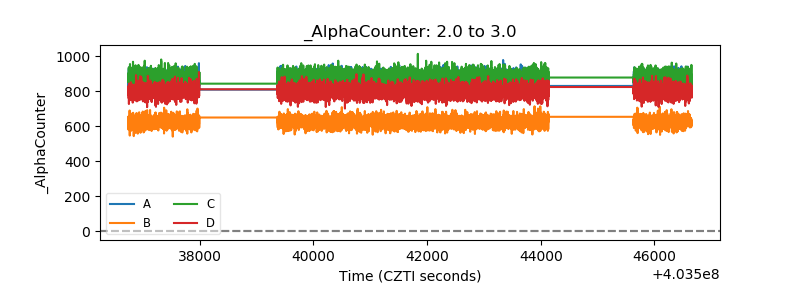 |
| _CPM_Rate |  |
| CZT Counter | 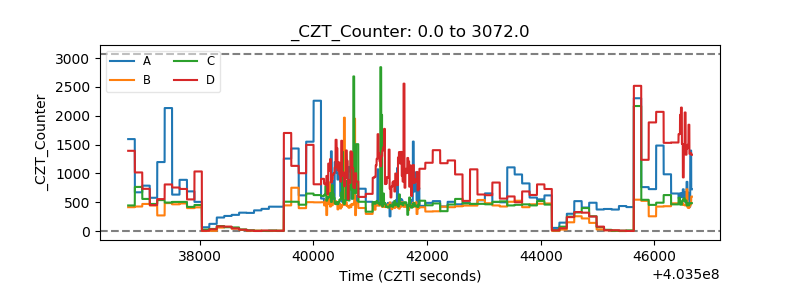 |
| +2.5 Volts monitor | 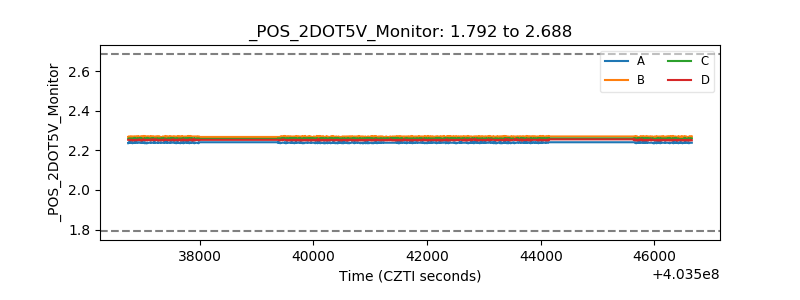 |
| +5 Volts monitor | 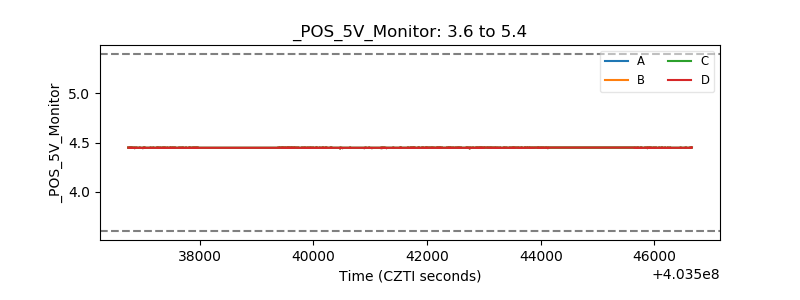 |
| _ROLL_ROT | 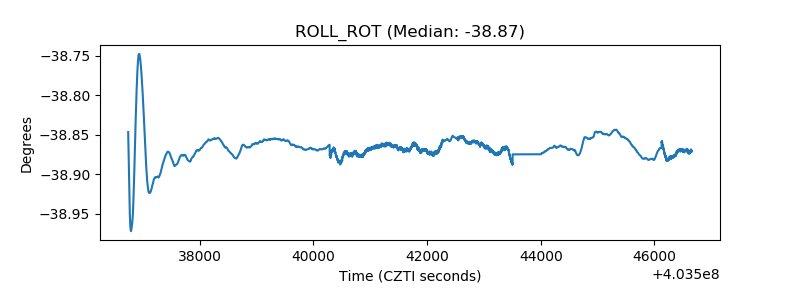 |
| _Roll_DEC | 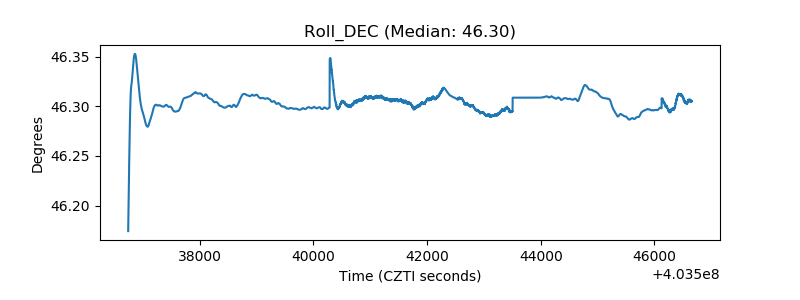 |
| _Roll_RA | 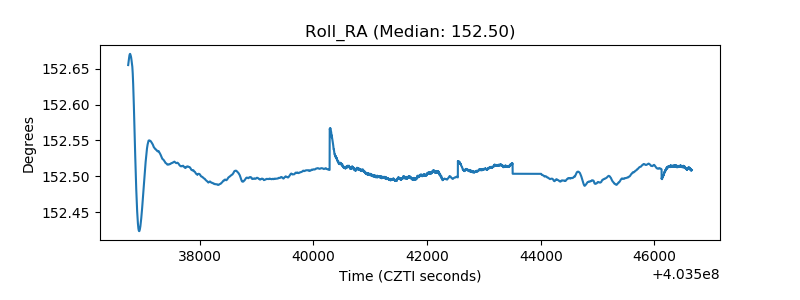 |
| Veto Counter | 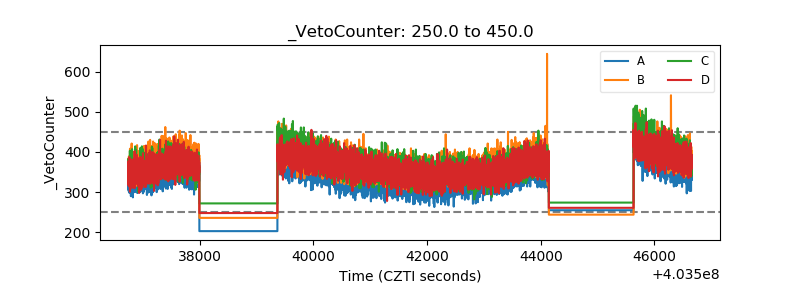 |