| Param | Original file | Final file |
|---|---|---|
| Filename | modeM0/AS1A11_065T21_9000005364_38111cztM0_level2.fits | modeM0/AS1A11_065T21_9000005364_38111cztM0_level2_quad_clean.evt |
| Size (bytes) | 493,796,160 | 93,179,520 |
| Size | 470.9 MB | 88.9 MB |
| Events in quadrant A | 3,486,388 | 642,037 |
| Events in quadrant B | 2,876,928 | 649,797 |
| Events in quadrant C | 3,872,310 | 613,997 |
| Events in quadrant D | 7,624,721 | 537,866 |
| Mode M9 | |||
|---|---|---|---|
| Quadrant | BADHDUFLAG | Total packets | Discarded packets |
| A | 0 | 22 | 0 |
| B | 0 | 22 | 0 |
| C | 0 | 22 | 0 |
| D | 0 | 23 | 0 |
| Mode M0 | |||
|---|---|---|---|
| Quadrant | BADHDUFLAG | Total packets | Discarded packets |
| A | 0 | 13898 | 3 |
| B | 0 | 12202 | 2 |
| C | 0 | 14957 | 2 |
| D | 0 | 26436 | 2 |
| Mode SS | |||
|---|---|---|---|
| Quadrant | BADHDUFLAG | Total packets | Discarded packets |
| A | 0 | 108 | 0 |
| B | 0 | 108 | 0 |
| C | 0 | 108 | 0 |
| D | 0 | 108 | 0 |
| Quadrant | Total seconds | Saturated seconds | Saturation percentage |
|---|---|---|---|
| A | 5401 | 82 | 1.518237% |
| B | 5401 | 81 | 1.499722% |
| C | 5401 | 254 | 4.702833% |
| D | 5401 | 758 | 14.034438% |
Noise dominated data is calculated using 1-second bins in cleaned event files. If a bin has >2000 counts, and if more than 50% of those come from <1% of pixels, then it is considered to be noise-dominated and hence unusable.
| Quadrant | # 1 sec bins | Bins with >0 counts | Bins with >2000 counts | High rate bins dominated by noise | Noise dominated (total time) | Noise dominated (detector-on time) | Marked lightcurve |
|---|---|---|---|---|---|---|---|
| A | 7134 | 5402 | 59 | 59 | 0.83% | 1.09% | 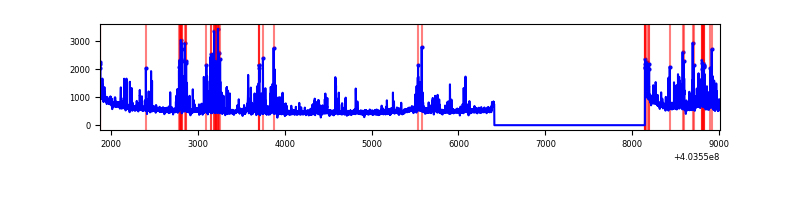 |
| B | 7134 | 5402 | 46 | 46 | 0.64% | 0.85% | 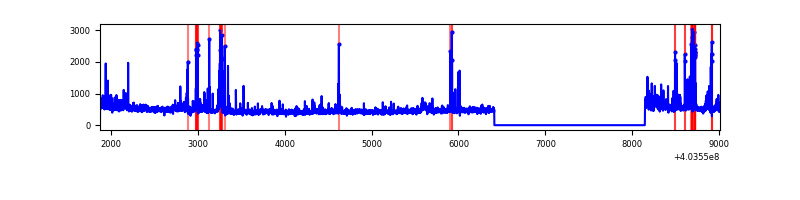 |
| C | 7134 | 5402 | 255 | 255 | 3.57% | 4.72% | 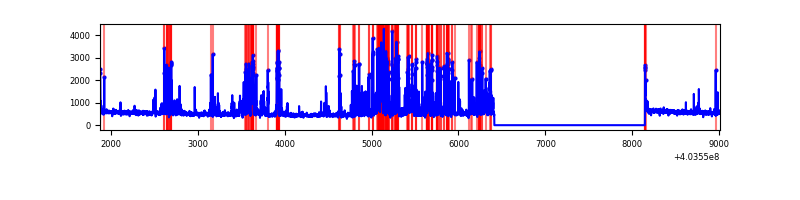 |
| D | 7134 | 5402 | 770 | 770 | 10.79% | 14.25% | 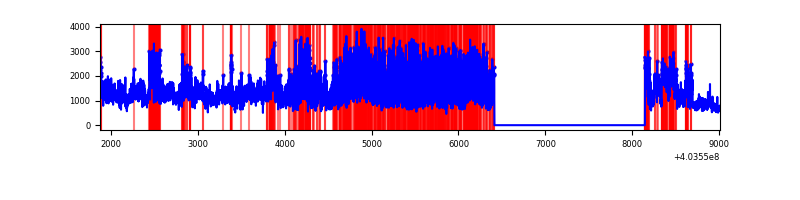 |
Top three noisy pixels from each quadrant. If the there are fewer than three noisy pixels in the level2.evt file, extra rows are filled as -1
| Pixel properties | Quadrant properties | ||||||
|---|---|---|---|---|---|---|---|
| Quadrant | DetID | PixID | Counts | Sigma | Mean | Median | Sigma |
| A | 12 | 16 | 428539 | 3393.39 | 626 | 613 | 126.1 |
| A | 10 | 83 | 373775 | 2959.12 | 626 | 613 | 126.1 |
| A | 12 | 189 | 102721 | 809.7 | 626 | 613 | 126.1 |
| B | 0 | 229 | 194279 | 1625.77 | 623 | 608 | 119.1 |
| B | 5 | 172 | 165917 | 1387.69 | 623 | 608 | 119.1 |
| B | 4 | 81 | 33289 | 274.34 | 623 | 608 | 119.1 |
| C | 1 | 23 | 1192398 | 8416.09 | 608 | 611 | 141.6 |
| C | 15 | 214 | 220571 | 1553.3 | 608 | 611 | 141.6 |
| C | 0 | 239 | 32756 | 227.0 | 608 | 611 | 141.6 |
| D | 12 | 235 | 3020483 | 18737.7 | 587 | 578 | 161.2 |
| D | 1 | 20 | 1822060 | 11301.81 | 587 | 578 | 161.2 |
| D | 12 | 233 | 183944 | 1137.74 | 587 | 578 | 161.2 |
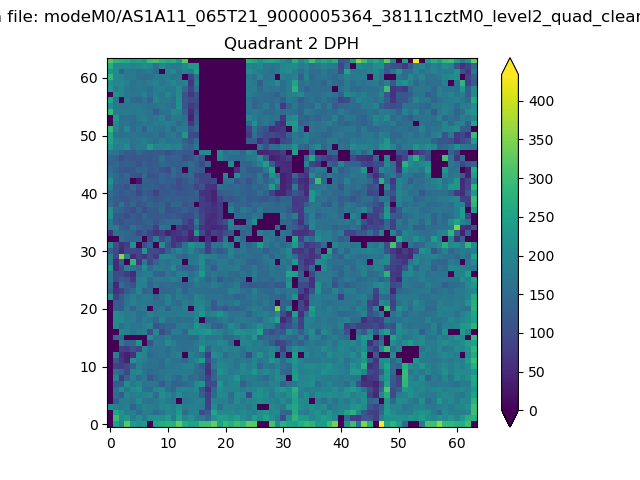
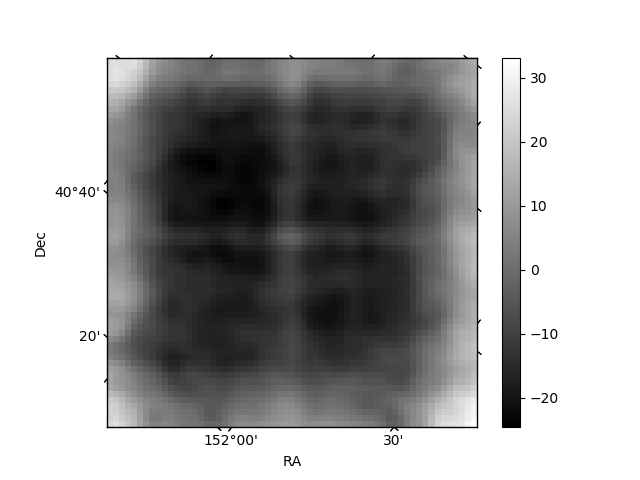
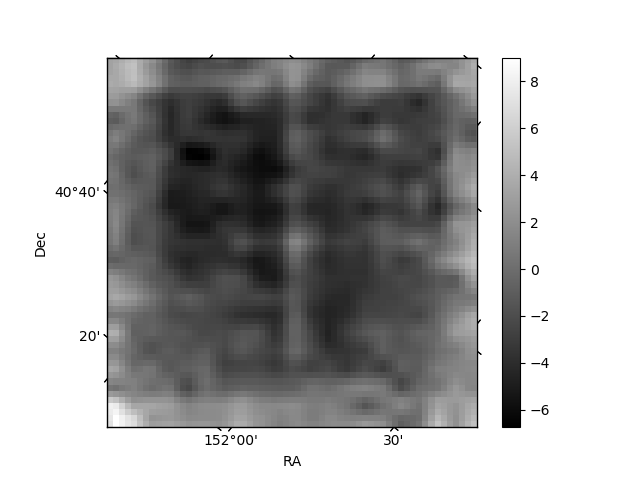
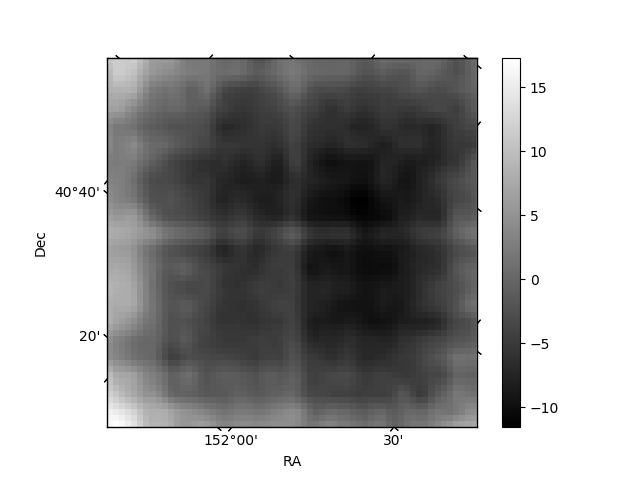
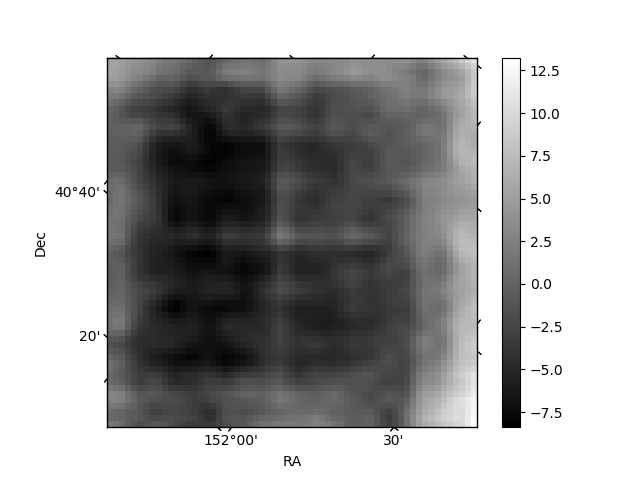
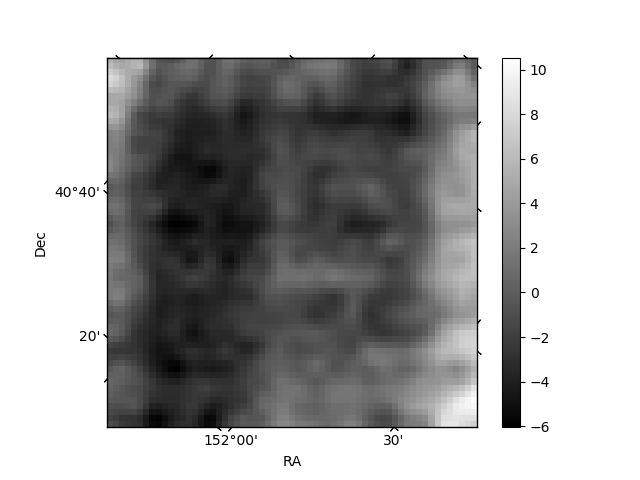
Histogram calculated using DETX and DETY for each event in the final _common_clean file
| Quadrant A | 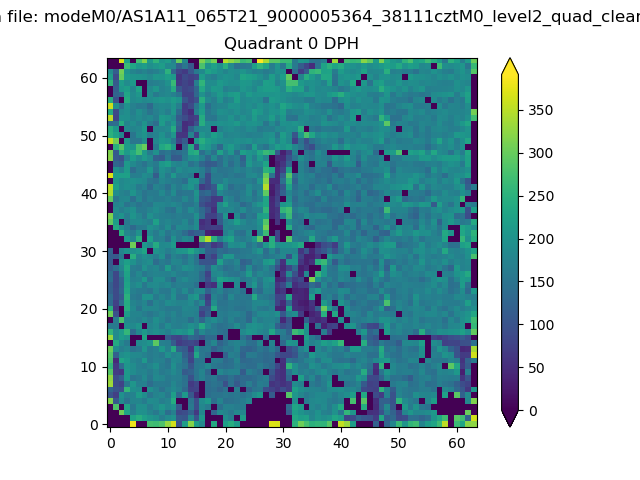 |
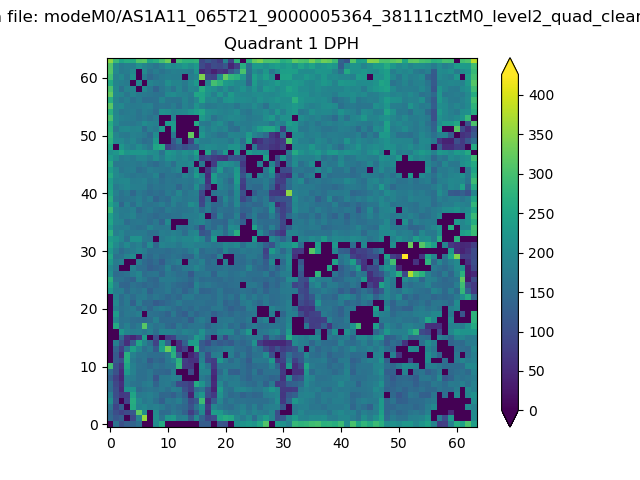 |
Quadrant B |
|---|---|---|---|
| Quadrant D | 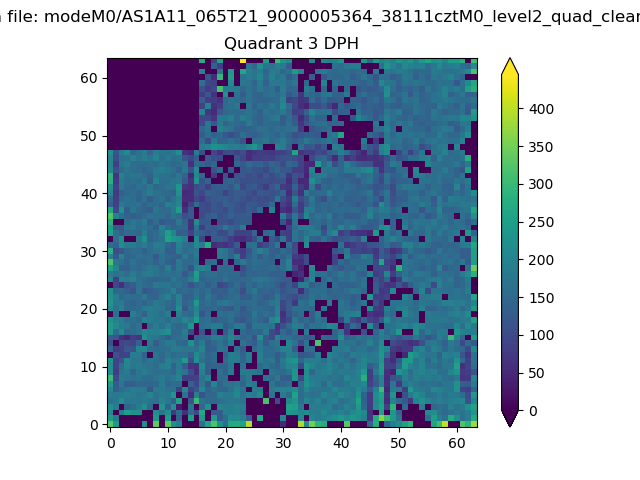 |
 |
Quadrant C |
| Plot type | Count rate plots | Images |
|---|---|---|
| Comparison with Poisson distribution Blue bars denote a histogram of data divided into 1 sec bins. Red curve is a Poisson curve with rate = median count rate of data. |
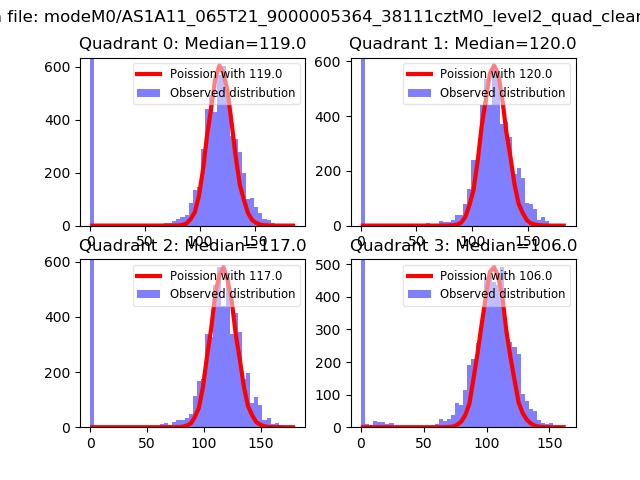 |
 |
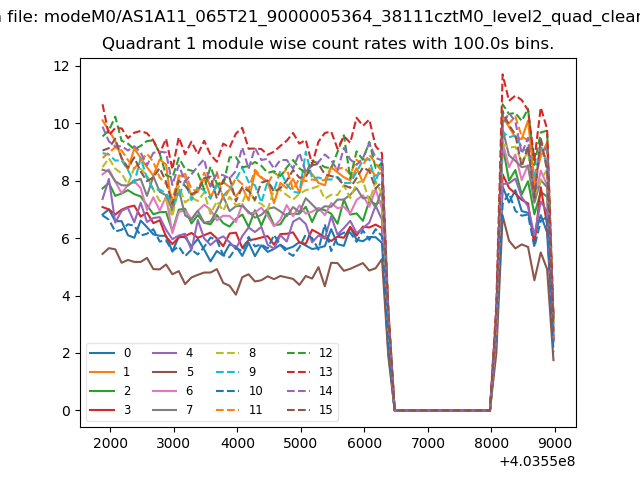
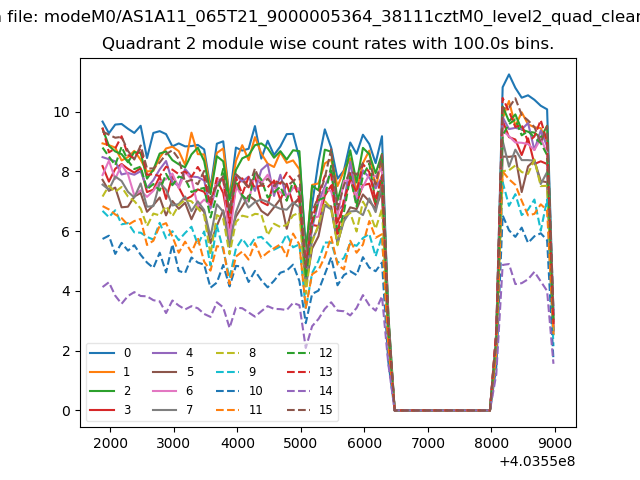
| Quadrant-wise count rates Data is divided into 100 sec bins |
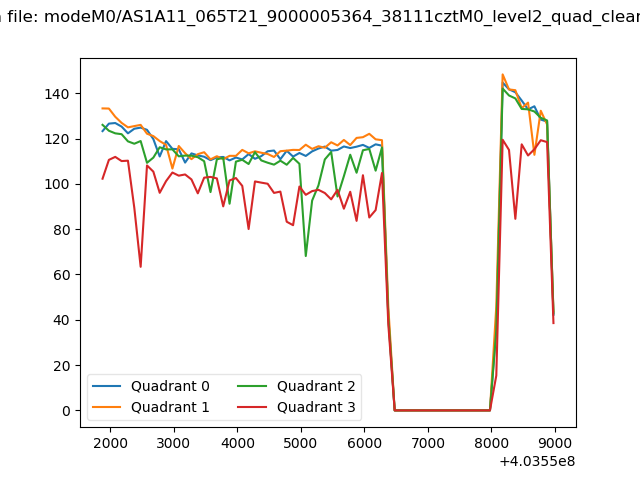 |
|
| Module-wise count rates for Quadrant A Data is divided into 100 sec bins |
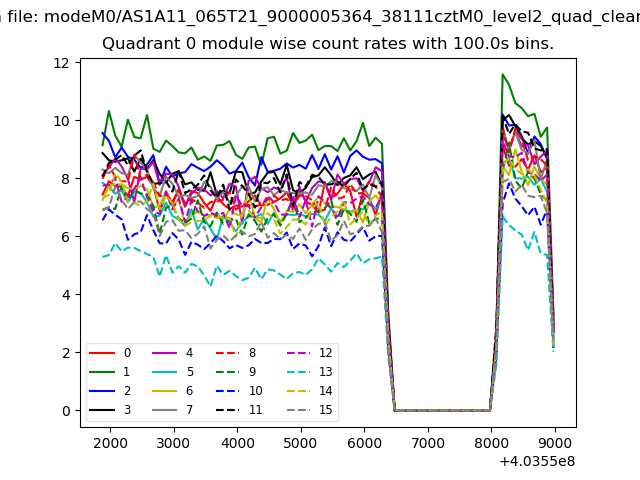 |
 |
| Module-wise count rates for Quadrant B Data is divided into 100 sec bins |
 |
 |
| Module-wise count rates for Quadrant C Data is divided into 100 sec bins |
 |
 |
| Module-wise count rates for Quadrant D Data is divided into 100 sec bins |
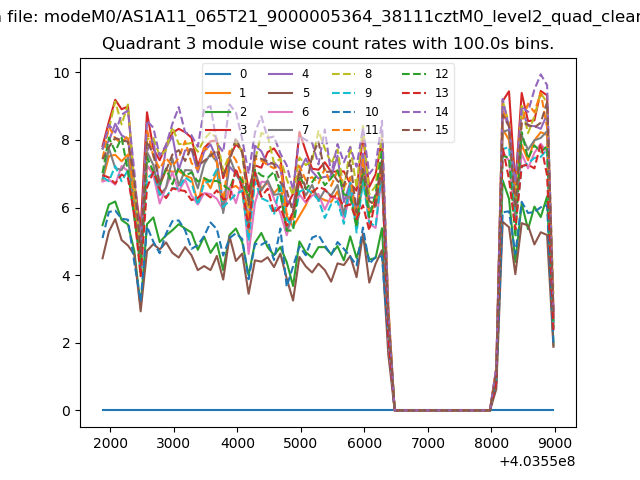 |
 |
| Parameter | Plot |
|---|---|
| CZT HV Monitor | 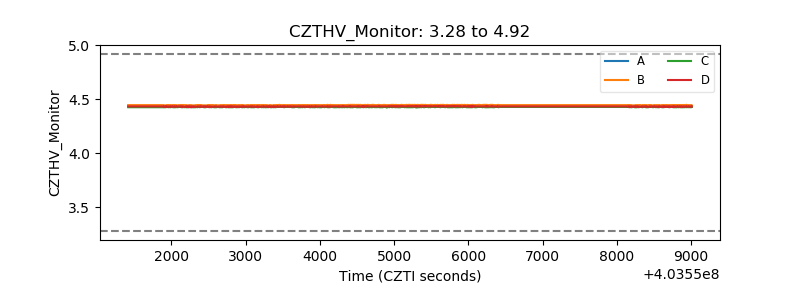 |
| D_VDD | 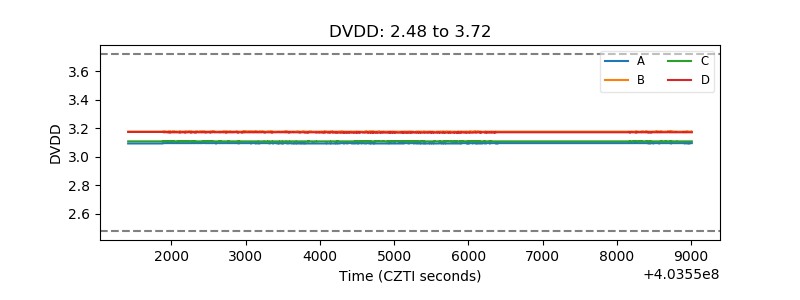 |
| Temperature 1 | 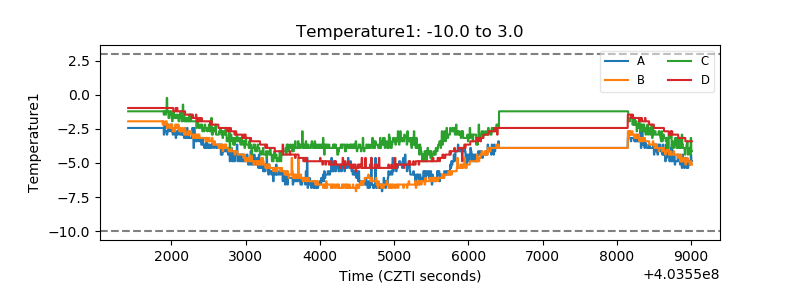 |
| Veto HV Monitor | 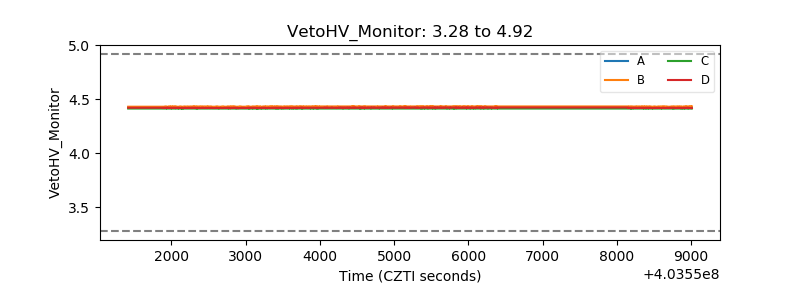 |
| Veto LLD | 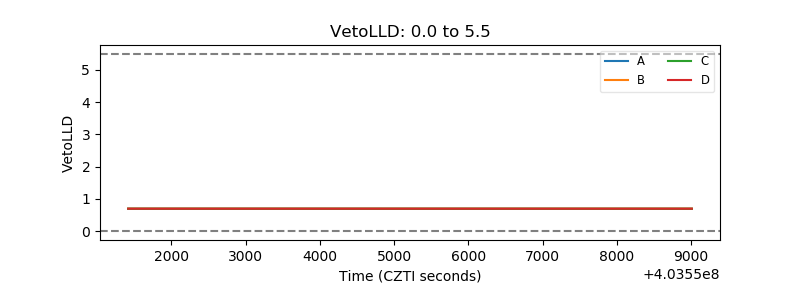 |
| Alpha Counter | 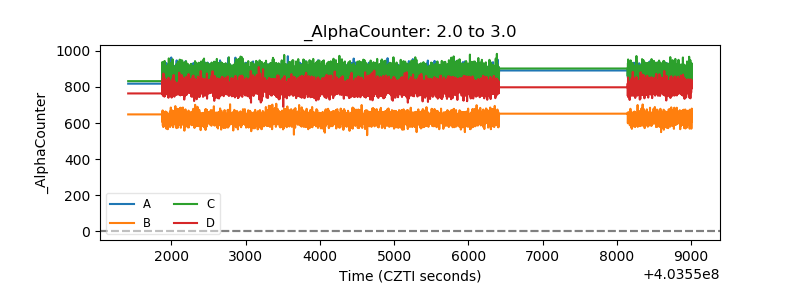 |
| _CPM_Rate | 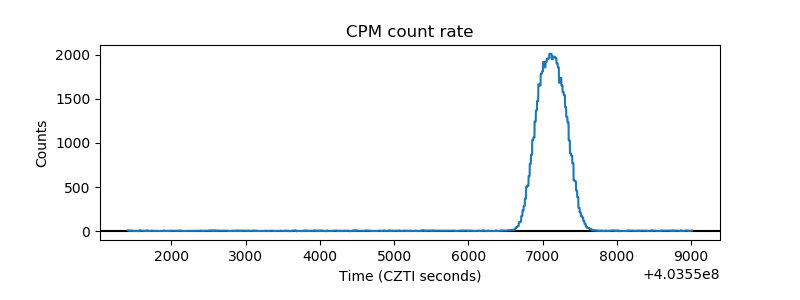 |
| CZT Counter | 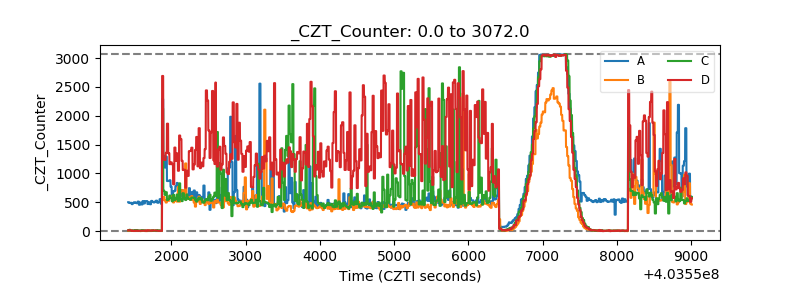 |
| +2.5 Volts monitor | 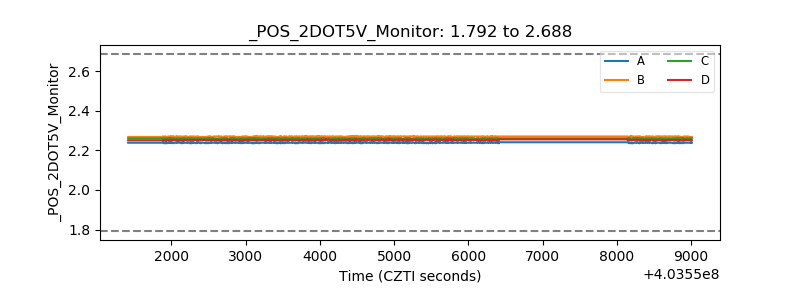 |
| +5 Volts monitor | 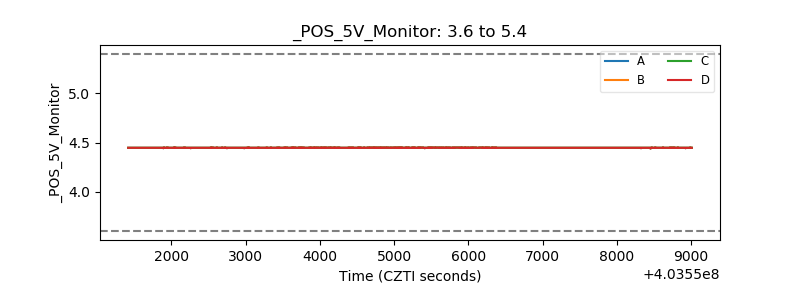 |
| _ROLL_ROT | 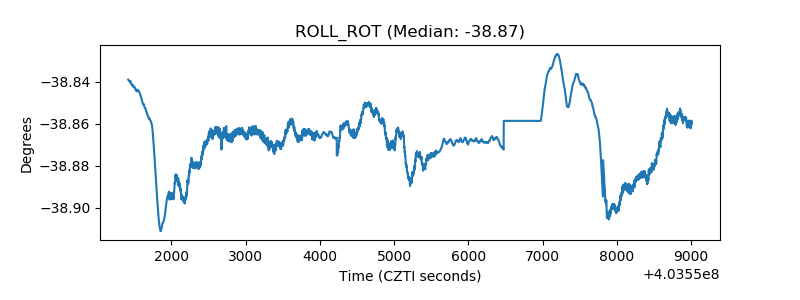 |
| _Roll_DEC | 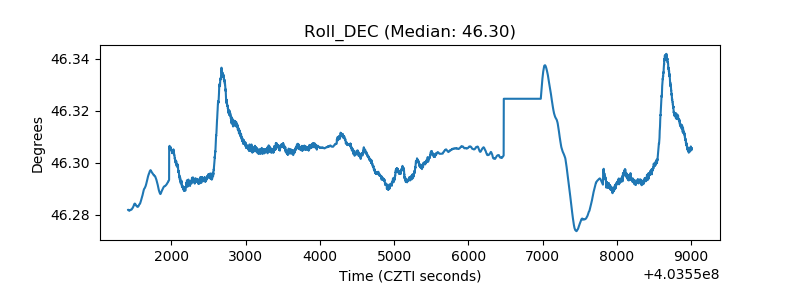 |
| _Roll_RA | 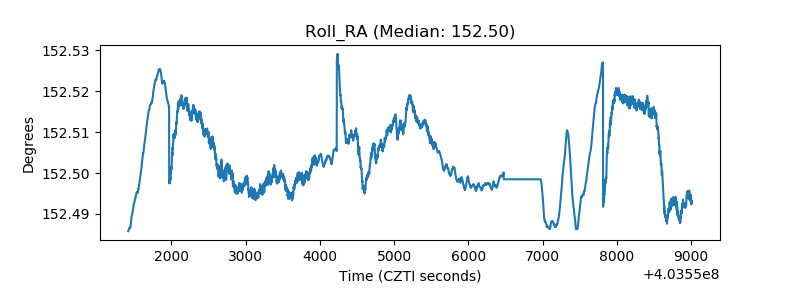 |
| Veto Counter | 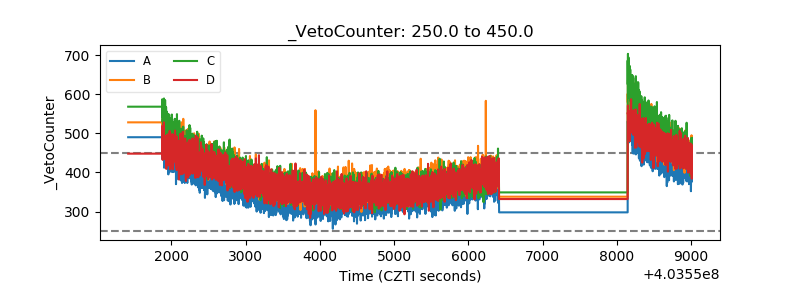 |