| Param | Original file | Final file |
|---|---|---|
| Filename | modeM0/AS1A11_065T21_9000005364_38112cztM0_level2.fits | modeM0/AS1A11_065T21_9000005364_38112cztM0_level2_quad_clean.evt |
| Size (bytes) | 364,276,800 | 97,130,880 |
| Size | 347.4 MB | 92.6 MB |
| Events in quadrant A | 3,278,818 | 662,492 |
| Events in quadrant B | 2,677,286 | 671,039 |
| Events in quadrant C | 2,986,656 | 647,885 |
| Events in quadrant D | 4,132,647 | 591,451 |
| Mode M9 | |||
|---|---|---|---|
| Quadrant | BADHDUFLAG | Total packets | Discarded packets |
| A | 0 | 29 | 0 |
| B | 0 | 29 | 0 |
| C | 0 | 29 | 0 |
| D | 0 | 30 | 0 |
| Mode M0 | |||
|---|---|---|---|
| Quadrant | BADHDUFLAG | Total packets | Discarded packets |
| A | 0 | 13057 | 3 |
| B | 0 | 11465 | 2 |
| C | 0 | 12201 | 2 |
| D | 0 | 15833 | 2 |
| Mode SS | |||
|---|---|---|---|
| Quadrant | BADHDUFLAG | Total packets | Discarded packets |
| A | 0 | 108 | 0 |
| B | 0 | 108 | 0 |
| C | 0 | 108 | 0 |
| D | 0 | 108 | 0 |
| Quadrant | Total seconds | Saturated seconds | Saturation percentage |
|---|---|---|---|
| A | 5258 | 55 | 1.046025% |
| B | 5258 | 47 | 0.893876% |
| C | 5258 | 112 | 2.130087% |
| D | 5258 | 153 | 2.909852% |
Noise dominated data is calculated using 1-second bins in cleaned event files. If a bin has >2000 counts, and if more than 50% of those come from <1% of pixels, then it is considered to be noise-dominated and hence unusable.
| Quadrant | # 1 sec bins | Bins with >0 counts | Bins with >2000 counts | High rate bins dominated by noise | Noise dominated (total time) | Noise dominated (detector-on time) | Marked lightcurve |
|---|---|---|---|---|---|---|---|
| A | 7110 | 5259 | 35 | 35 | 0.49% | 0.67% | 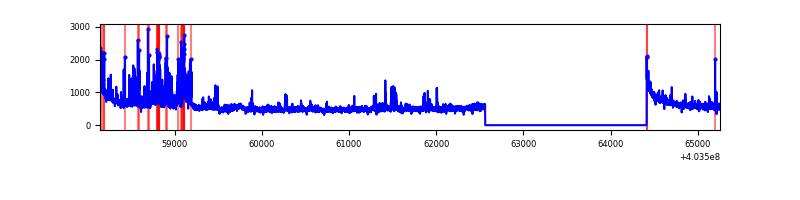 |
| B | 7110 | 5259 | 25 | 25 | 0.35% | 0.48% | 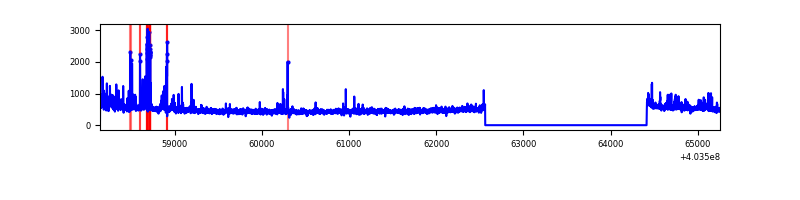 |
| C | 7110 | 5259 | 104 | 104 | 1.46% | 1.98% | 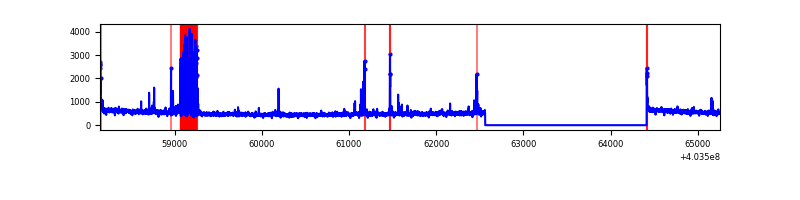 |
| D | 7110 | 5259 | 117 | 117 | 1.65% | 2.22% | 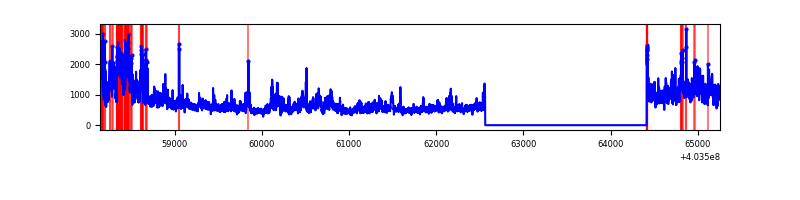 |
Top three noisy pixels from each quadrant. If the there are fewer than three noisy pixels in the level2.evt file, extra rows are filled as -1
| Pixel properties | Quadrant properties | ||||||
|---|---|---|---|---|---|---|---|
| Quadrant | DetID | PixID | Counts | Sigma | Mean | Median | Sigma |
| A | 10 | 83 | 359549 | 2850.79 | 623 | 613 | 125.9 |
| A | 12 | 16 | 301723 | 2391.51 | 623 | 613 | 125.9 |
| A | 12 | 189 | 129930 | 1027.08 | 623 | 613 | 125.9 |
| B | 0 | 229 | 110236 | 924.74 | 623 | 607 | 118.6 |
| B | 5 | 172 | 77822 | 651.32 | 623 | 607 | 118.6 |
| B | 0 | 189 | 22618 | 185.66 | 623 | 607 | 118.6 |
| C | 0 | 239 | 308201 | 2151.61 | 611 | 616 | 143.0 |
| C | 15 | 214 | 216008 | 1506.7 | 611 | 616 | 143.0 |
| C | 1 | 23 | 39738 | 273.67 | 611 | 616 | 143.0 |
| D | 12 | 235 | 1582302 | 9715.71 | 602 | 592 | 162.8 |
| D | 2 | 250 | 51388 | 312.02 | 602 | 592 | 162.8 |
| D | 2 | 234 | 32758 | 197.58 | 602 | 592 | 162.8 |
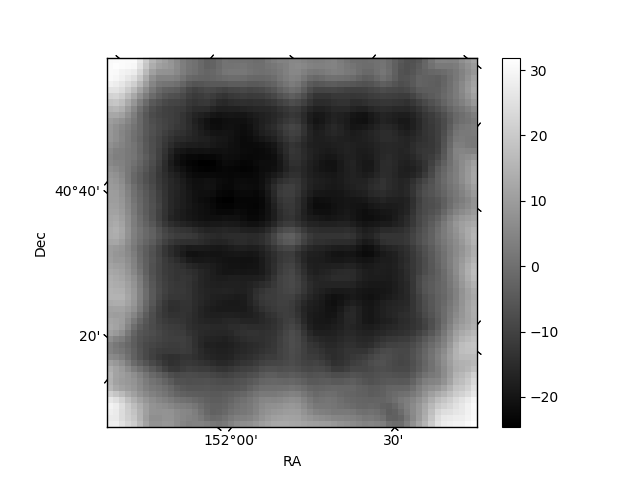
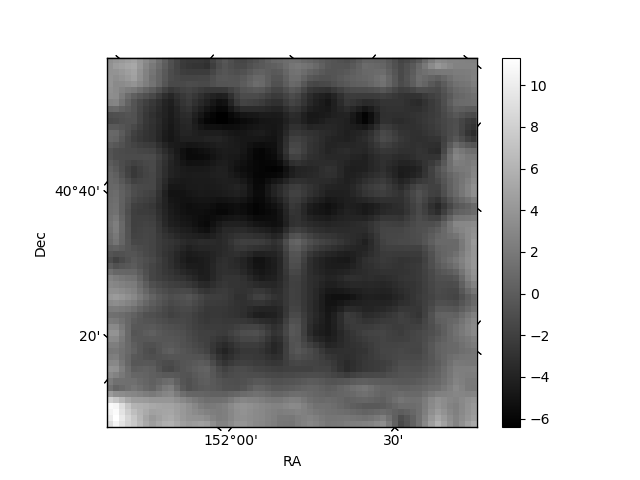
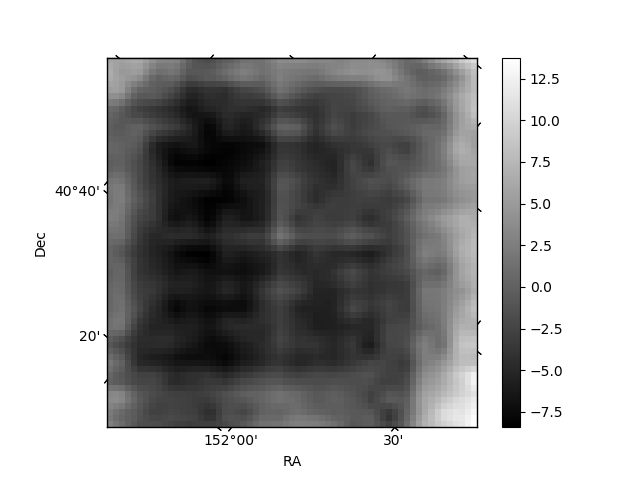
Histogram calculated using DETX and DETY for each event in the final _common_clean file
| Quadrant A | 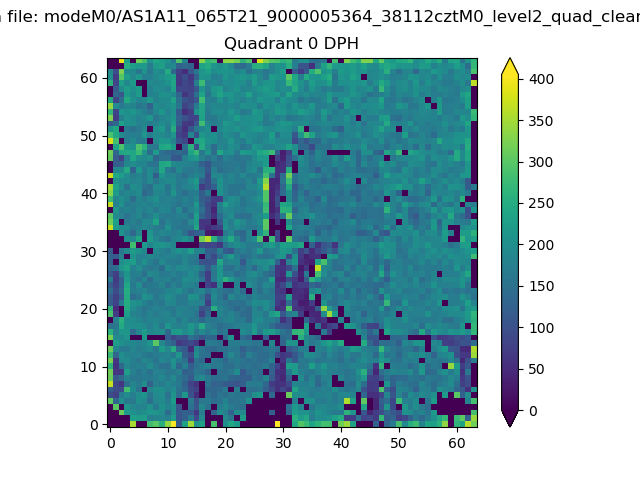 |
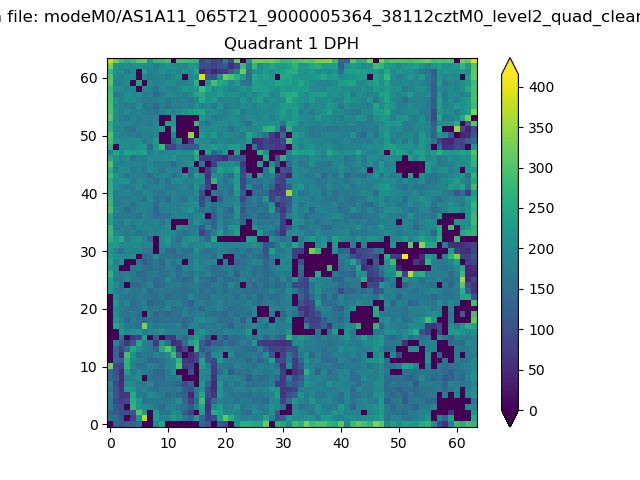 |
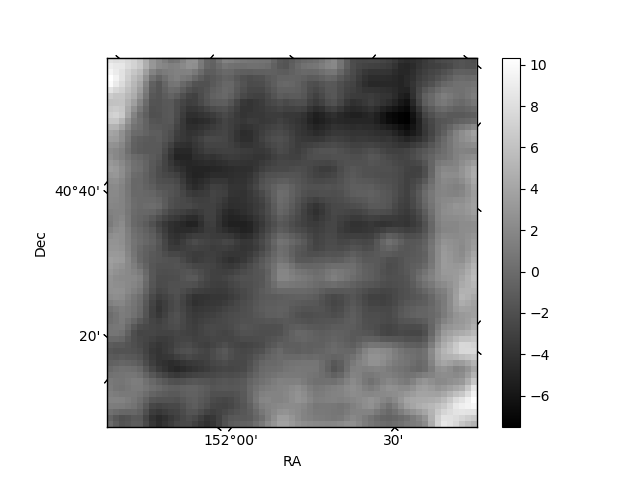
Quadrant B |
|---|---|---|---|
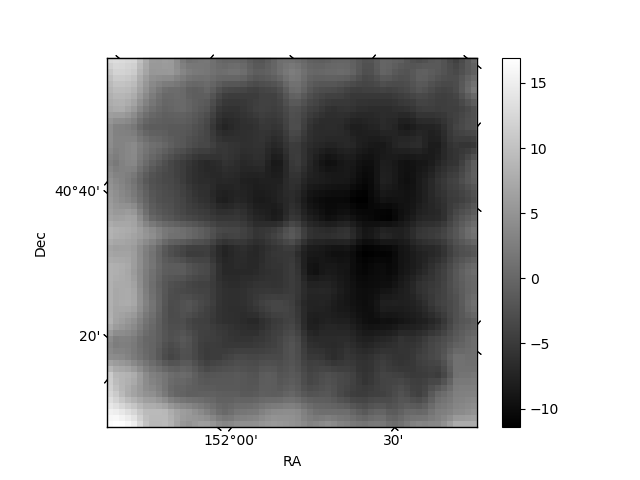
| Quadrant D | 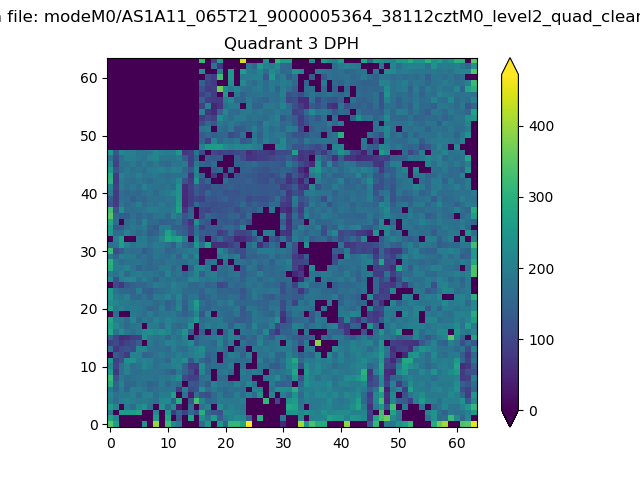 |
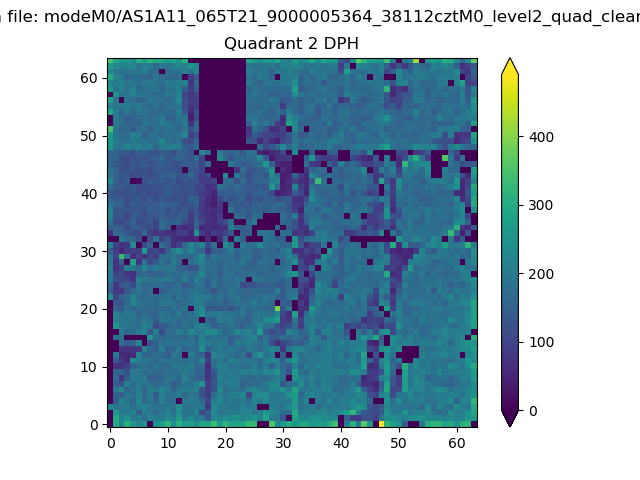 |
Quadrant C |
| Plot type | Count rate plots | Images |
|---|---|---|
| Comparison with Poisson distribution Blue bars denote a histogram of data divided into 1 sec bins. Red curve is a Poisson curve with rate = median count rate of data. |
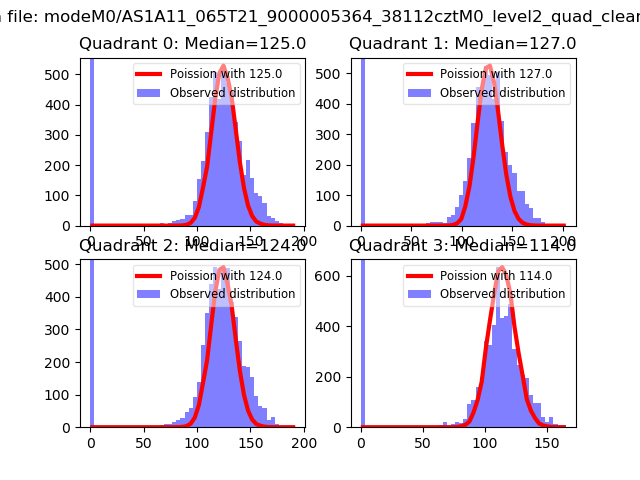 |
 |
| Quadrant-wise count rates Data is divided into 100 sec bins |
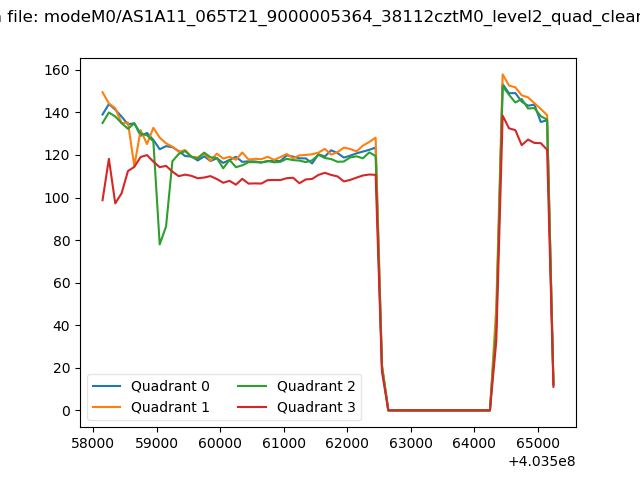 |
|
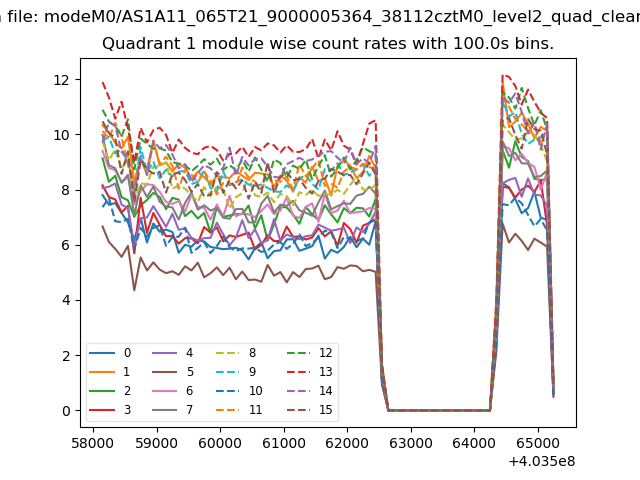
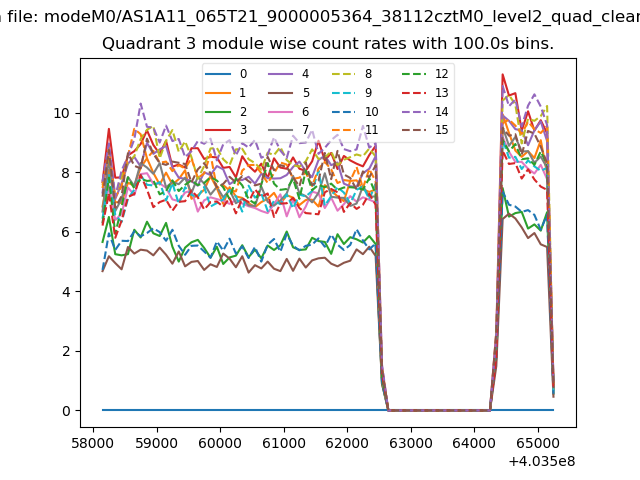
| Module-wise count rates for Quadrant A Data is divided into 100 sec bins |
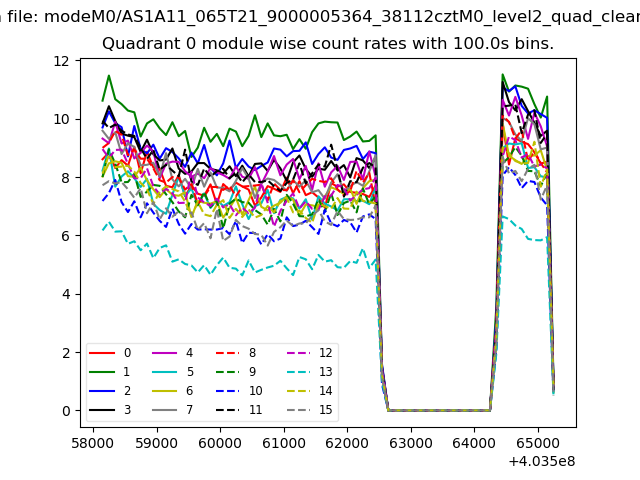 |
 |
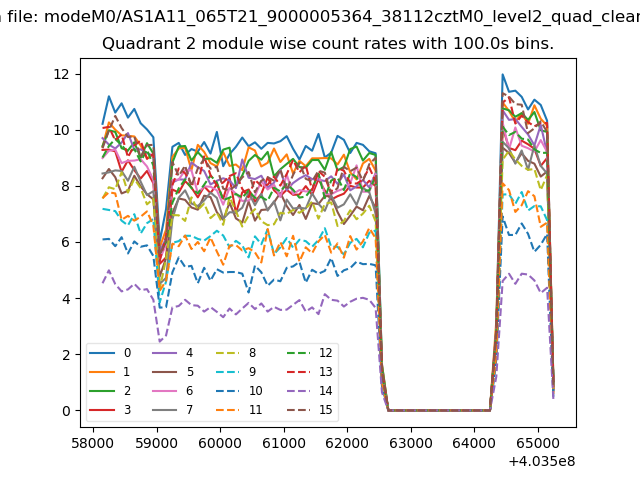
| Module-wise count rates for Quadrant B Data is divided into 100 sec bins |
 |
 |
| Module-wise count rates for Quadrant C Data is divided into 100 sec bins |
 |
 |
| Module-wise count rates for Quadrant D Data is divided into 100 sec bins |
 |
 |
| Parameter | Plot |
|---|---|
| CZT HV Monitor | 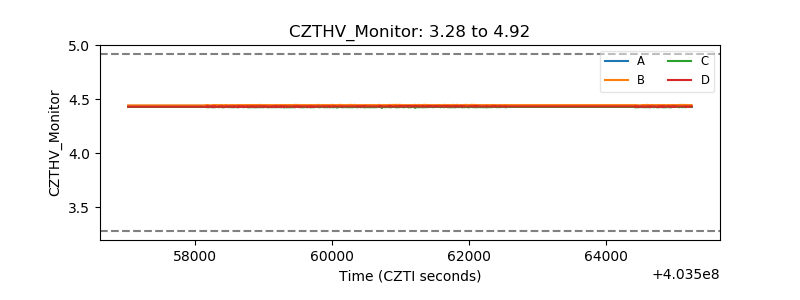 |
| D_VDD | 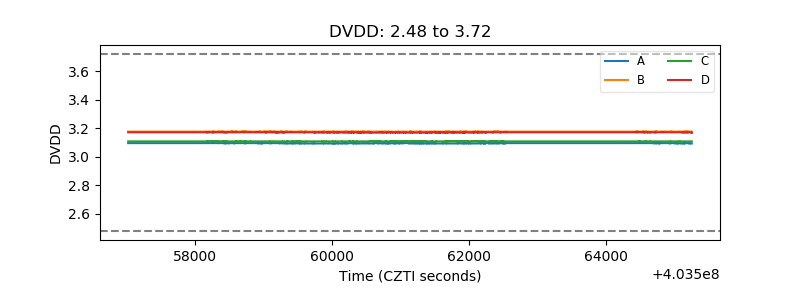 |
| Temperature 1 | 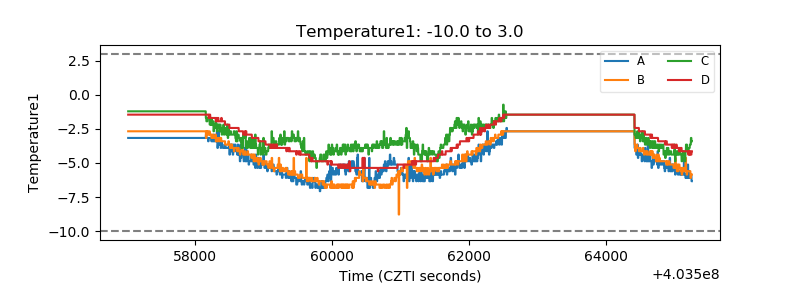 |
| Veto HV Monitor | 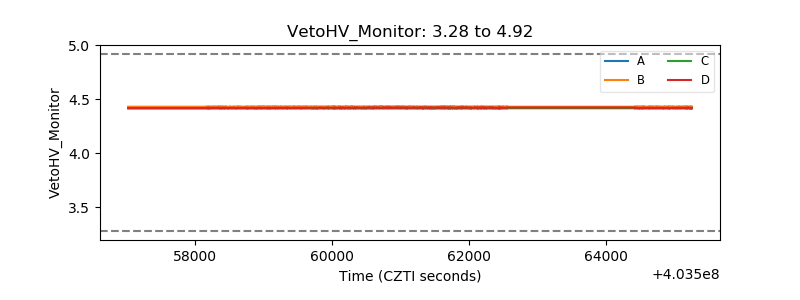 |
| Veto LLD | 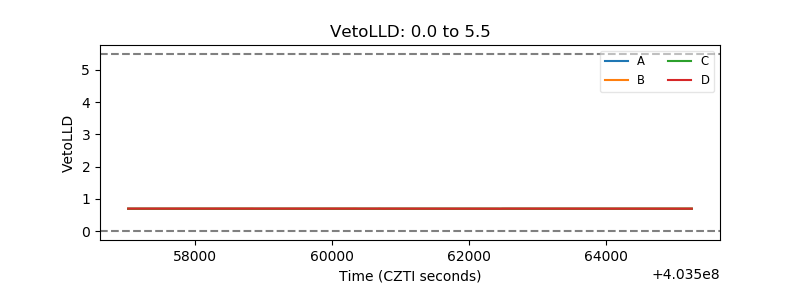 |
| Alpha Counter | 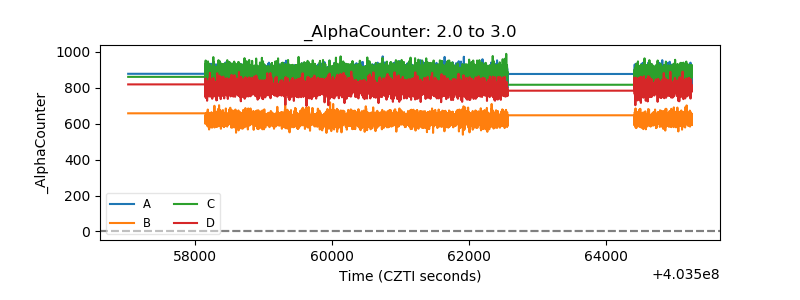 |
| _CPM_Rate | 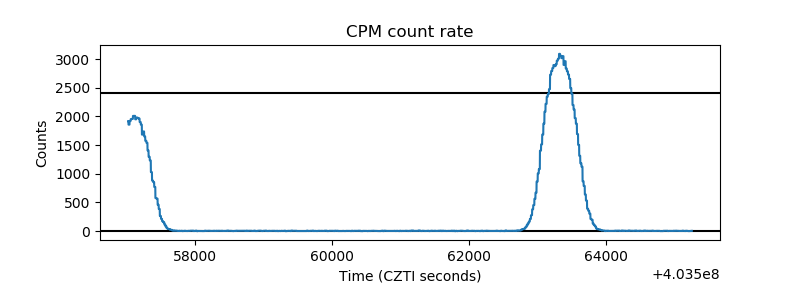 |
| CZT Counter | 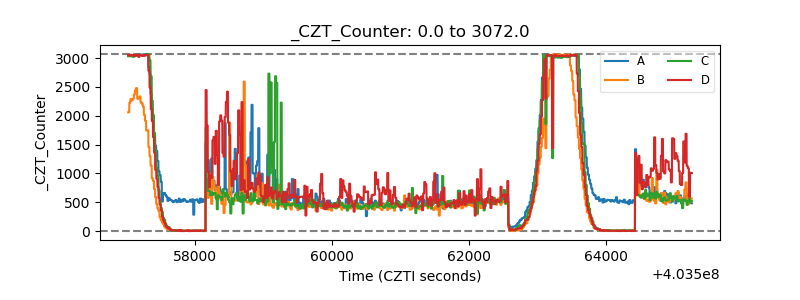 |
| +2.5 Volts monitor | 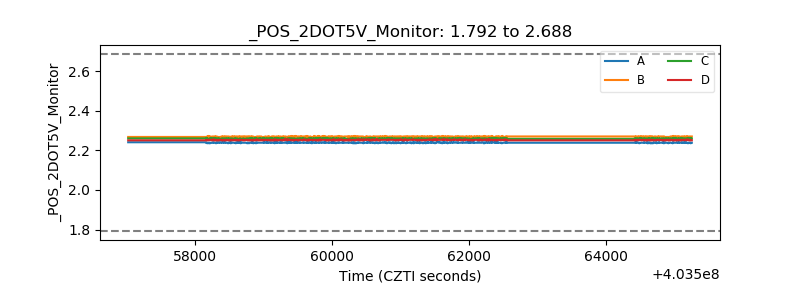 |
| +5 Volts monitor | 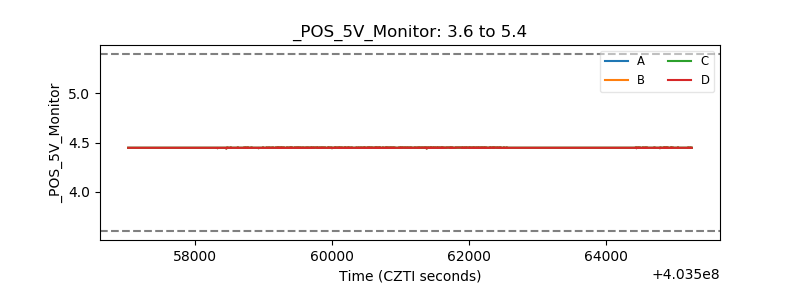 |
| _ROLL_ROT | 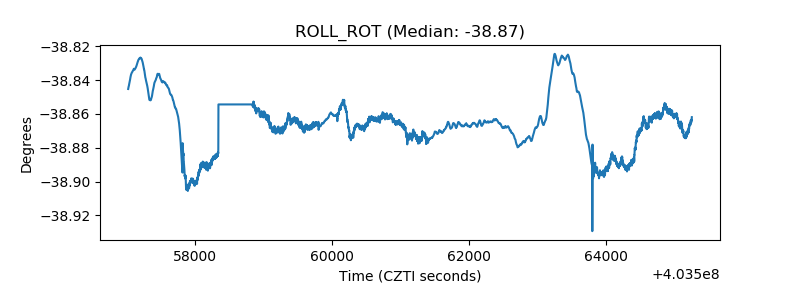 |
| _Roll_DEC | 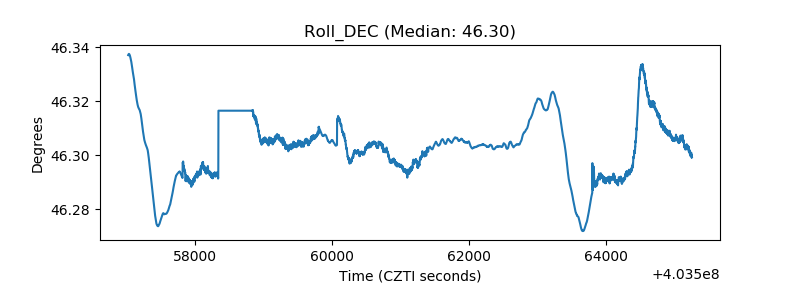 |
| _Roll_RA | 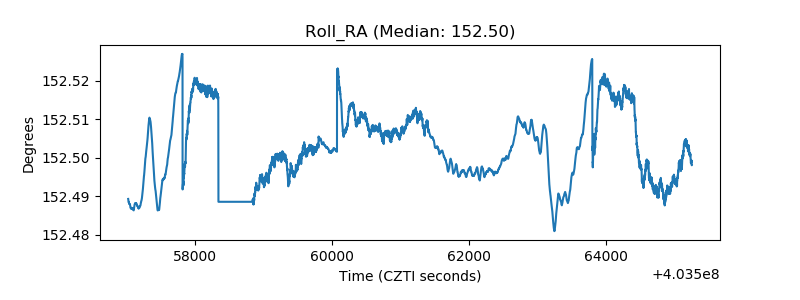 |
| Veto Counter | 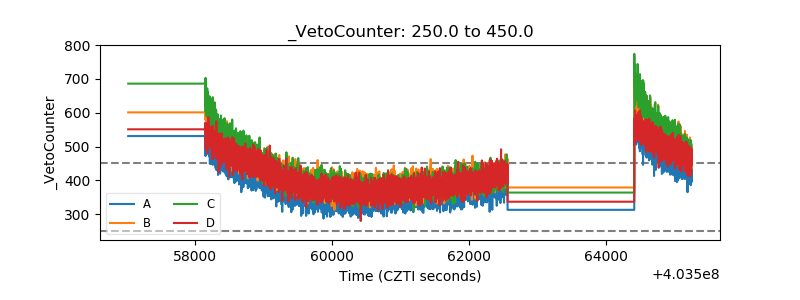 |