| Param | Original file | Final file |
|---|---|---|
| Filename | modeM0/AS1A11_065T21_9000005364_38113cztM0_level2.fits | modeM0/AS1A11_065T21_9000005364_38113cztM0_level2_quad_clean.evt |
| Size (bytes) | 1,505,024,640 | 313,781,760 |
| Size | 1.4 GB | 299.2 MB |
| Events in quadrant A | 11,237,750 | 2,181,571 |
| Events in quadrant B | 9,247,610 | 2,207,556 |
| Events in quadrant C | 10,835,513 | 2,142,039 |
| Events in quadrant D | 22,974,650 | 1,706,844 |
| Mode M9 | |||
|---|---|---|---|
| Quadrant | BADHDUFLAG | Total packets | Discarded packets |
| A | 0 | 72 | 0 |
| B | 0 | 72 | 0 |
| C | 0 | 72 | 0 |
| D | 0 | 72 | 0 |
| Mode M0 | |||
|---|---|---|---|
| Quadrant | BADHDUFLAG | Total packets | Discarded packets |
| A | 0 | 44896 | 5 |
| B | 0 | 39676 | 4 |
| C | 0 | 43622 | 4 |
| D | 0 | 80955 | 4 |
| Mode SS | |||
|---|---|---|---|
| Quadrant | BADHDUFLAG | Total packets | Discarded packets |
| A | 0 | 372 | 0 |
| B | 0 | 372 | 0 |
| C | 0 | 372 | 0 |
| D | 0 | 372 | 0 |
| Quadrant | Total seconds | Saturated seconds | Saturation percentage |
|---|---|---|---|
| A | 18337 | 193 | 1.052517% |
| B | 18337 | 198 | 1.079784% |
| C | 18337 | 427 | 2.328625% |
| D | 18337 | 3283 | 17.903692% |
Noise dominated data is calculated using 1-second bins in cleaned event files. If a bin has >2000 counts, and if more than 50% of those come from <1% of pixels, then it is considered to be noise-dominated and hence unusable.
| Quadrant | # 1 sec bins | Bins with >0 counts | Bins with >2000 counts | High rate bins dominated by noise | Noise dominated (total time) | Noise dominated (detector-on time) | Marked lightcurve |
|---|---|---|---|---|---|---|---|
| A | 25478 | 18341 | 145 | 145 | 0.57% | 0.79% | 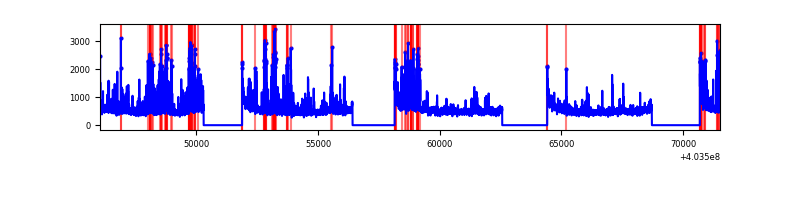 |
| B | 25478 | 18341 | 128 | 128 | 0.50% | 0.70% | 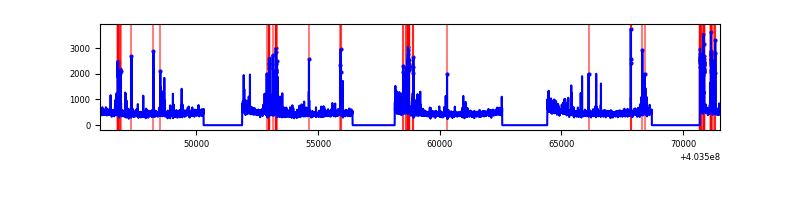 |
| C | 25478 | 18341 | 418 | 418 | 1.64% | 2.28% | 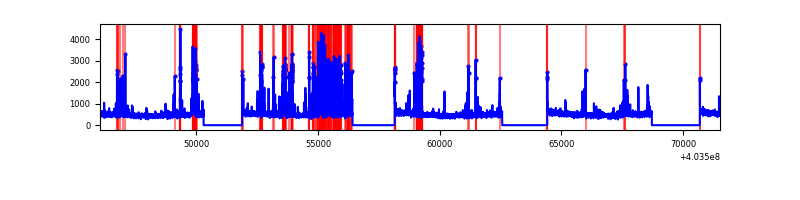 |
| D | 25478 | 18341 | 3328 | 3328 | 13.06% | 18.15% | 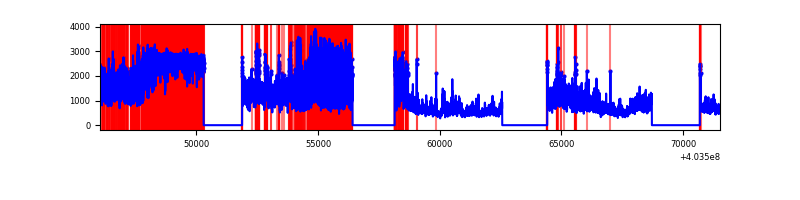 |
Top three noisy pixels from each quadrant. If the there are fewer than three noisy pixels in the level2.evt file, extra rows are filled as -1
| Pixel properties | Quadrant properties | ||||||
|---|---|---|---|---|---|---|---|
| Quadrant | DetID | PixID | Counts | Sigma | Mean | Median | Sigma |
| A | 12 | 16 | 1286181 | 3051.22 | 2111 | 2073 | 420.9 |
| A | 10 | 83 | 1036612 | 2458.21 | 2111 | 2073 | 420.9 |
| A | 12 | 189 | 295458 | 697.12 | 2111 | 2073 | 420.9 |
| B | 0 | 229 | 525595 | 1315.8 | 2102 | 2046 | 397.9 |
| B | 5 | 172 | 269211 | 671.45 | 2102 | 2046 | 397.9 |
| B | 0 | 189 | 81039 | 198.53 | 2102 | 2046 | 397.9 |
| C | 1 | 23 | 1534035 | 3236.85 | 2059 | 2077 | 473.3 |
| C | 15 | 214 | 740296 | 1559.77 | 2059 | 2077 | 473.3 |
| C | 0 | 239 | 331898 | 696.87 | 2059 | 2077 | 473.3 |
| D | 12 | 235 | 7406133 | 15000.84 | 1922 | 1888 | 493.6 |
| D | 1 | 20 | 6993504 | 14164.86 | 1922 | 1888 | 493.6 |
| D | 12 | 233 | 214220 | 430.18 | 1922 | 1888 | 493.6 |
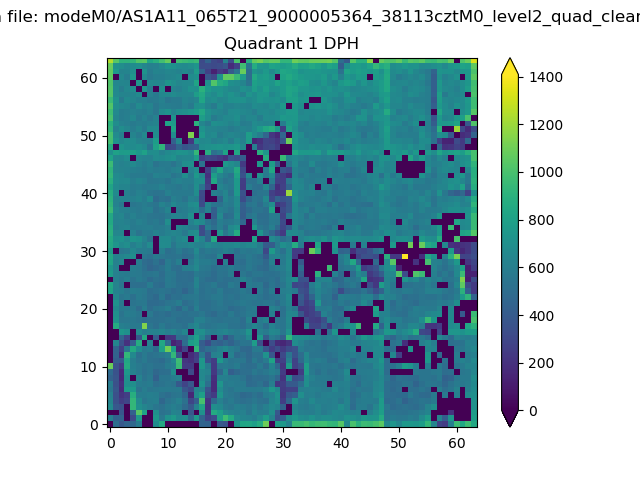
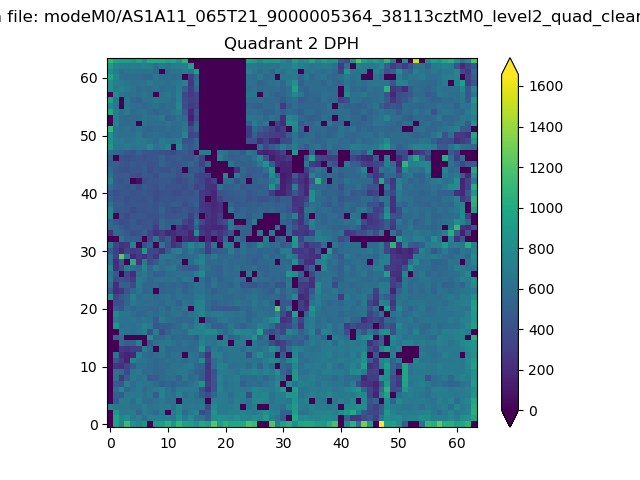
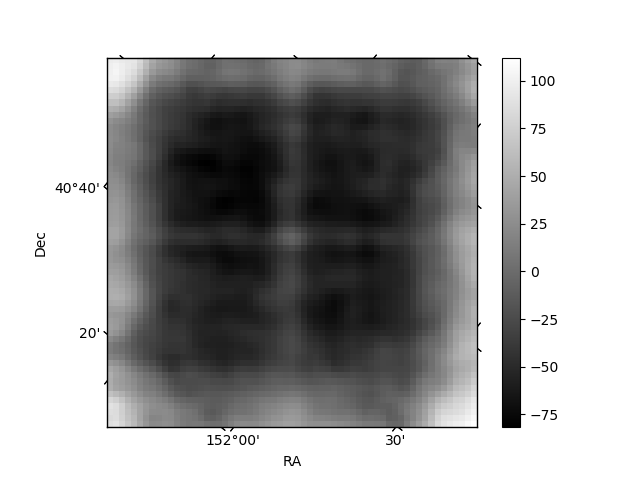
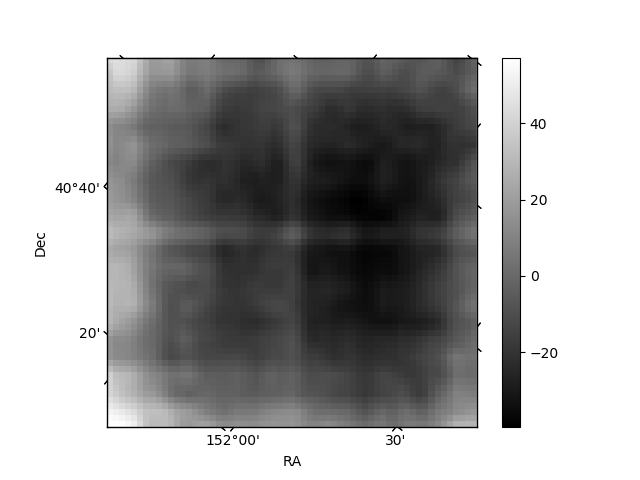
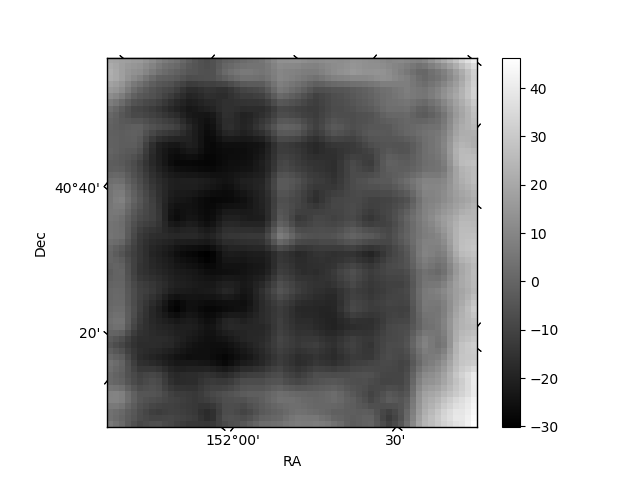
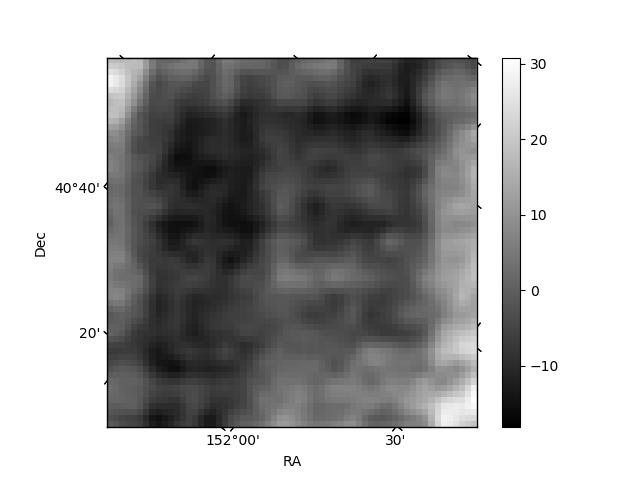
Histogram calculated using DETX and DETY for each event in the final _common_clean file
| Quadrant A |  |
 |
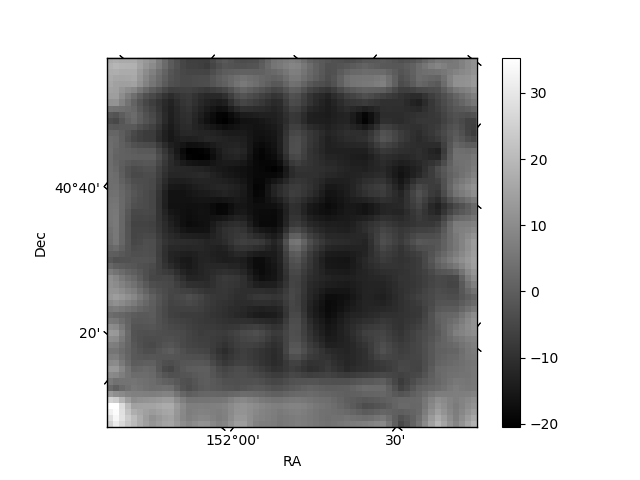
Quadrant B |
|---|---|---|---|
| Quadrant D | 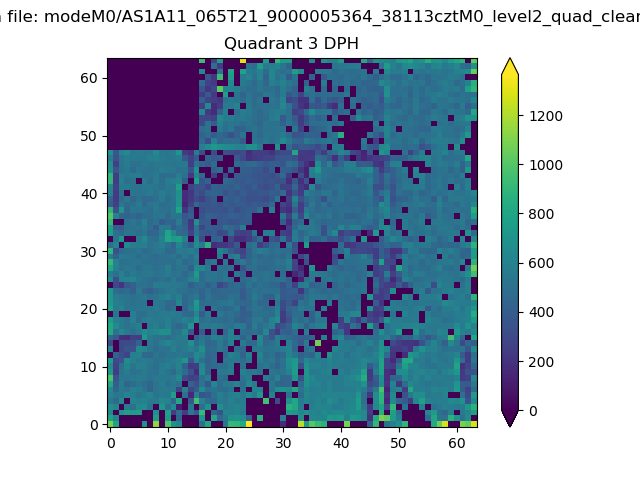 |
 |
Quadrant C |
| Plot type | Count rate plots | Images |
|---|---|---|
| Comparison with Poisson distribution Blue bars denote a histogram of data divided into 1 sec bins. Red curve is a Poisson curve with rate = median count rate of data. |
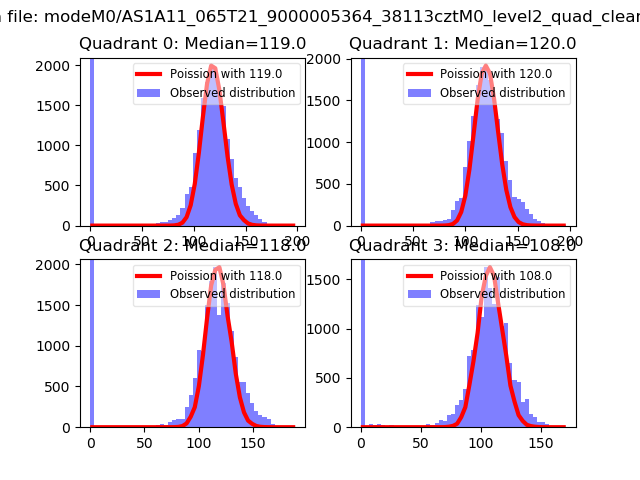 |
 |
| Quadrant-wise count rates Data is divided into 100 sec bins |
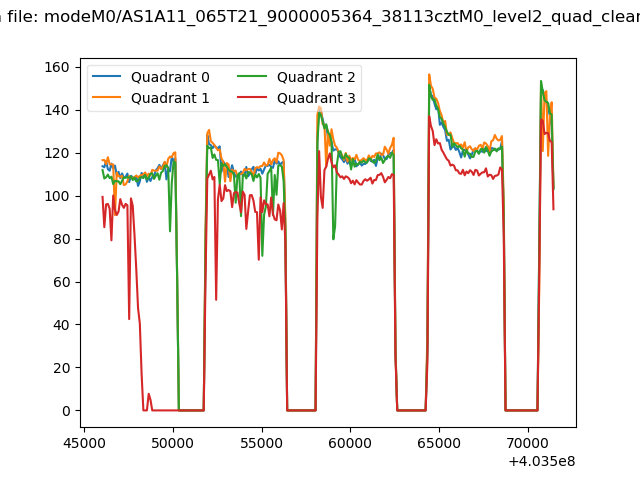 |
|
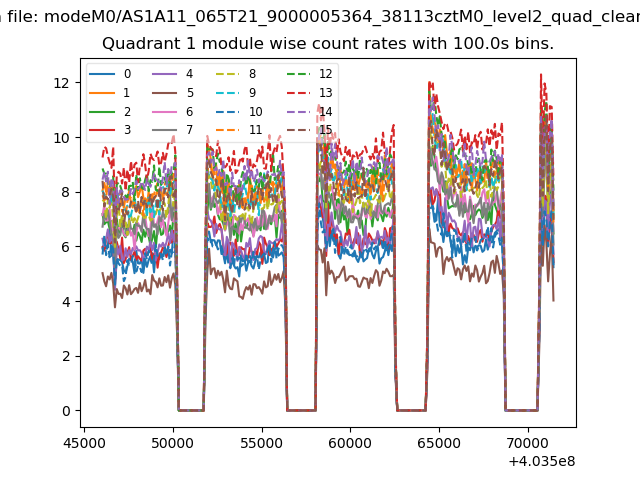
| Module-wise count rates for Quadrant A Data is divided into 100 sec bins |
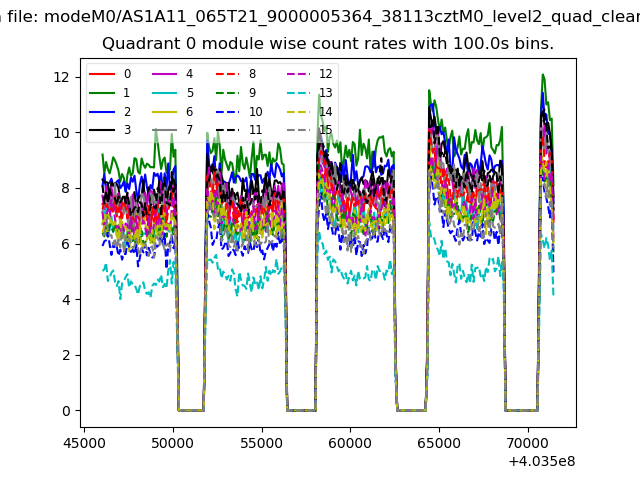 |
 |
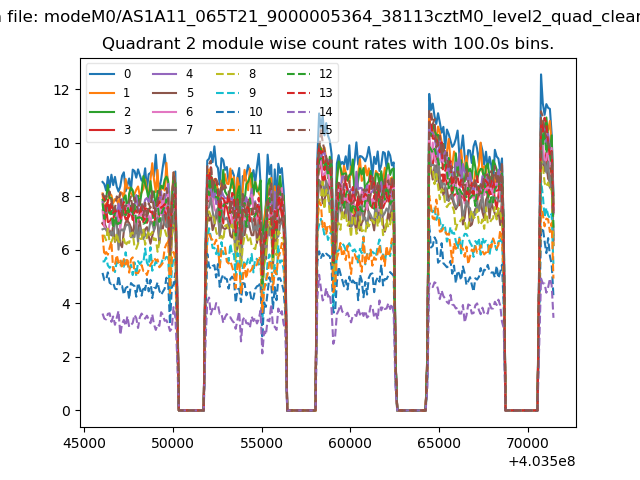
| Module-wise count rates for Quadrant B Data is divided into 100 sec bins |
 |
 |
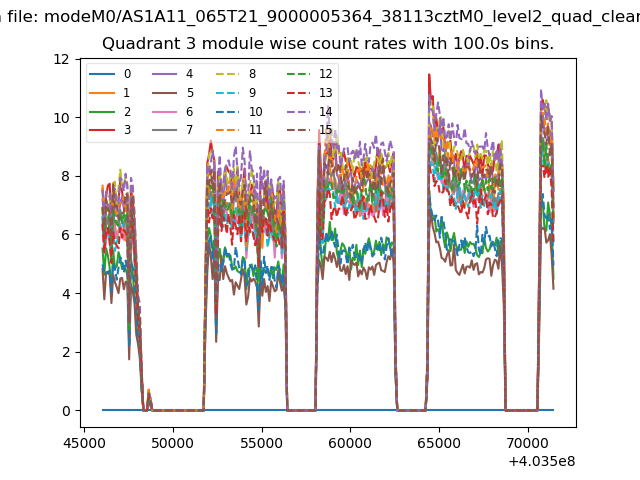
| Module-wise count rates for Quadrant C Data is divided into 100 sec bins |
 |
 |
| Module-wise count rates for Quadrant D Data is divided into 100 sec bins |
 |
 |
| Parameter | Plot |
|---|---|
| CZT HV Monitor | 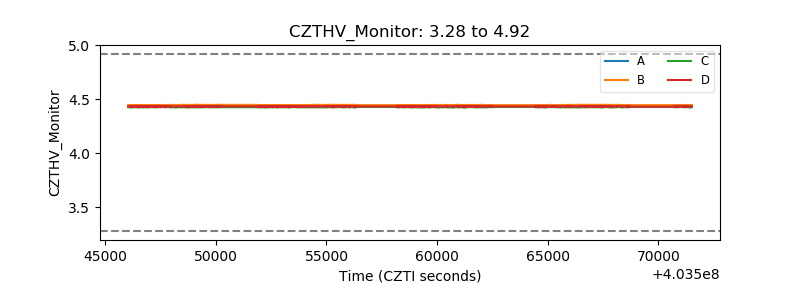 |
| D_VDD | 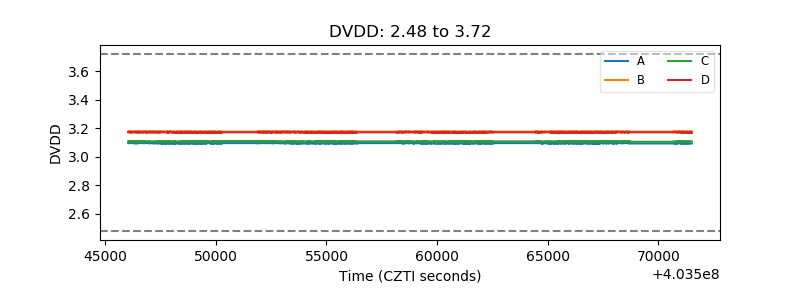 |
| Temperature 1 | 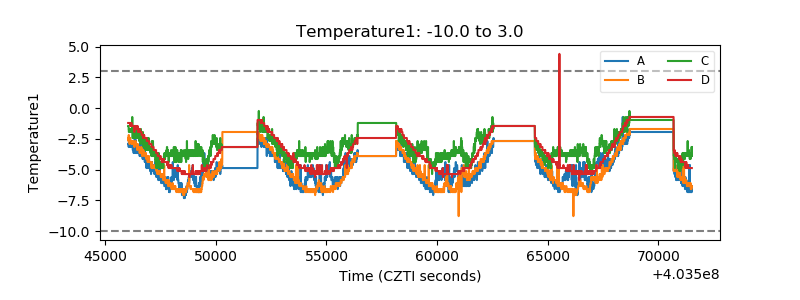 |
| Veto HV Monitor | 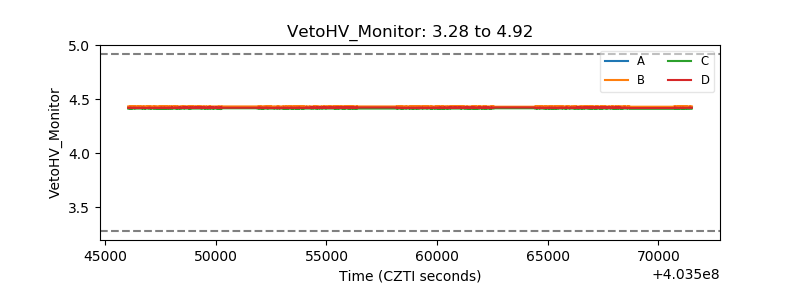 |
| Veto LLD | 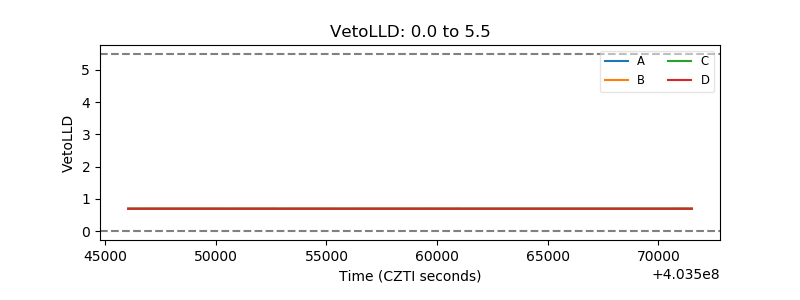 |
| Alpha Counter | 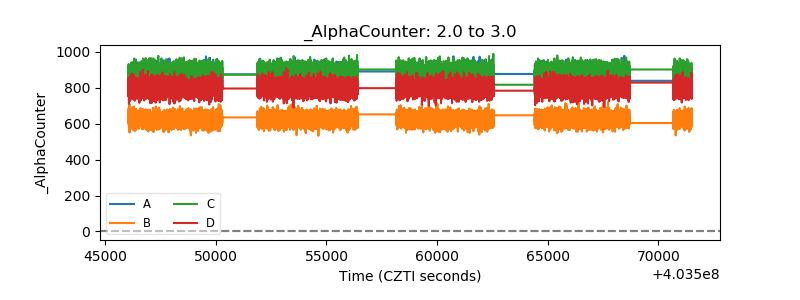 |
| _CPM_Rate | 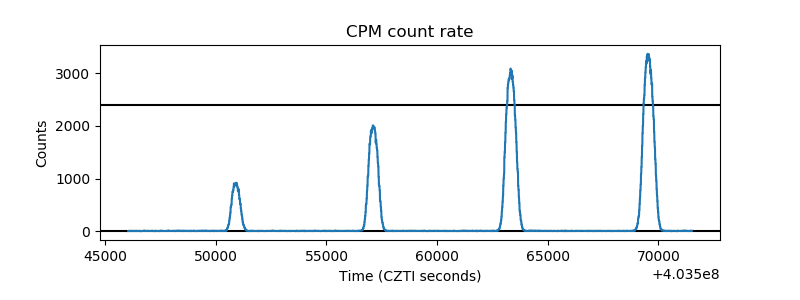 |
| CZT Counter | 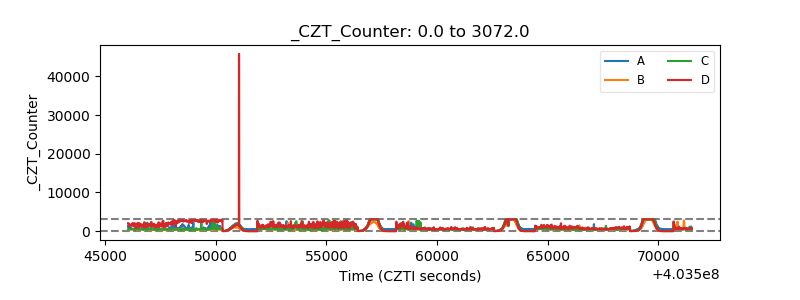 |
| +2.5 Volts monitor |  |
| +5 Volts monitor | 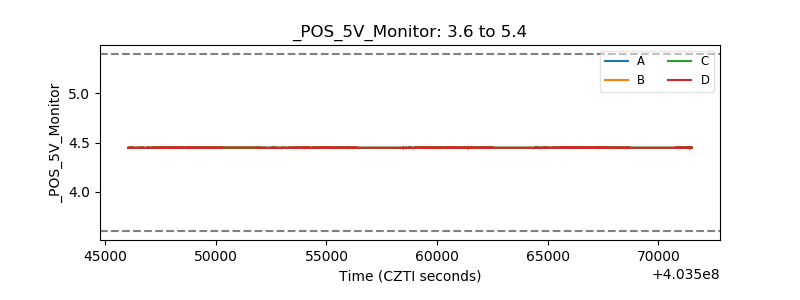 |
| _ROLL_ROT | 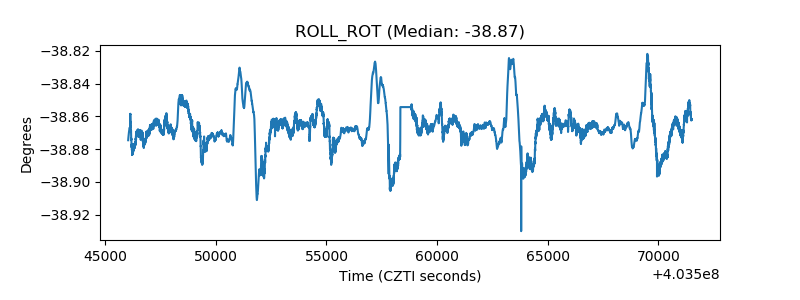 |
| _Roll_DEC | 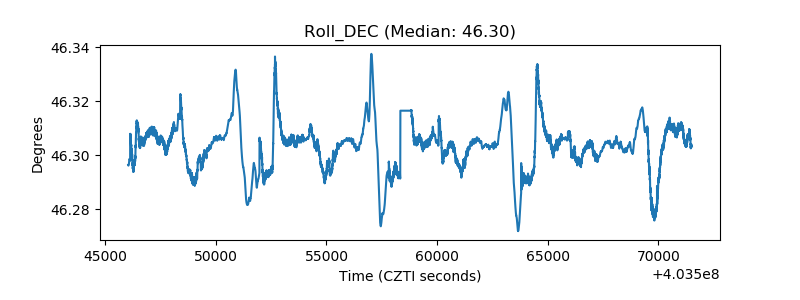 |
| _Roll_RA | 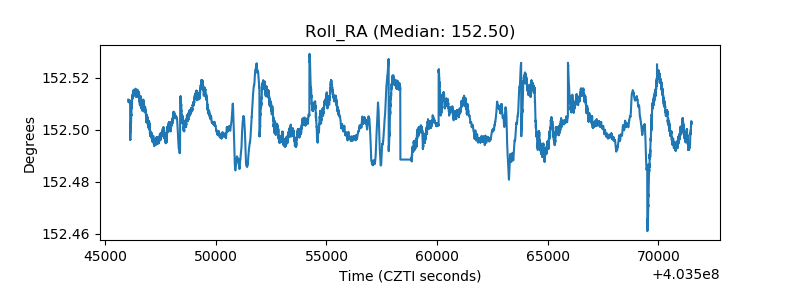 |
| Veto Counter | 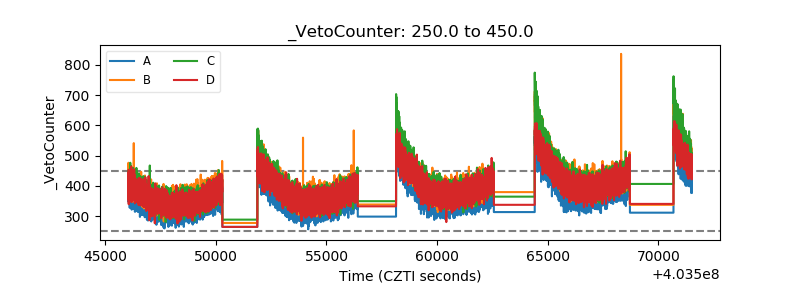 |