| Param | Original file | Final file |
|---|---|---|
| Filename | modeM0/AS1A11_065T21_9000005364_38114cztM0_level2.fits | modeM0/AS1A11_065T21_9000005364_38114cztM0_level2_quad_clean.evt |
| Size (bytes) | 315,907,200 | 96,782,400 |
| Size | 301.3 MB | 92.3 MB |
| Events in quadrant A | 2,894,885 | 659,890 |
| Events in quadrant B | 2,748,161 | 669,049 |
| Events in quadrant C | 2,605,357 | 654,904 |
| Events in quadrant D | 3,053,330 | 594,340 |
| Mode M9 | |||
|---|---|---|---|
| Quadrant | BADHDUFLAG | Total packets | Discarded packets |
| A | 0 | 32 | 0 |
| B | 0 | 32 | 0 |
| C | 0 | 32 | 0 |
| D | 0 | 33 | 0 |
| Mode M0 | |||
|---|---|---|---|
| Quadrant | BADHDUFLAG | Total packets | Discarded packets |
| A | 0 | 11669 | 3 |
| B | 0 | 11326 | 2 |
| C | 0 | 10679 | 2 |
| D | 0 | 12454 | 2 |
| Mode SS | |||
|---|---|---|---|
| Quadrant | BADHDUFLAG | Total packets | Discarded packets |
| A | 0 | 102 | 0 |
| B | 0 | 102 | 0 |
| C | 0 | 102 | 0 |
| D | 0 | 102 | 0 |
| Quadrant | Total seconds | Saturated seconds | Saturation percentage |
|---|---|---|---|
| A | 5032 | 33 | 0.655803% |
| B | 5032 | 115 | 2.285374% |
| C | 5032 | 13 | 0.258347% |
| D | 5032 | 24 | 0.476948% |
Noise dominated data is calculated using 1-second bins in cleaned event files. If a bin has >2000 counts, and if more than 50% of those come from <1% of pixels, then it is considered to be noise-dominated and hence unusable.
| Quadrant | # 1 sec bins | Bins with >0 counts | Bins with >2000 counts | High rate bins dominated by noise | Noise dominated (total time) | Noise dominated (detector-on time) | Marked lightcurve |
|---|---|---|---|---|---|---|---|
| A | 7095 | 5033 | 22 | 22 | 0.31% | 0.44% | 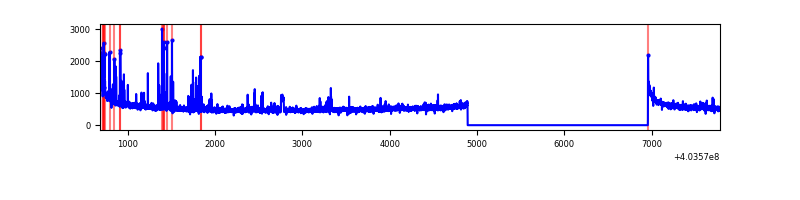 |
| B | 7095 | 5033 | 73 | 73 | 1.03% | 1.45% | 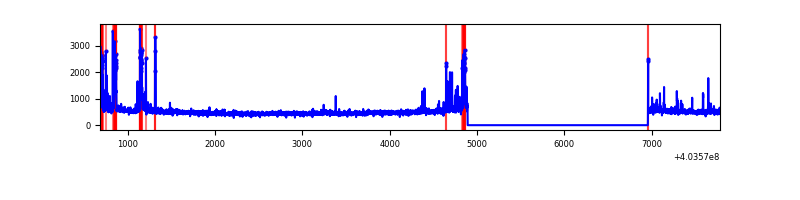 |
| C | 7095 | 5033 | 10 | 10 | 0.14% | 0.20% | 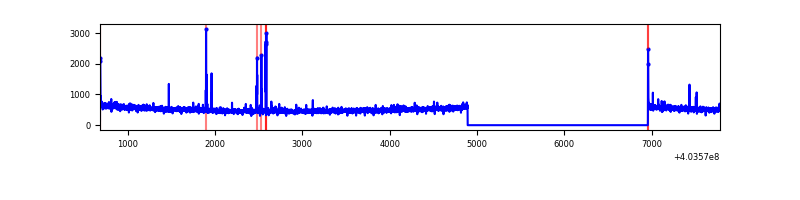 |
| D | 7095 | 5033 | 17 | 17 | 0.24% | 0.34% | 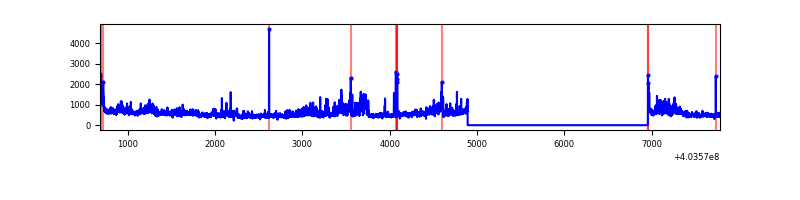 |
Top three noisy pixels from each quadrant. If the there are fewer than three noisy pixels in the level2.evt file, extra rows are filled as -1
| Pixel properties | Quadrant properties | ||||||
|---|---|---|---|---|---|---|---|
| Quadrant | DetID | PixID | Counts | Sigma | Mean | Median | Sigma |
| A | 10 | 83 | 345615 | 2852.61 | 605 | 597 | 120.9 |
| A | 12 | 16 | 115602 | 950.86 | 605 | 597 | 120.9 |
| A | 9 | 143 | 35322 | 287.11 | 605 | 597 | 120.9 |
| B | 0 | 229 | 243819 | 2130.36 | 600 | 586 | 114.2 |
| B | 5 | 172 | 96657 | 841.44 | 600 | 586 | 114.2 |
| B | 15 | 85 | 20143 | 171.29 | 600 | 586 | 114.2 |
| C | 15 | 214 | 210397 | 1538.07 | 595 | 601 | 136.4 |
| C | 0 | 239 | 36804 | 265.41 | 595 | 601 | 136.4 |
| C | 0 | 10 | 14062 | 98.69 | 595 | 601 | 136.4 |
| D | 12 | 235 | 649747 | 4590.16 | 584 | 569 | 141.4 |
| D | 13 | 249 | 32123 | 223.11 | 584 | 569 | 141.4 |
| D | 13 | 171 | 31164 | 216.33 | 584 | 569 | 141.4 |
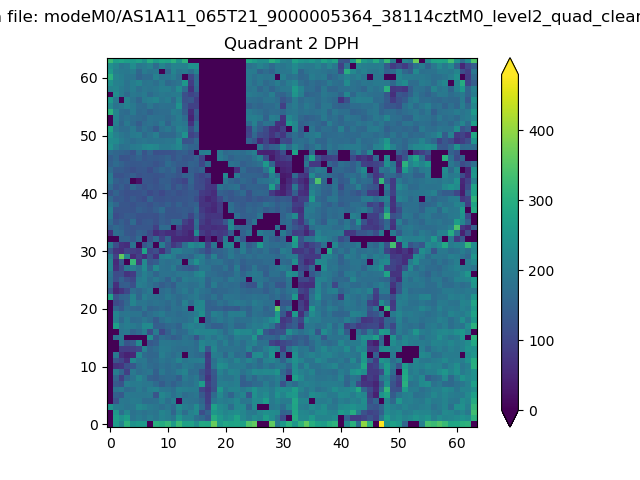
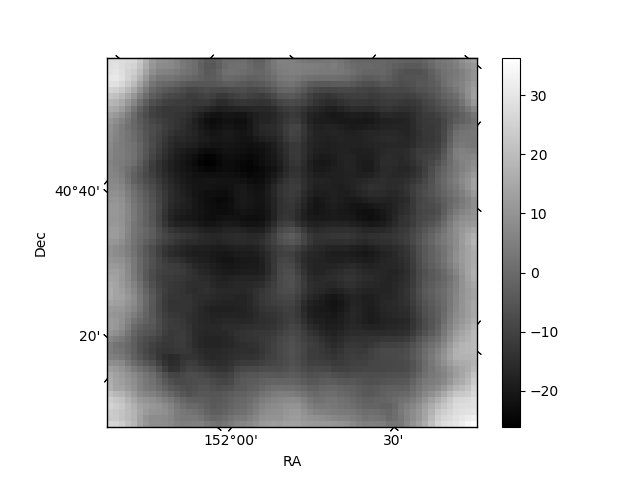
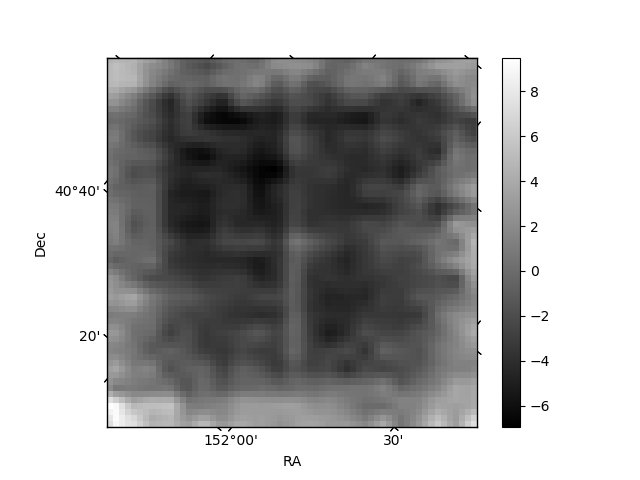
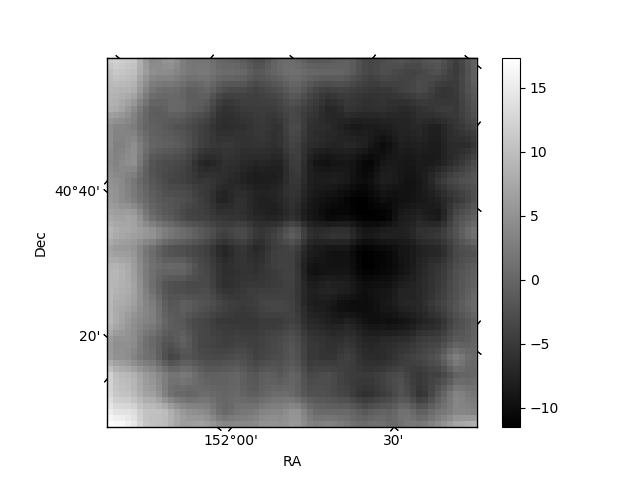
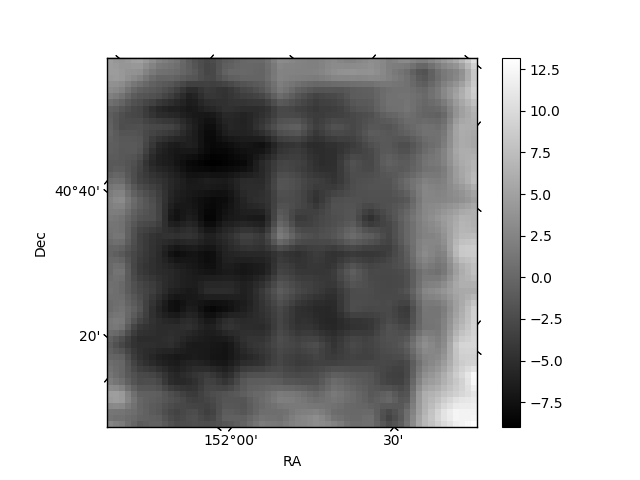
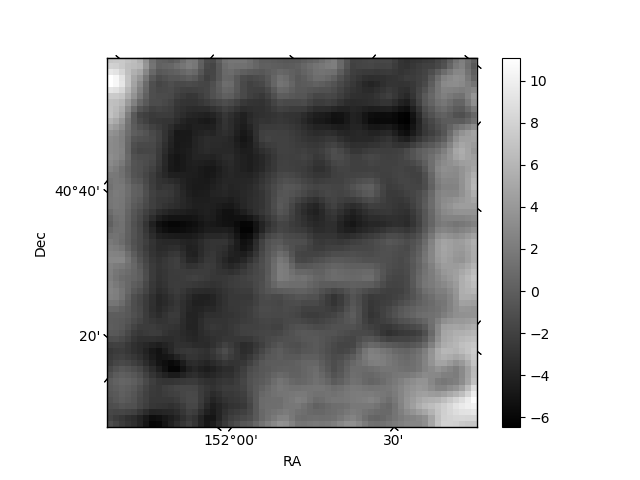
Histogram calculated using DETX and DETY for each event in the final _common_clean file
| Quadrant A | 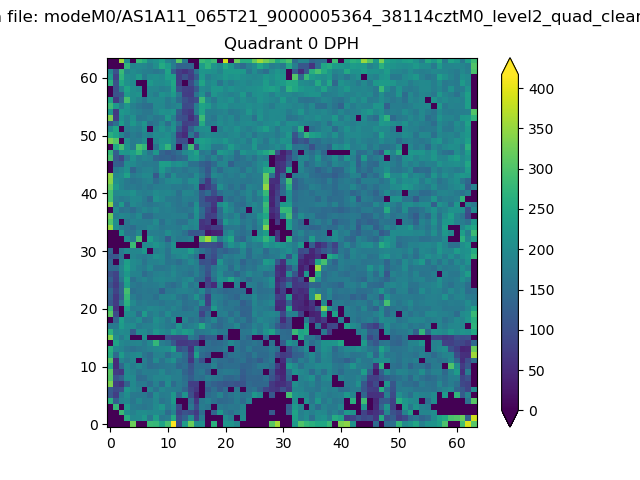 |
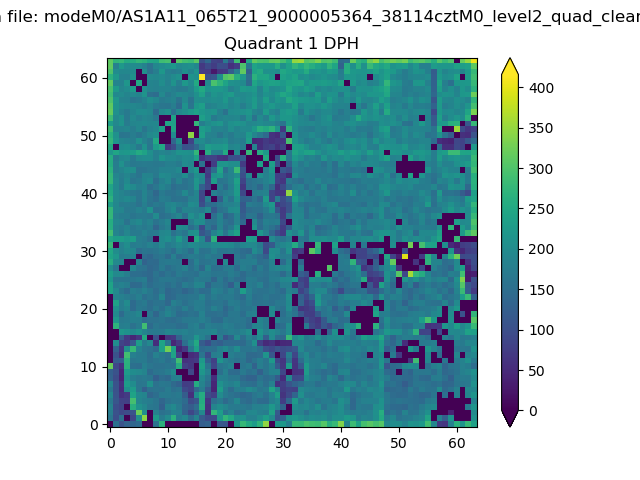 |
Quadrant B |
|---|---|---|---|
| Quadrant D | 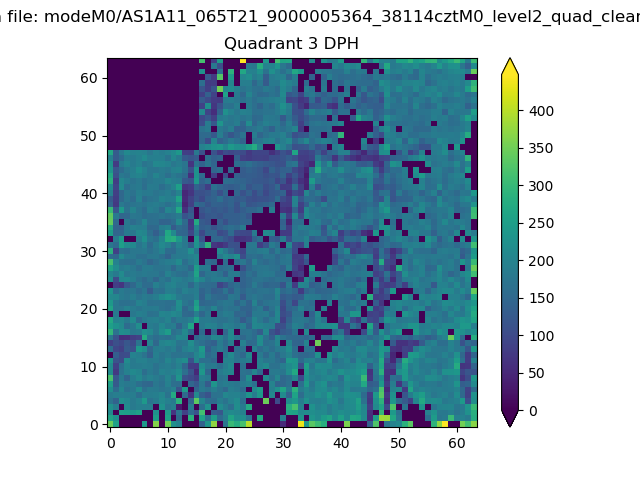 |
 |
Quadrant C |
| Plot type | Count rate plots | Images |
|---|---|---|
| Comparison with Poisson distribution Blue bars denote a histogram of data divided into 1 sec bins. Red curve is a Poisson curve with rate = median count rate of data. |
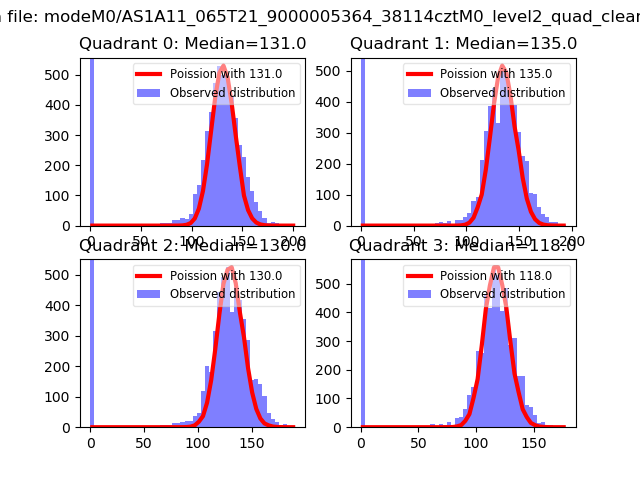 |
 |
| Quadrant-wise count rates Data is divided into 100 sec bins |
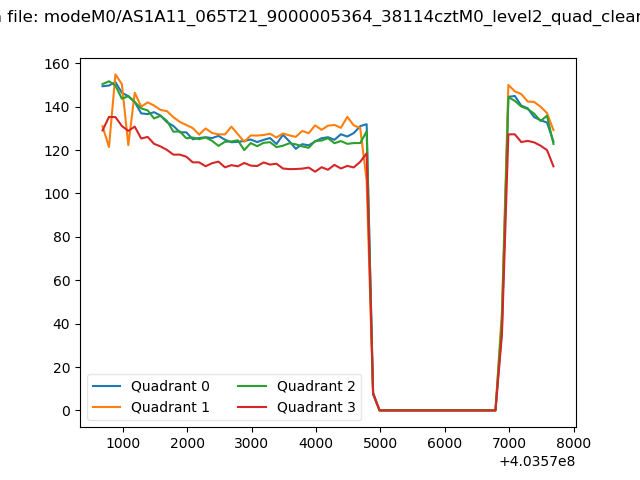 |
|
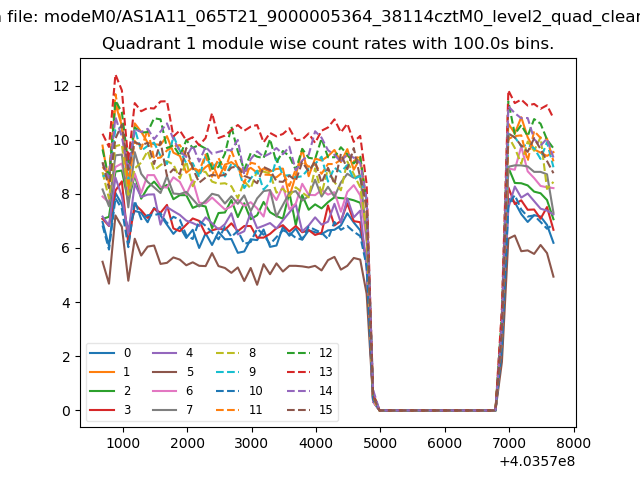
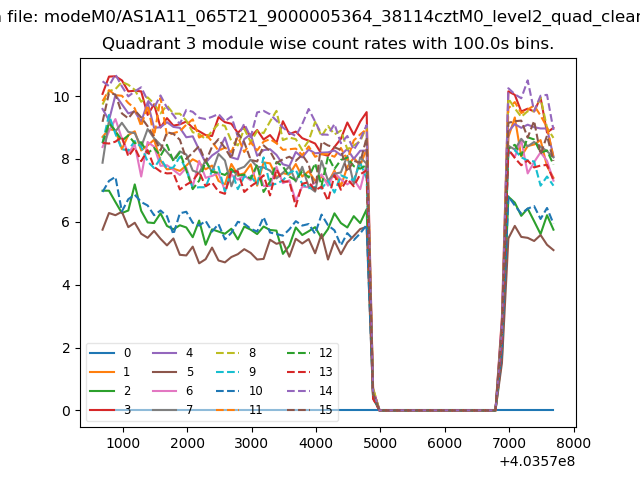
| Module-wise count rates for Quadrant A Data is divided into 100 sec bins |
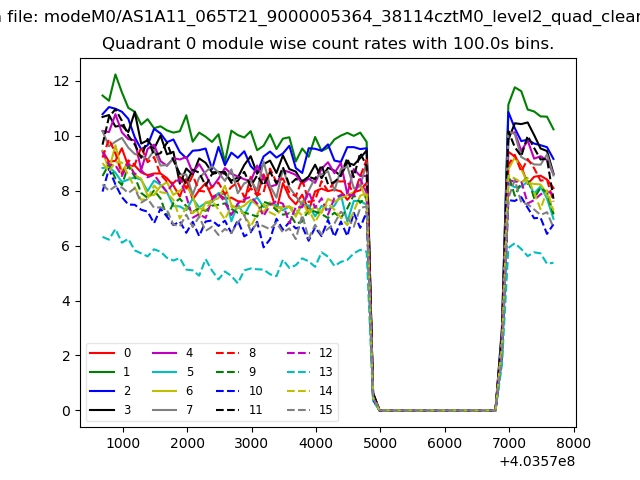 |
 |
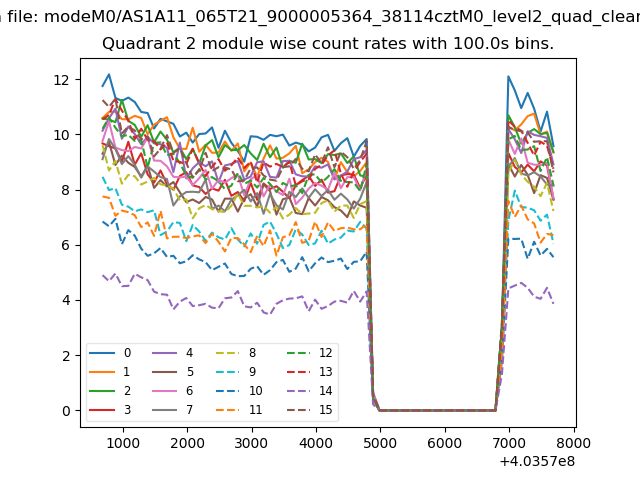
| Module-wise count rates for Quadrant B Data is divided into 100 sec bins |
 |
 |
| Module-wise count rates for Quadrant C Data is divided into 100 sec bins |
 |
 |
| Module-wise count rates for Quadrant D Data is divided into 100 sec bins |
 |
 |
| Parameter | Plot |
|---|---|
| CZT HV Monitor | 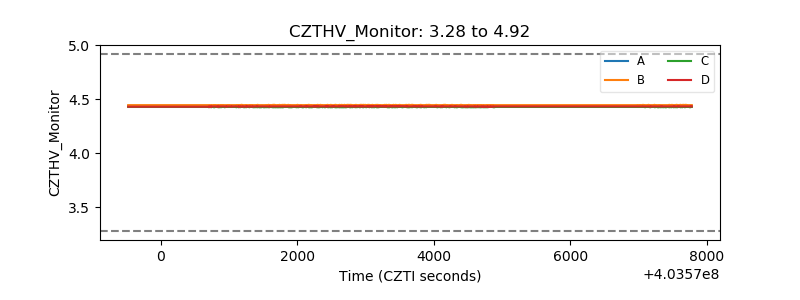 |
| D_VDD | 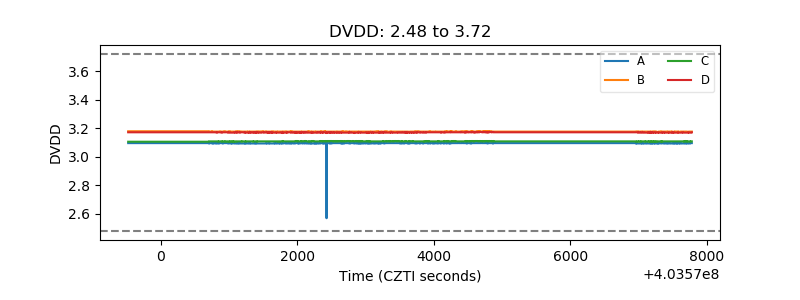 |
| Temperature 1 | 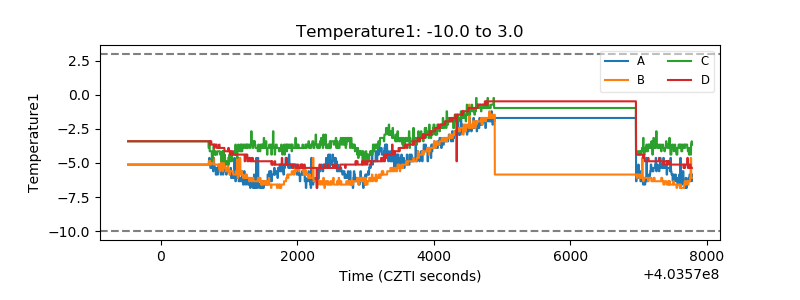 |
| Veto HV Monitor | 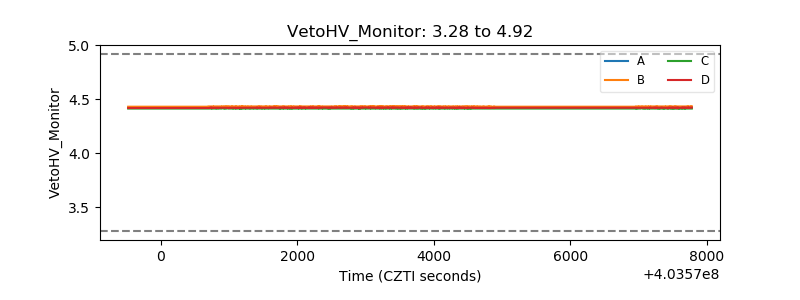 |
| Veto LLD | 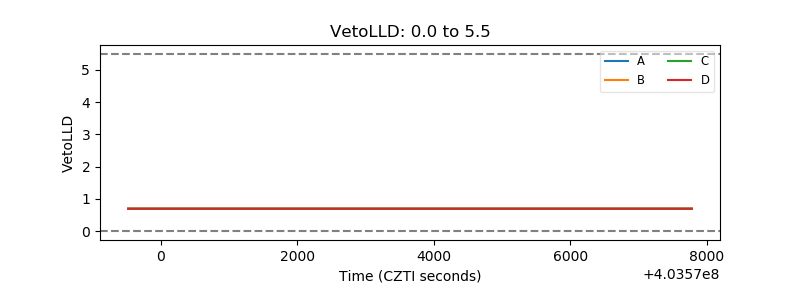 |
| Alpha Counter | 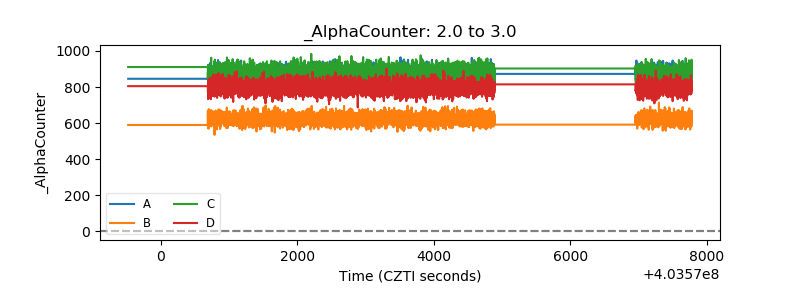 |
| _CPM_Rate | 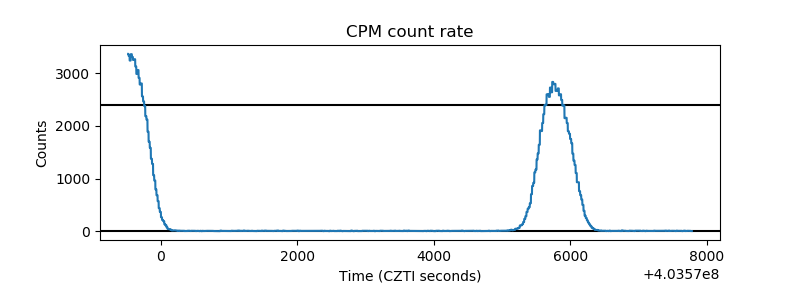 |
| CZT Counter | 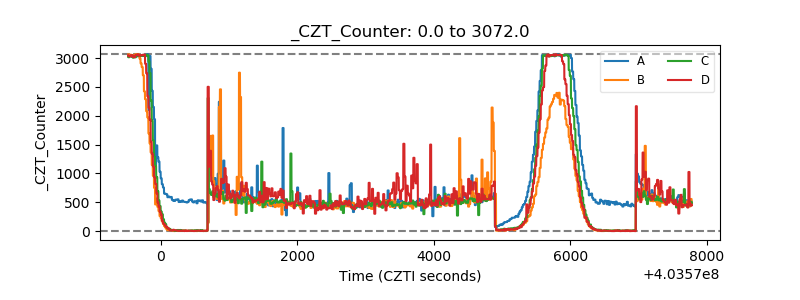 |
| +2.5 Volts monitor | 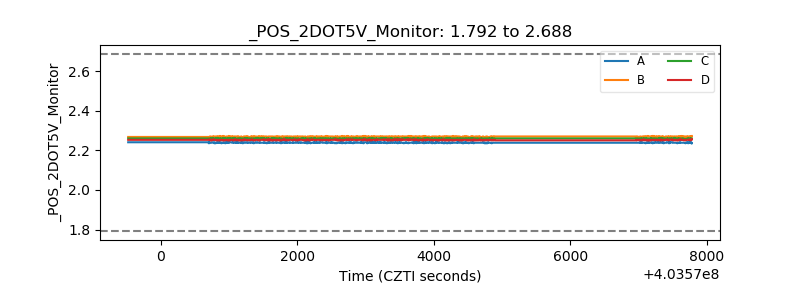 |
| +5 Volts monitor | 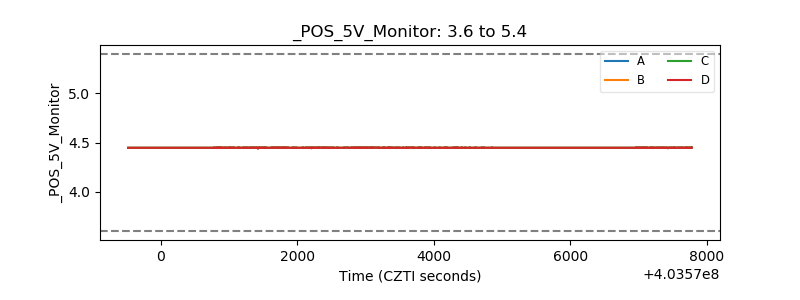 |
| _ROLL_ROT | 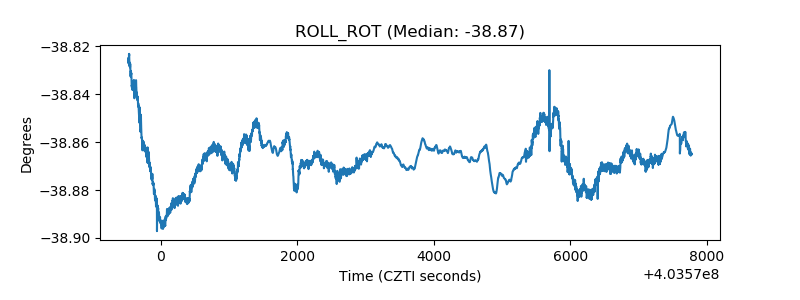 |
| _Roll_DEC | 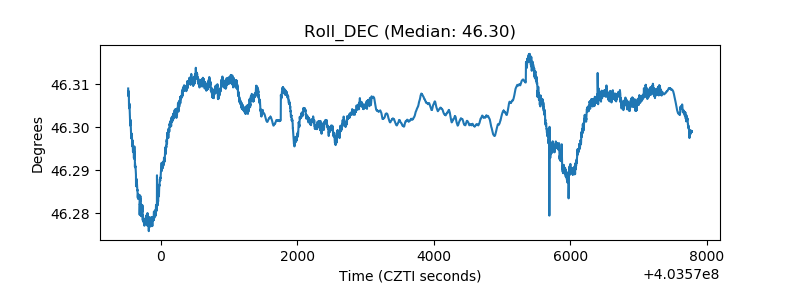 |
| _Roll_RA | 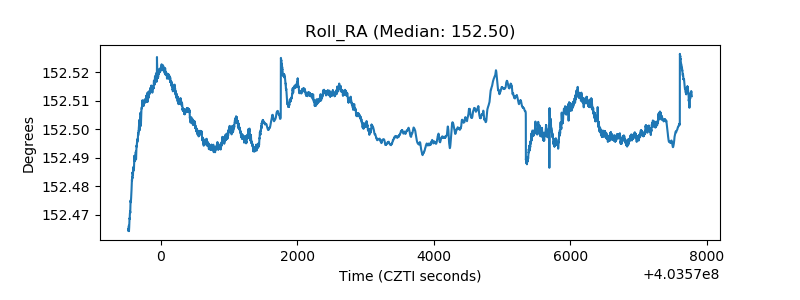 |
| Veto Counter | 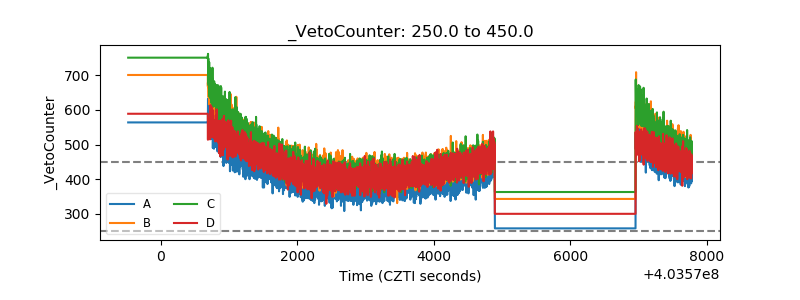 |