| Param | Original file | Final file |
|---|---|---|
| Filename | modeM0/AS1A11_065T21_9000005364_38116cztM0_level2.fits | modeM0/AS1A11_065T21_9000005364_38116cztM0_level2_quad_clean.evt |
| Size (bytes) | 330,454,080 | 91,399,680 |
| Size | 315.1 MB | 87.2 MB |
| Events in quadrant A | 2,667,481 | 622,503 |
| Events in quadrant B | 2,562,878 | 630,462 |
| Events in quadrant C | 2,458,038 | 606,778 |
| Events in quadrant D | 4,145,515 | 549,619 |
| Mode M9 | |||
|---|---|---|---|
| Quadrant | BADHDUFLAG | Total packets | Discarded packets |
| A | 0 | 22 | 0 |
| B | 0 | 22 | 0 |
| C | 0 | 22 | 0 |
| D | 0 | 23 | 0 |
| Mode M0 | |||
|---|---|---|---|
| Quadrant | BADHDUFLAG | Total packets | Discarded packets |
| A | 0 | 11044 | 3 |
| B | 0 | 11158 | 2 |
| C | 0 | 10450 | 2 |
| D | 0 | 15952 | 2 |
| Mode SS | |||
|---|---|---|---|
| Quadrant | BADHDUFLAG | Total packets | Discarded packets |
| A | 0 | 104 | 0 |
| B | 0 | 104 | 0 |
| C | 0 | 104 | 0 |
| D | 0 | 104 | 0 |
| Quadrant | Total seconds | Saturated seconds | Saturation percentage |
|---|---|---|---|
| A | 5117 | 10 | 0.195427% |
| B | 5117 | 81 | 1.582959% |
| C | 5117 | 3 | 0.058628% |
| D | 5117 | 51 | 0.996678% |
Noise dominated data is calculated using 1-second bins in cleaned event files. If a bin has >2000 counts, and if more than 50% of those come from <1% of pixels, then it is considered to be noise-dominated and hence unusable.
| Quadrant | # 1 sec bins | Bins with >0 counts | Bins with >2000 counts | High rate bins dominated by noise | Noise dominated (total time) | Noise dominated (detector-on time) | Marked lightcurve |
|---|---|---|---|---|---|---|---|
| A | 7239 | 5118 | 3 | 3 | 0.04% | 0.06% | 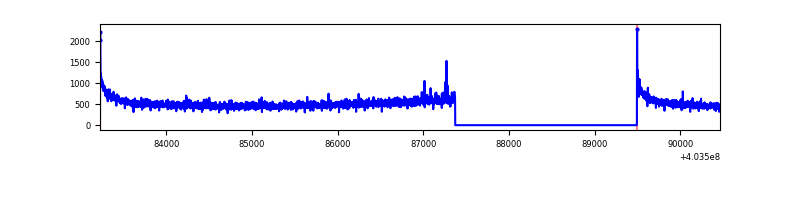 |
| B | 7239 | 5118 | 51 | 51 | 0.70% | 1.00% | 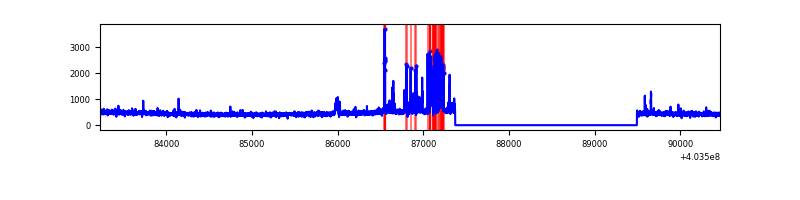 |
| C | 7239 | 5118 | 1 | 1 | 0.01% | 0.02% | 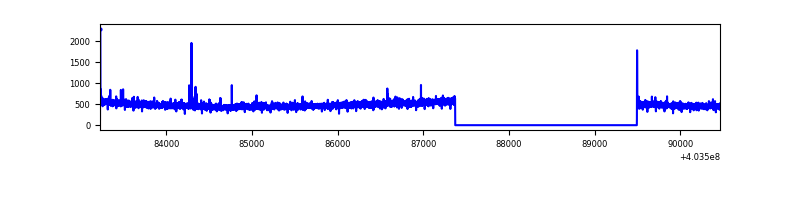 |
| D | 7239 | 5118 | 43 | 43 | 0.59% | 0.84% | 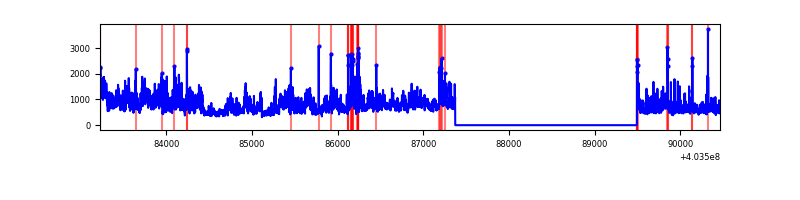 |
Top three noisy pixels from each quadrant. If the there are fewer than three noisy pixels in the level2.evt file, extra rows are filled as -1
| Pixel properties | Quadrant properties | ||||||
|---|---|---|---|---|---|---|---|
| Quadrant | DetID | PixID | Counts | Sigma | Mean | Median | Sigma |
| A | 10 | 83 | 354417 | 3033.41 | 581 | 573 | 116.6 |
| A | 12 | 189 | 40384 | 341.29 | 581 | 573 | 116.6 |
| A | 12 | 16 | 10831 | 87.94 | 581 | 573 | 116.6 |
| B | 5 | 172 | 150822 | 1354.18 | 576 | 563 | 111.0 |
| B | 0 | 229 | 138598 | 1244.01 | 576 | 563 | 111.0 |
| B | 12 | 111 | 13335 | 115.11 | 576 | 563 | 111.0 |
| C | 15 | 214 | 213494 | 1619.71 | 563 | 566 | 131.5 |
| C | 1 | 23 | 20256 | 149.78 | 563 | 566 | 131.5 |
| C | 0 | 10 | 10757 | 77.52 | 563 | 566 | 131.5 |
| D | 12 | 235 | 1704026 | 12514.74 | 555 | 538 | 136.1 |
| D | 13 | 249 | 161561 | 1182.96 | 555 | 538 | 136.1 |
| D | 1 | 52 | 40772 | 295.58 | 555 | 538 | 136.1 |
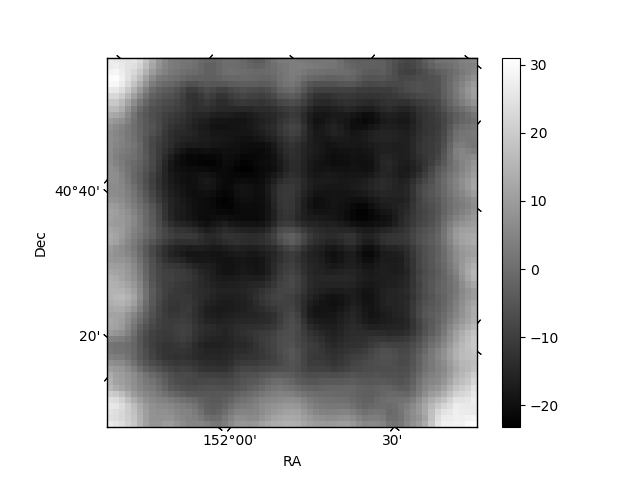
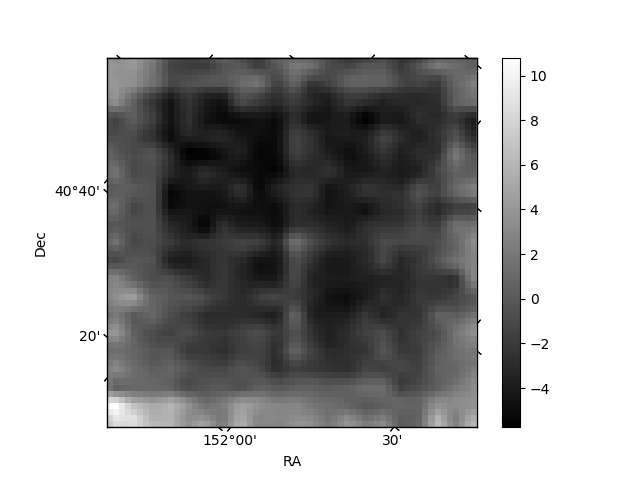
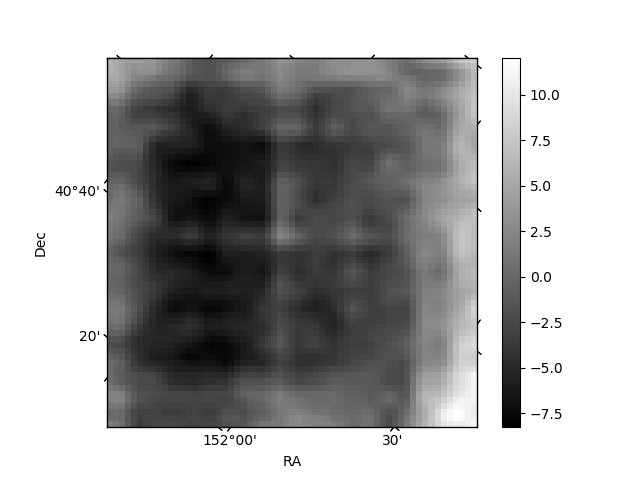
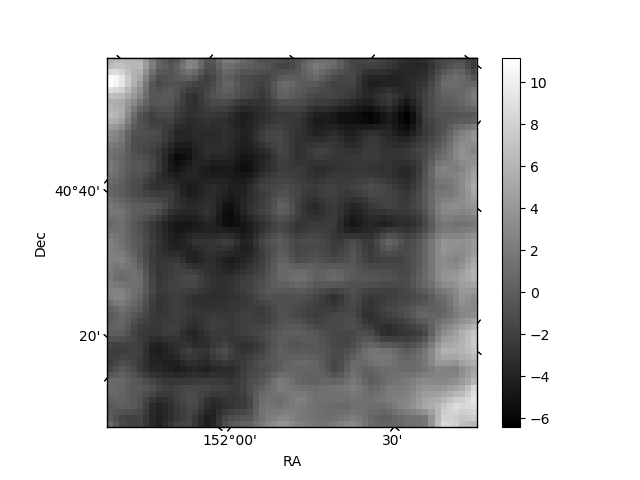
Histogram calculated using DETX and DETY for each event in the final _common_clean file
| Quadrant A | 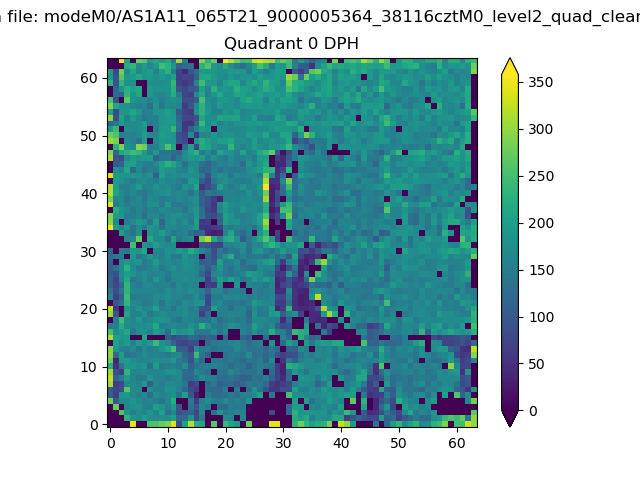 |
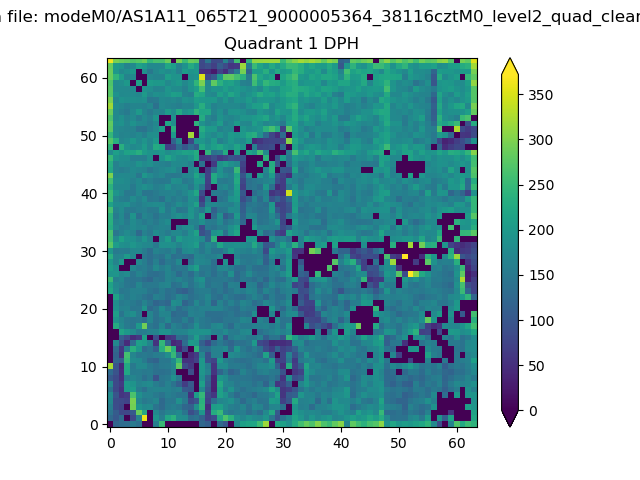 |
Quadrant B |
|---|---|---|---|
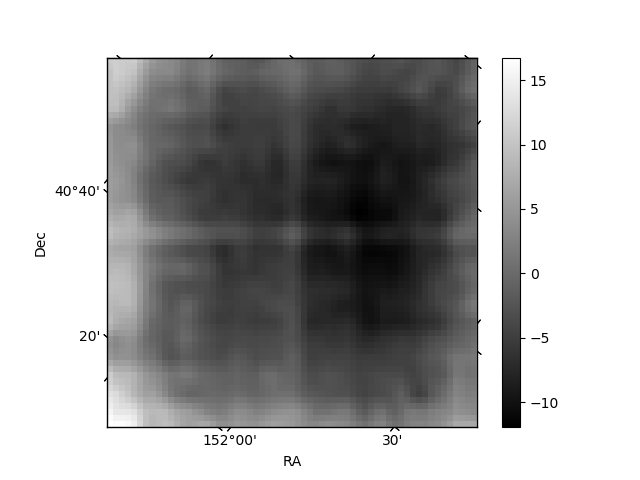
| Quadrant D | 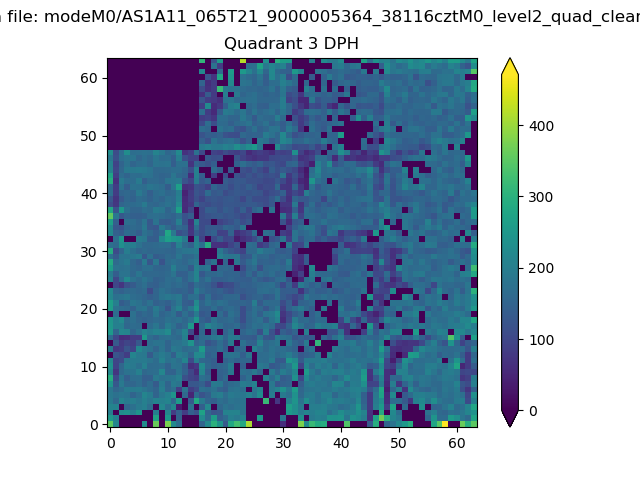 |
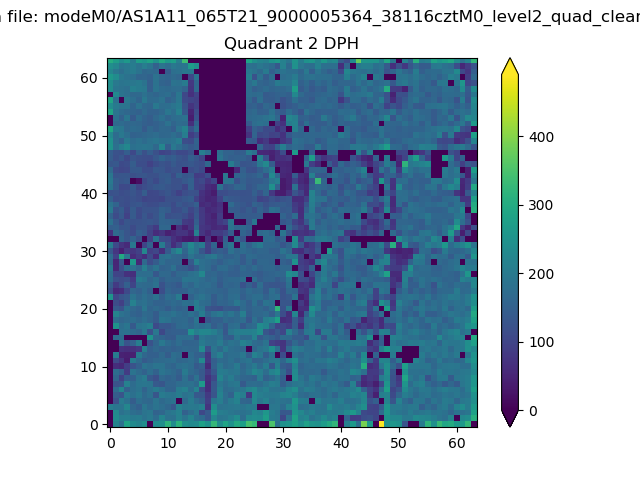 |
Quadrant C |
| Plot type | Count rate plots | Images |
|---|---|---|
| Comparison with Poisson distribution Blue bars denote a histogram of data divided into 1 sec bins. Red curve is a Poisson curve with rate = median count rate of data. |
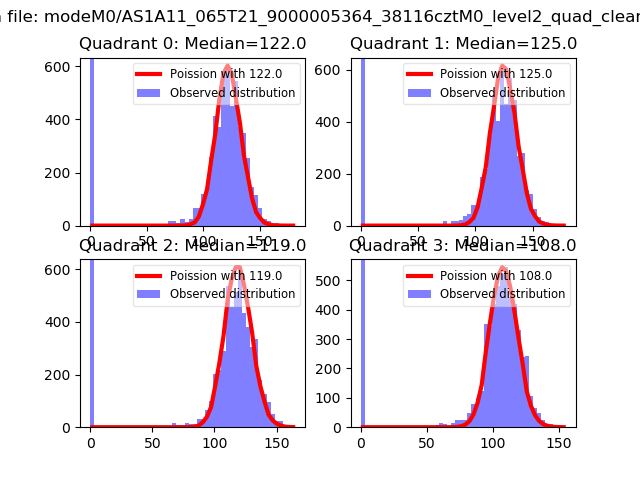 |
 |
| Quadrant-wise count rates Data is divided into 100 sec bins |
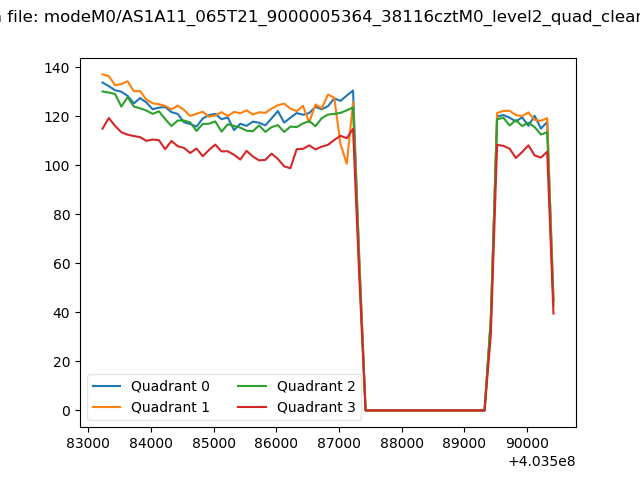 |
|
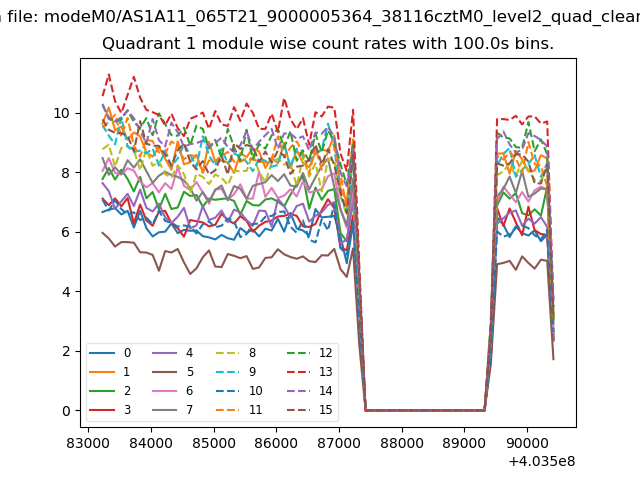
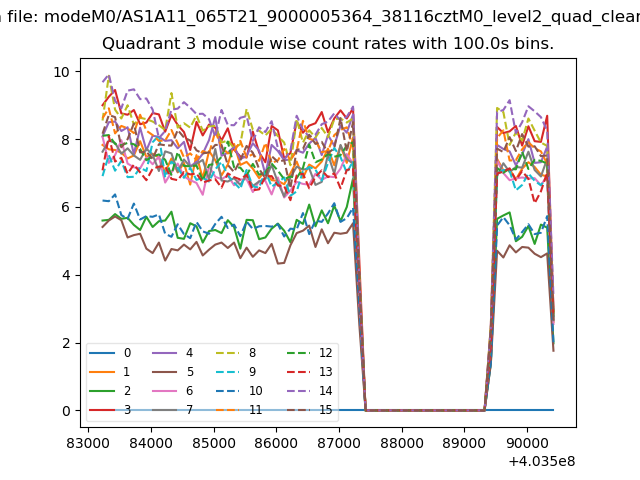
| Module-wise count rates for Quadrant A Data is divided into 100 sec bins |
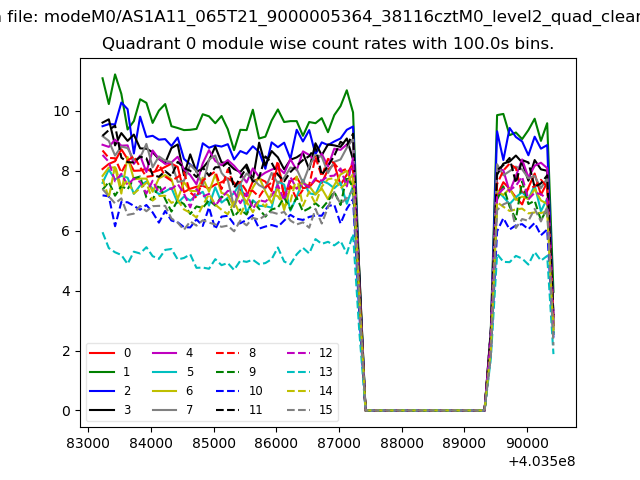 |
 |
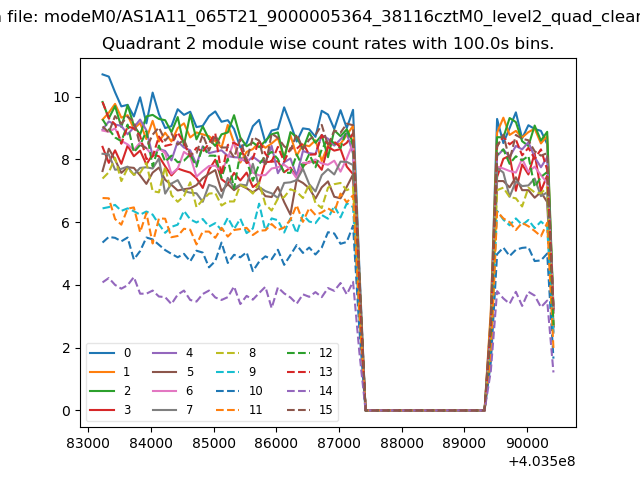
| Module-wise count rates for Quadrant B Data is divided into 100 sec bins |
 |
 |
| Module-wise count rates for Quadrant C Data is divided into 100 sec bins |
 |
 |
| Module-wise count rates for Quadrant D Data is divided into 100 sec bins |
 |
 |
| Parameter | Plot |
|---|---|
| CZT HV Monitor | 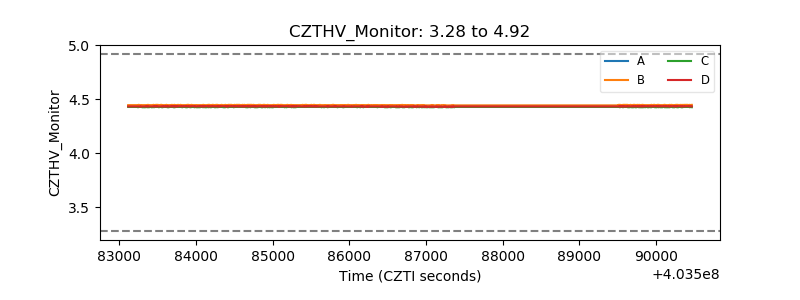 |
| D_VDD | 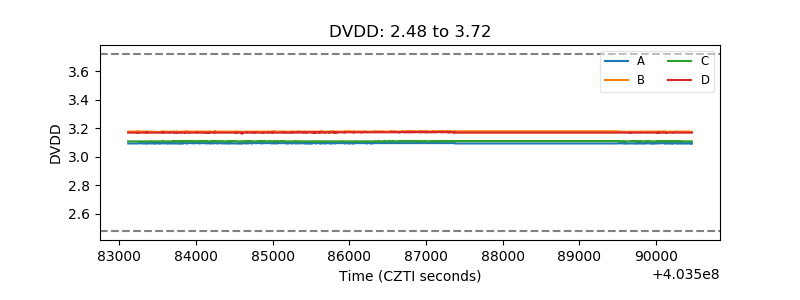 |
| Temperature 1 | 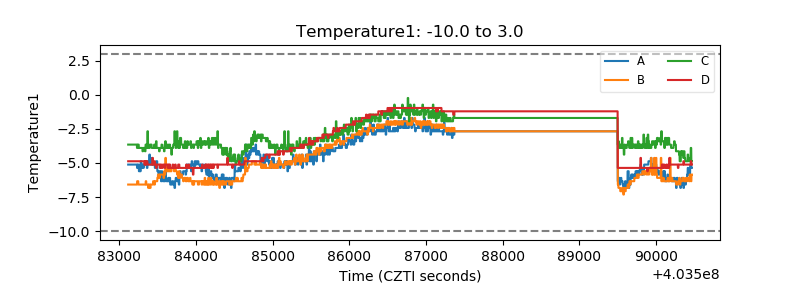 |
| Veto HV Monitor | 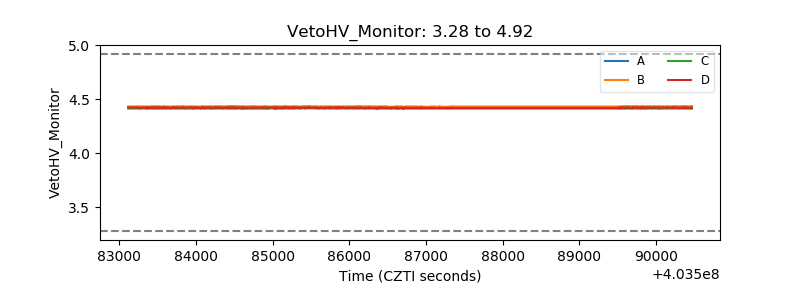 |
| Veto LLD | 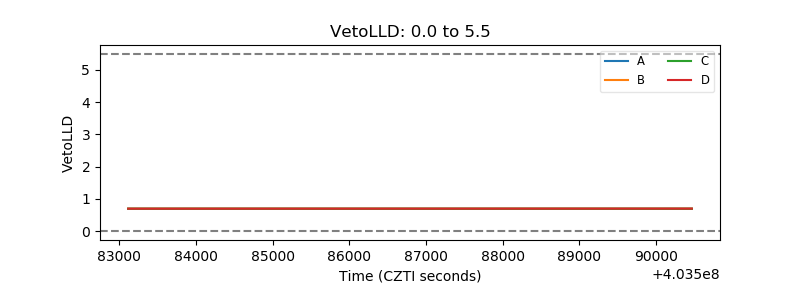 |
| Alpha Counter | 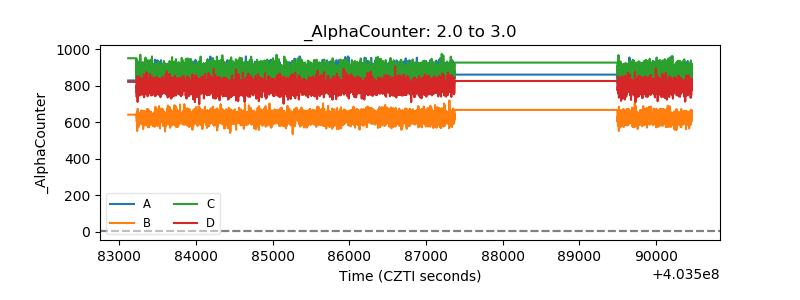 |
| _CPM_Rate | 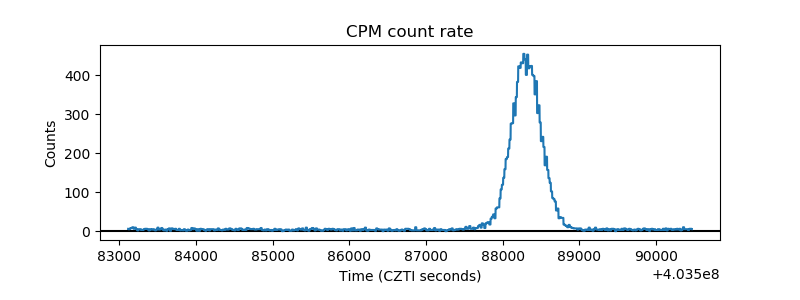 |
| CZT Counter | 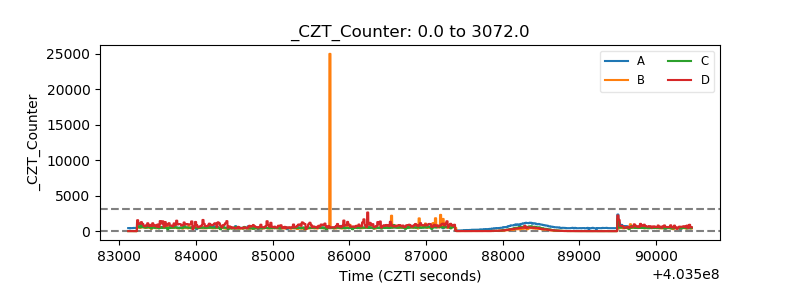 |
| +2.5 Volts monitor | 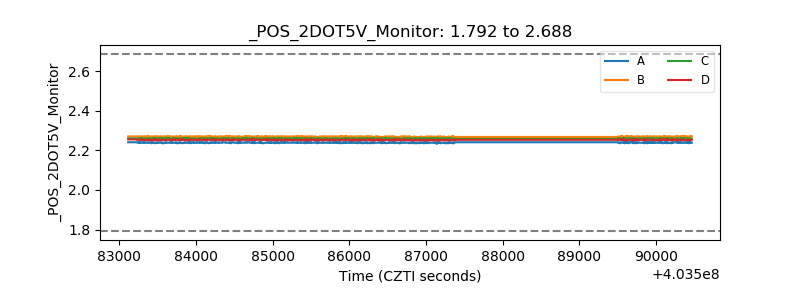 |
| +5 Volts monitor | 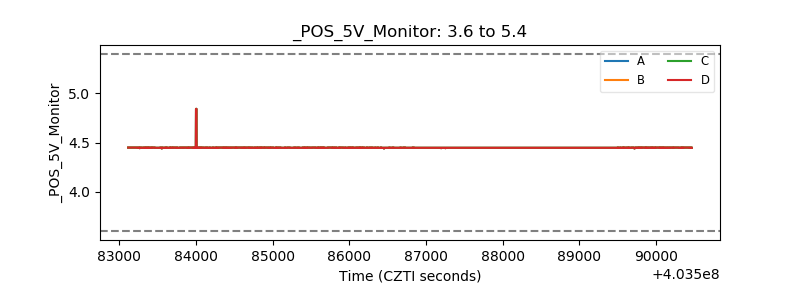 |
| _ROLL_ROT | 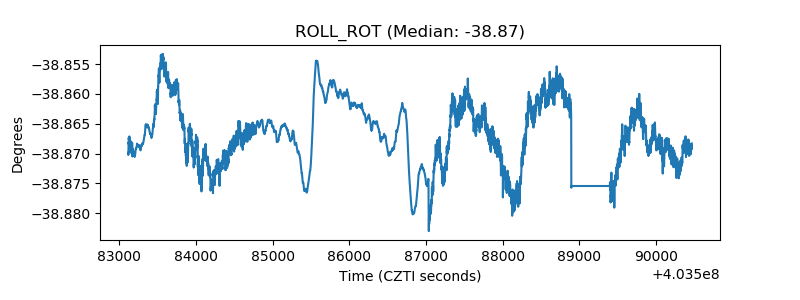 |
| _Roll_DEC | 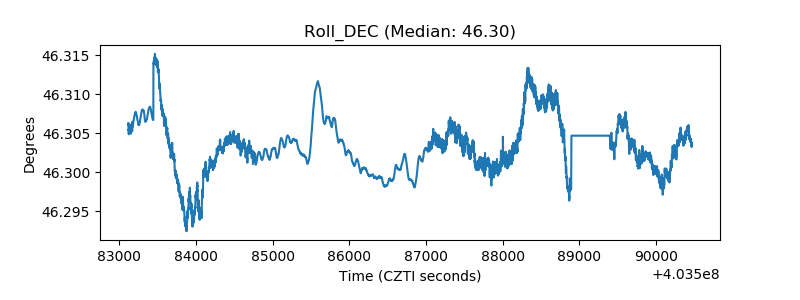 |
| _Roll_RA | 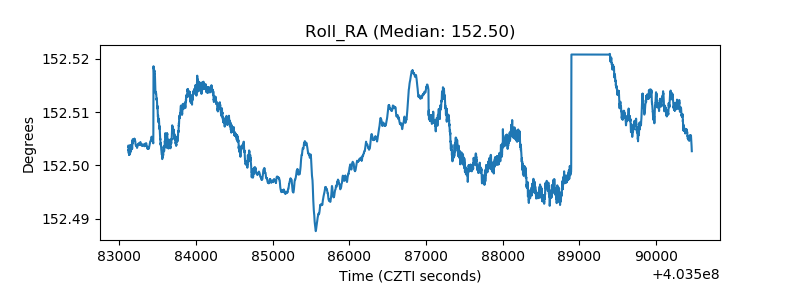 |
| Veto Counter | 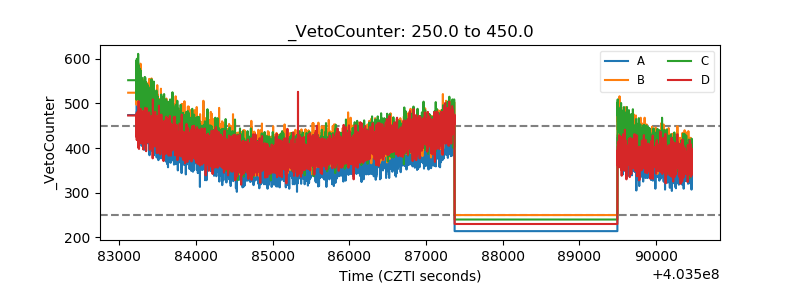 |