| Param | Original file | Final file |
|---|---|---|
| Filename | modeM0/AS1A11_065T21_9000005364_38117cztM0_level2.fits | modeM0/AS1A11_065T21_9000005364_38117cztM0_level2_quad_clean.evt |
| Size (bytes) | 366,209,280 | 89,349,120 |
| Size | 349.2 MB | 85.2 MB |
| Events in quadrant A | 2,729,533 | 610,797 |
| Events in quadrant B | 2,623,951 | 610,125 |
| Events in quadrant C | 2,491,633 | 594,238 |
| Events in quadrant D | 5,302,630 | 522,691 |
| Mode M9 | |||
|---|---|---|---|
| Quadrant | BADHDUFLAG | Total packets | Discarded packets |
| A | 0 | 19 | 0 |
| B | 0 | 19 | 0 |
| C | 0 | 19 | 0 |
| D | 0 | 20 | 0 |
| Mode M0 | |||
|---|---|---|---|
| Quadrant | BADHDUFLAG | Total packets | Discarded packets |
| A | 0 | 11350 | 3 |
| B | 0 | 11550 | 2 |
| C | 0 | 10680 | 2 |
| D | 0 | 19357 | 2 |
| Mode SS | |||
|---|---|---|---|
| Quadrant | BADHDUFLAG | Total packets | Discarded packets |
| A | 0 | 108 | 0 |
| B | 0 | 108 | 0 |
| C | 0 | 108 | 0 |
| D | 0 | 108 | 0 |
| Quadrant | Total seconds | Saturated seconds | Saturation percentage |
|---|---|---|---|
| A | 5245 | 5 | 0.095329% |
| B | 5245 | 111 | 2.116301% |
| C | 5245 | 4 | 0.076263% |
| D | 5245 | 381 | 7.264061% |
Noise dominated data is calculated using 1-second bins in cleaned event files. If a bin has >2000 counts, and if more than 50% of those come from <1% of pixels, then it is considered to be noise-dominated and hence unusable.
| Quadrant | # 1 sec bins | Bins with >0 counts | Bins with >2000 counts | High rate bins dominated by noise | Noise dominated (total time) | Noise dominated (detector-on time) | Marked lightcurve |
|---|---|---|---|---|---|---|---|
| A | 7188 | 5246 | 3 | 3 | 0.04% | 0.06% | 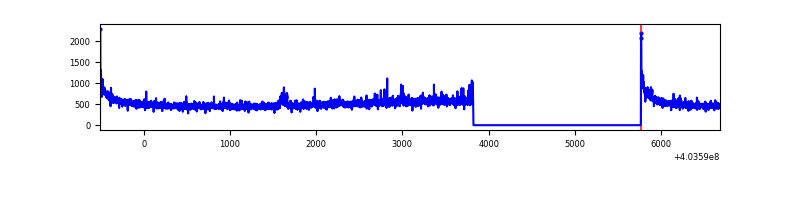 |
| B | 7188 | 5246 | 68 | 68 | 0.95% | 1.30% | 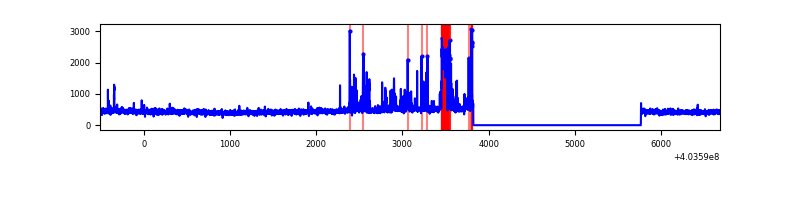 |
| C | 7188 | 5246 | 2 | 2 | 0.03% | 0.04% | 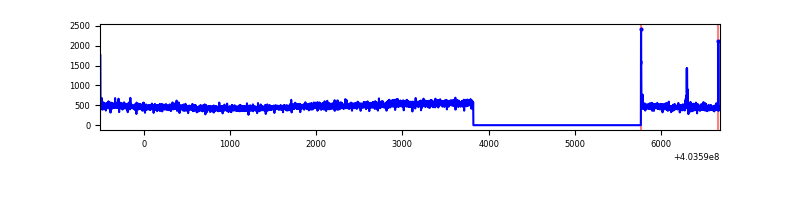 |
| D | 7188 | 5246 | 274 | 274 | 3.81% | 5.22% | 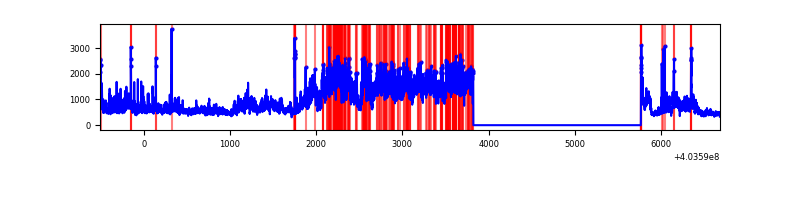 |
Top three noisy pixels from each quadrant. If the there are fewer than three noisy pixels in the level2.evt file, extra rows are filled as -1
| Pixel properties | Quadrant properties | ||||||
|---|---|---|---|---|---|---|---|
| Quadrant | DetID | PixID | Counts | Sigma | Mean | Median | Sigma |
| A | 10 | 83 | 363588 | 3104.68 | 586 | 576 | 116.9 |
| A | 12 | 189 | 33736 | 283.6 | 586 | 576 | 116.9 |
| A | 12 | 16 | 26750 | 223.85 | 586 | 576 | 116.9 |
| B | 0 | 229 | 353935 | 3209.56 | 574 | 560 | 110.1 |
| B | 12 | 111 | 13675 | 119.12 | 574 | 560 | 110.1 |
| B | 11 | 111 | 12251 | 106.18 | 574 | 560 | 110.1 |
| C | 15 | 214 | 220216 | 1681.12 | 565 | 570 | 130.7 |
| C | 3 | 233 | 34790 | 261.91 | 565 | 570 | 130.7 |
| C | 0 | 10 | 13253 | 97.07 | 565 | 570 | 130.7 |
| D | 12 | 235 | 2895499 | 21247.7 | 557 | 541 | 136.2 |
| D | 13 | 249 | 82007 | 597.92 | 557 | 541 | 136.2 |
| D | 1 | 52 | 66440 | 483.67 | 557 | 541 | 136.2 |
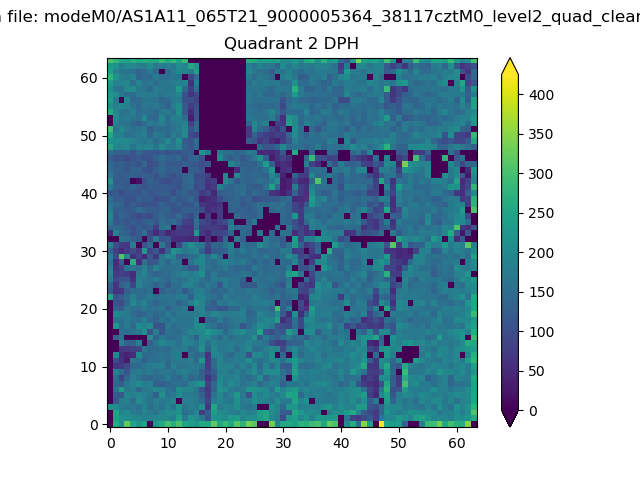
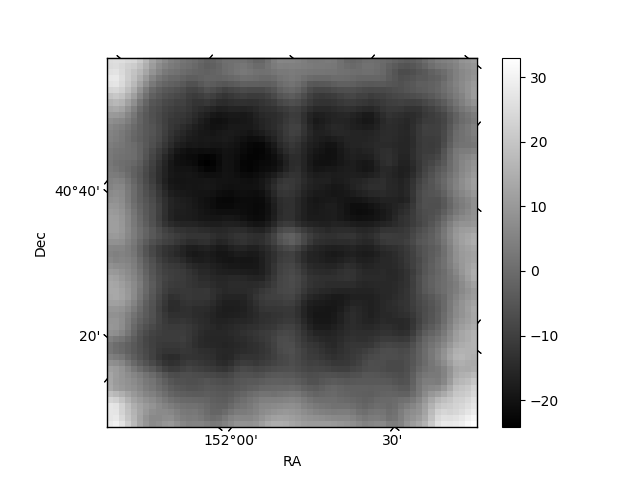
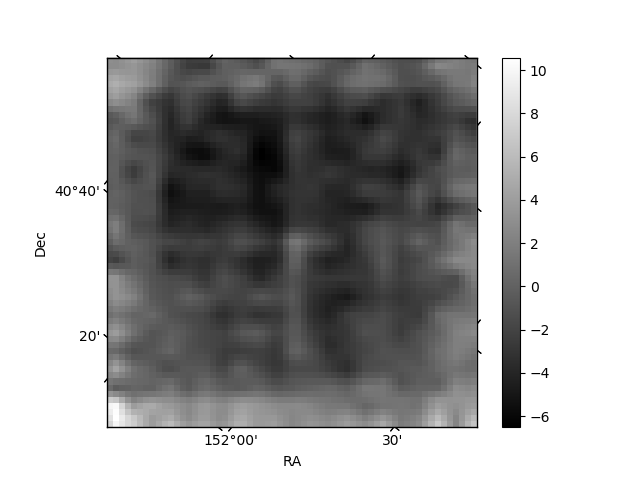
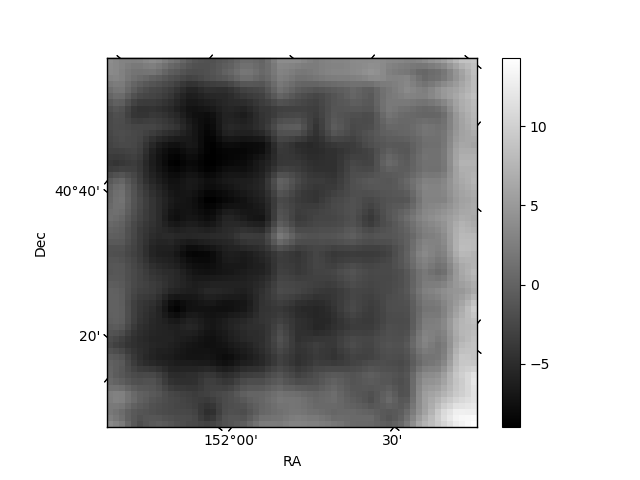
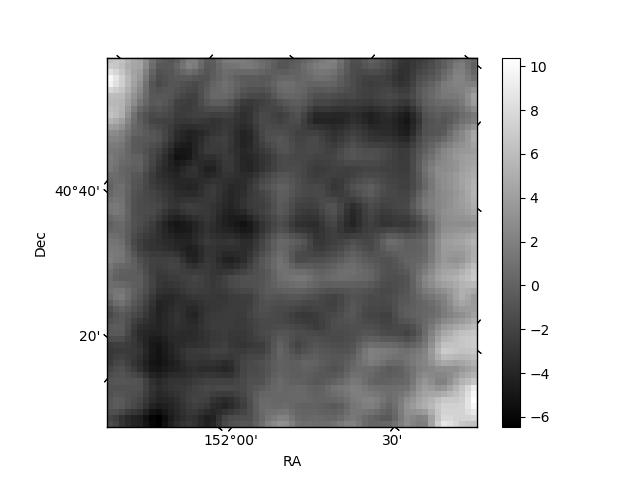
Histogram calculated using DETX and DETY for each event in the final _common_clean file
| Quadrant A | 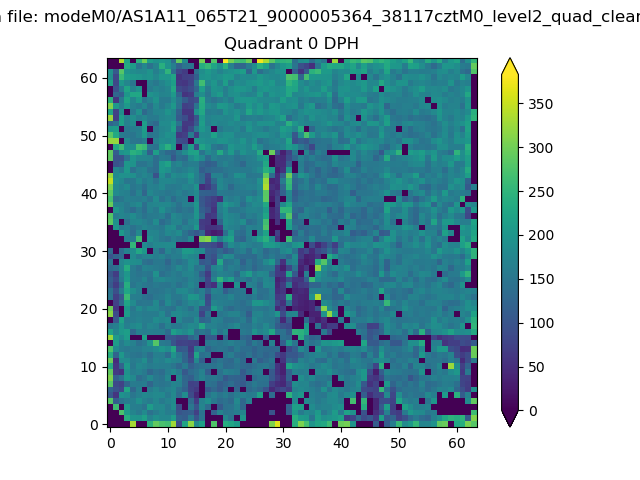 |
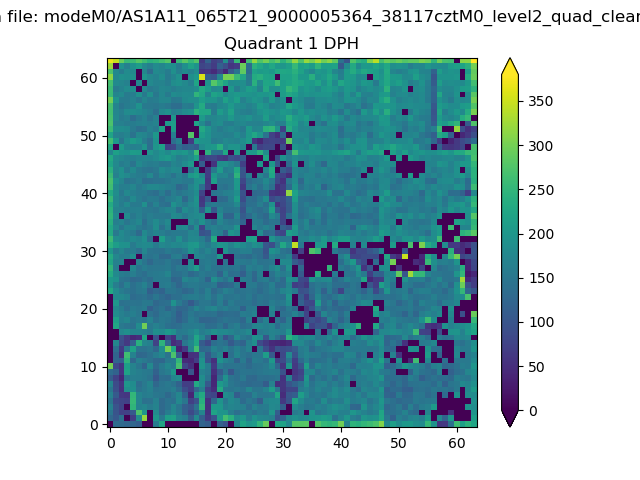 |
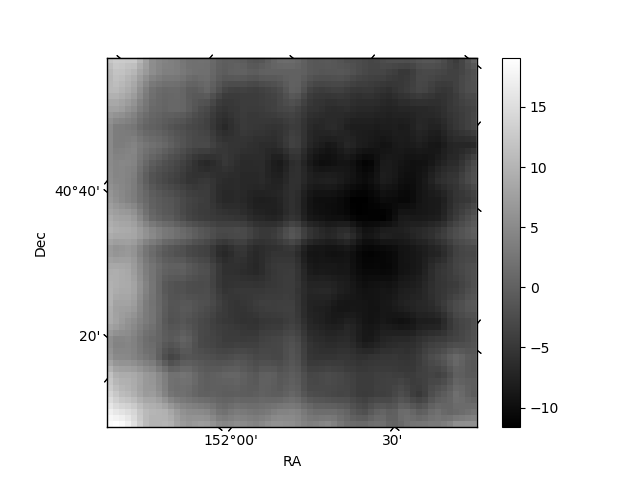
Quadrant B |
|---|---|---|---|
| Quadrant D | 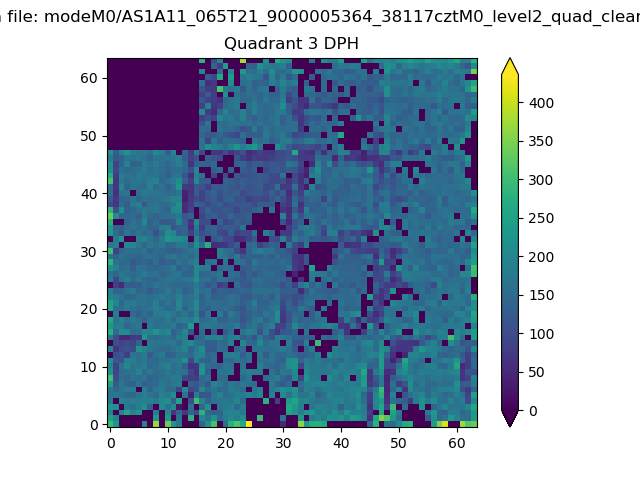 |
 |
Quadrant C |
| Plot type | Count rate plots | Images |
|---|---|---|
| Comparison with Poisson distribution Blue bars denote a histogram of data divided into 1 sec bins. Red curve is a Poisson curve with rate = median count rate of data. |
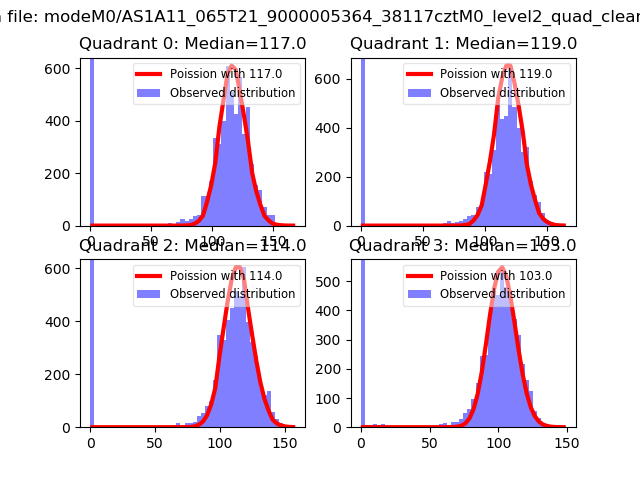 |
 |
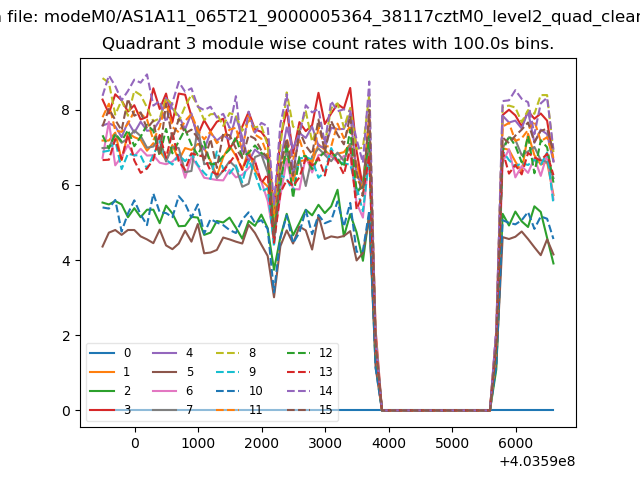
| Quadrant-wise count rates Data is divided into 100 sec bins |
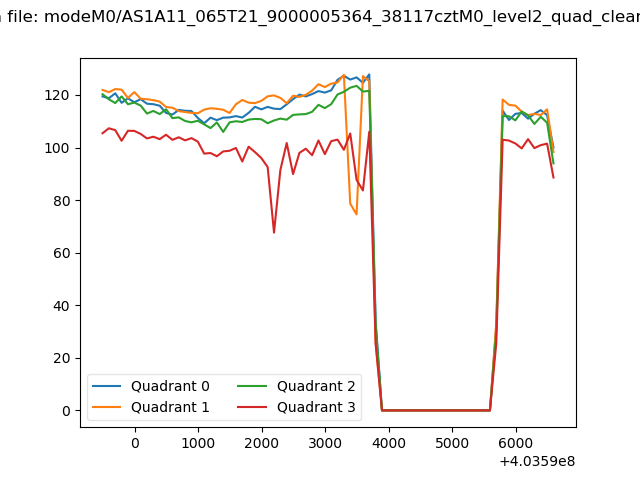 |
|
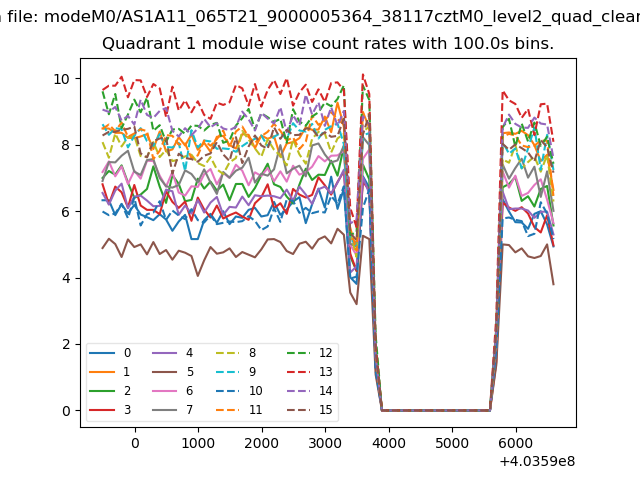
| Module-wise count rates for Quadrant A Data is divided into 100 sec bins |
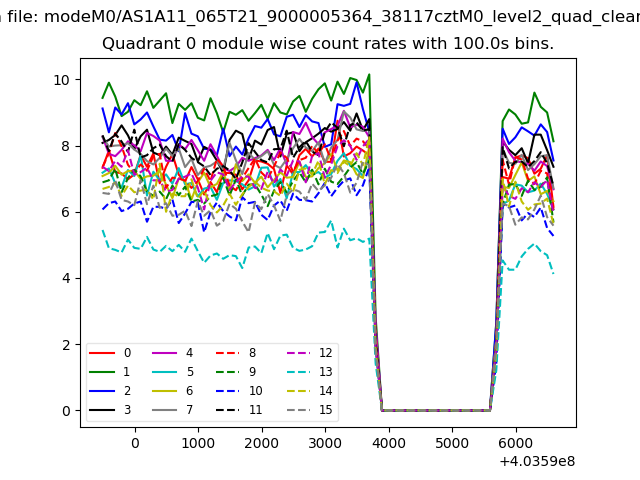 |
 |
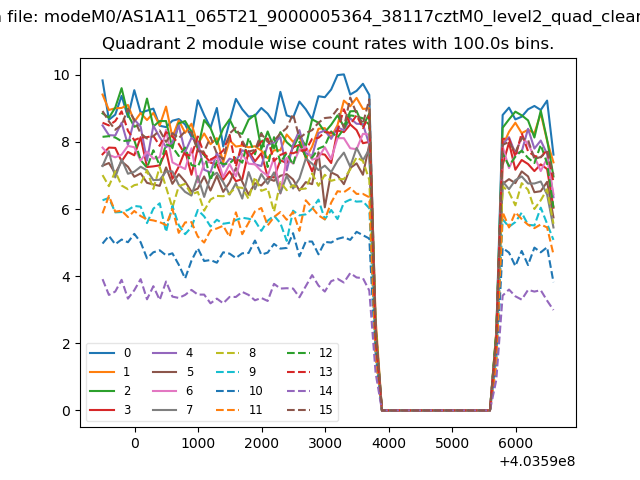
| Module-wise count rates for Quadrant B Data is divided into 100 sec bins |
 |
 |
| Module-wise count rates for Quadrant C Data is divided into 100 sec bins |
 |
 |
| Module-wise count rates for Quadrant D Data is divided into 100 sec bins |
 |
 |
| Parameter | Plot |
|---|---|
| CZT HV Monitor | 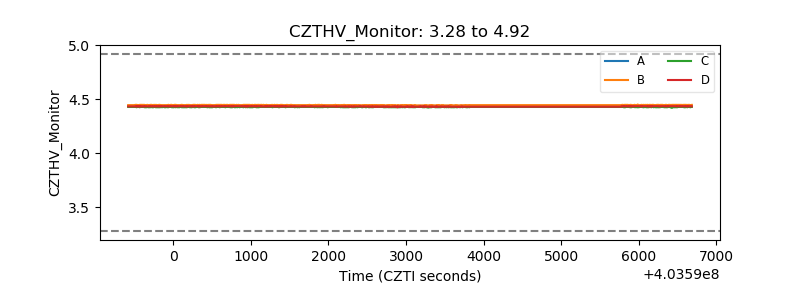 |
| D_VDD | 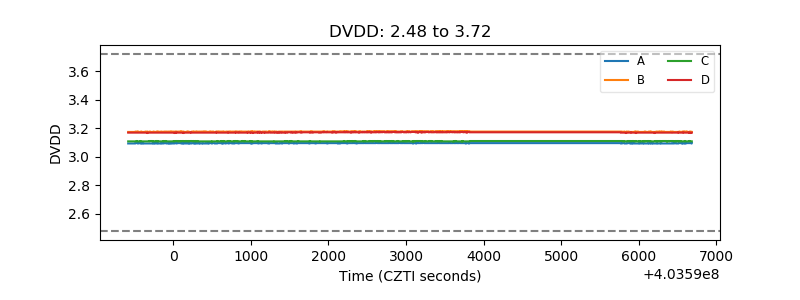 |
| Temperature 1 | 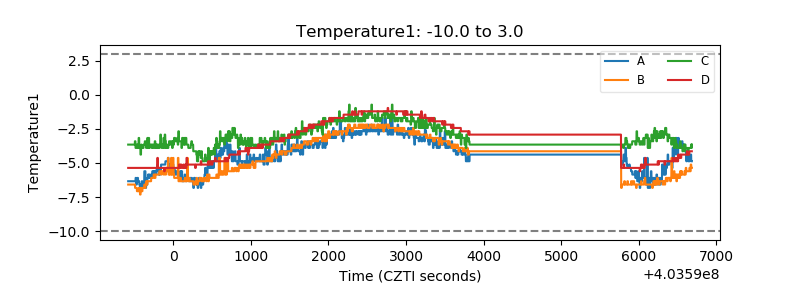 |
| Veto HV Monitor | 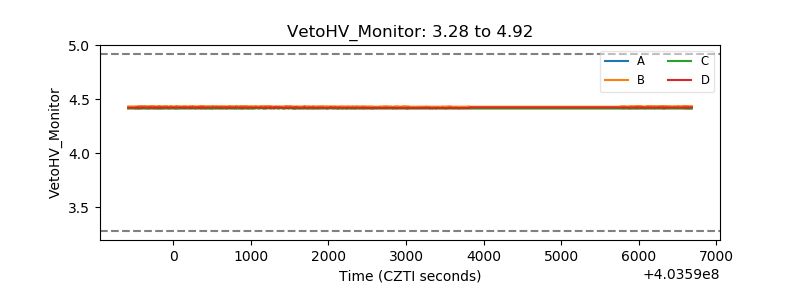 |
| Veto LLD | 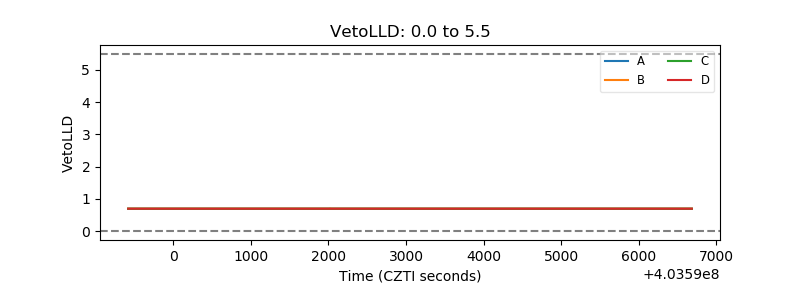 |
| Alpha Counter | 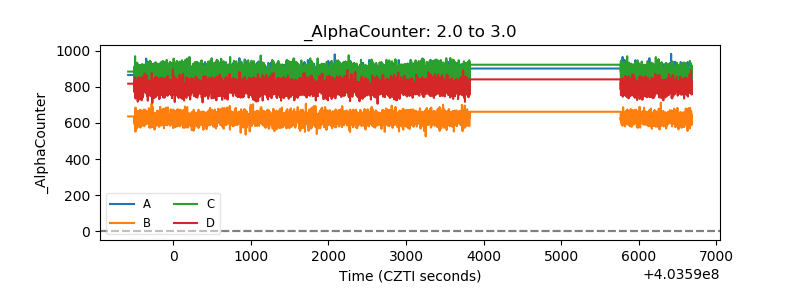 |
| _CPM_Rate | 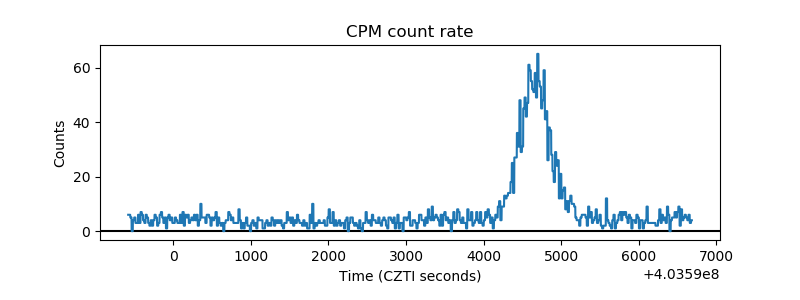 |
| CZT Counter | 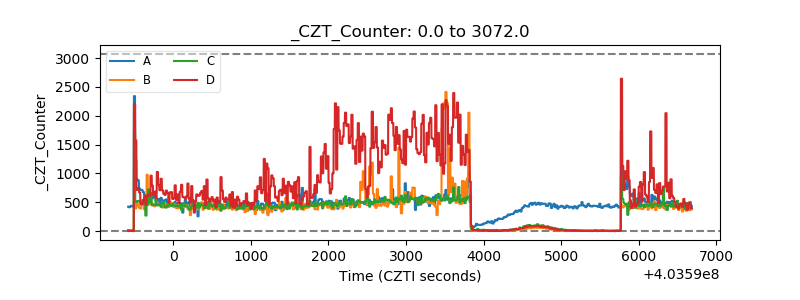 |
| +2.5 Volts monitor |  |
| +5 Volts monitor | 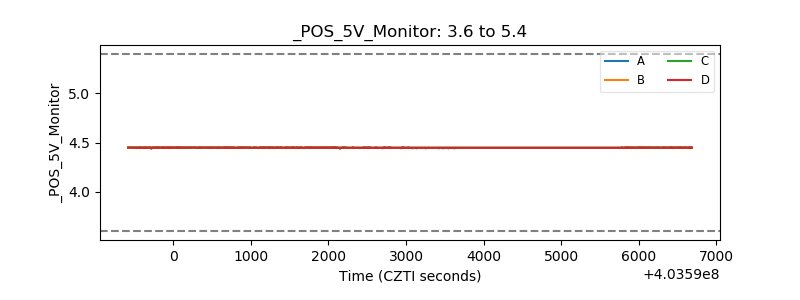 |
| _ROLL_ROT | 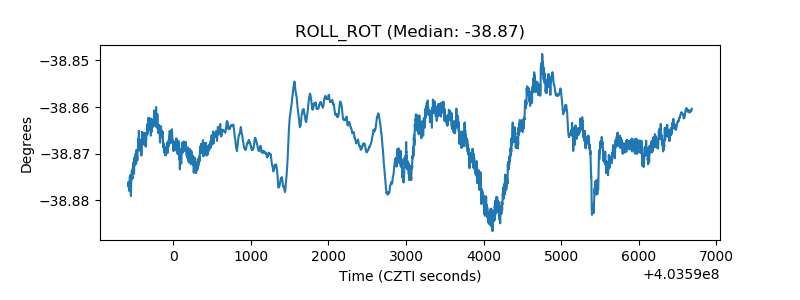 |
| _Roll_DEC | 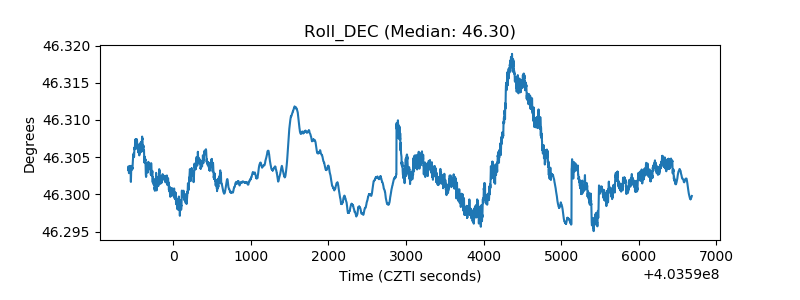 |
| _Roll_RA | 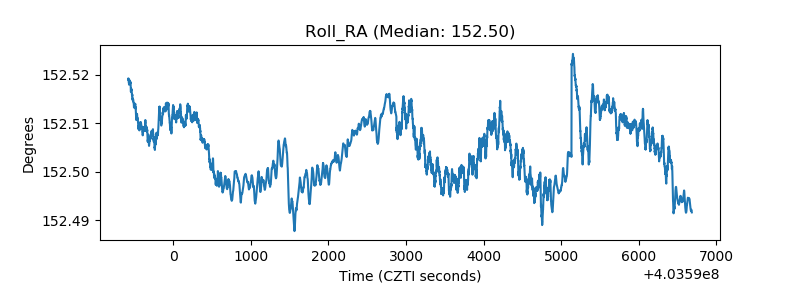 |
| Veto Counter | 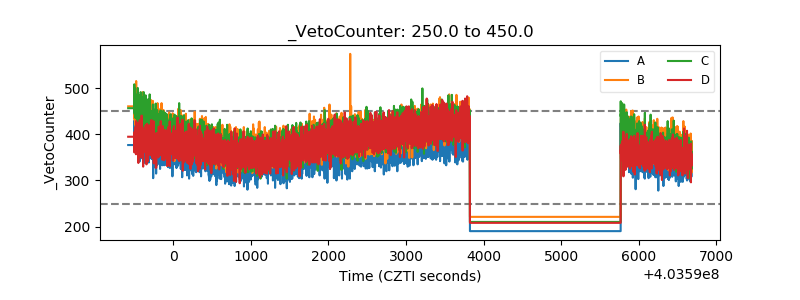 |