| Param | Original file | Final file |
|---|---|---|
| Filename | modeM0/AS1A11_065T21_9000005364_38118cztM0_level2.fits | modeM0/AS1A11_065T21_9000005364_38118cztM0_level2_quad_clean.evt |
| Size (bytes) | 369,178,560 | 94,273,920 |
| Size | 352.1 MB | 89.9 MB |
| Events in quadrant A | 3,200,461 | 639,062 |
| Events in quadrant B | 2,755,088 | 643,212 |
| Events in quadrant C | 2,708,680 | 617,835 |
| Events in quadrant D | 4,567,400 | 563,863 |
| Mode M9 | |||
|---|---|---|---|
| Quadrant | BADHDUFLAG | Total packets | Discarded packets |
| A | 0 | 18 | 0 |
| B | 0 | 18 | 0 |
| C | 0 | 18 | 0 |
| D | 0 | 19 | 0 |
| Mode M0 | |||
|---|---|---|---|
| Quadrant | BADHDUFLAG | Total packets | Discarded packets |
| A | 0 | 13019 | 3 |
| B | 0 | 12058 | 2 |
| C | 0 | 11534 | 2 |
| D | 0 | 17488 | 2 |
| Mode SS | |||
|---|---|---|---|
| Quadrant | BADHDUFLAG | Total packets | Discarded packets |
| A | 0 | 114 | 0 |
| B | 0 | 114 | 0 |
| C | 0 | 114 | 0 |
| D | 0 | 114 | 0 |
| Quadrant | Total seconds | Saturated seconds | Saturation percentage |
|---|---|---|---|
| A | 5584 | 12 | 0.214900% |
| B | 5584 | 68 | 1.217765% |
| C | 5584 | 26 | 0.465616% |
| D | 5584 | 117 | 2.095272% |
Noise dominated data is calculated using 1-second bins in cleaned event files. If a bin has >2000 counts, and if more than 50% of those come from <1% of pixels, then it is considered to be noise-dominated and hence unusable.
| Quadrant | # 1 sec bins | Bins with >0 counts | Bins with >2000 counts | High rate bins dominated by noise | Noise dominated (total time) | Noise dominated (detector-on time) | Marked lightcurve |
|---|---|---|---|---|---|---|---|
| A | 7196 | 5585 | 4 | 4 | 0.06% | 0.07% | 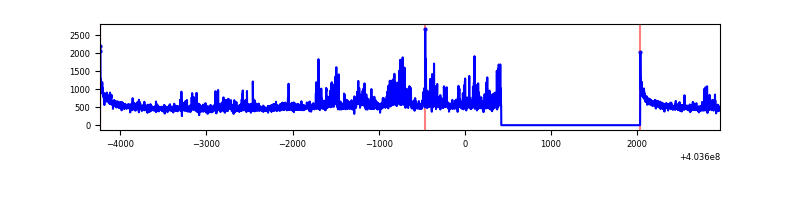 |
| B | 7196 | 5585 | 50 | 50 | 0.69% | 0.90% | 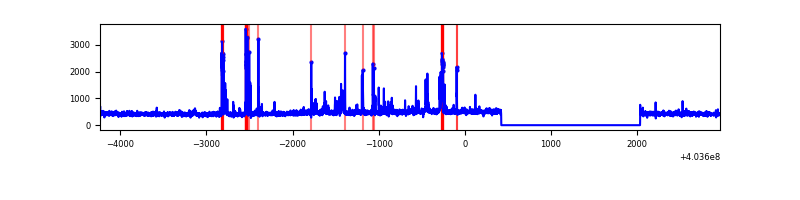 |
| C | 7196 | 5585 | 19 | 19 | 0.26% | 0.34% | 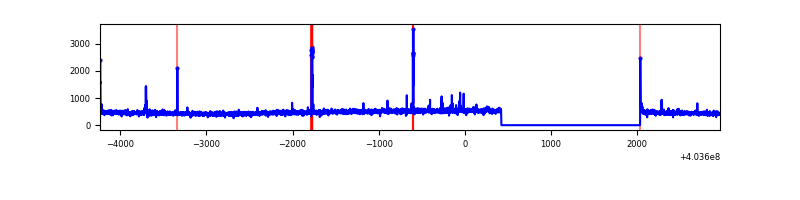 |
| D | 7196 | 5585 | 109 | 109 | 1.51% | 1.95% | 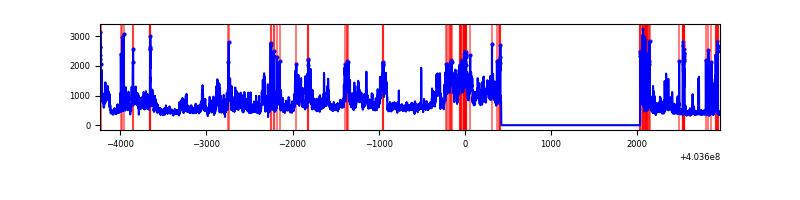 |
Top three noisy pixels from each quadrant. If the there are fewer than three noisy pixels in the level2.evt file, extra rows are filled as -1
| Pixel properties | Quadrant properties | ||||||
|---|---|---|---|---|---|---|---|
| Quadrant | DetID | PixID | Counts | Sigma | Mean | Median | Sigma |
| A | 10 | 83 | 376115 | 2984.15 | 622 | 610 | 125.8 |
| A | 12 | 16 | 301652 | 2392.39 | 622 | 610 | 125.8 |
| A | 12 | 194 | 51324 | 403.03 | 622 | 610 | 125.8 |
| B | 0 | 229 | 214541 | 1802.31 | 612 | 594 | 118.7 |
| B | 5 | 172 | 130364 | 1093.19 | 612 | 594 | 118.7 |
| B | 12 | 111 | 14843 | 120.03 | 612 | 594 | 118.7 |
| C | 15 | 214 | 233391 | 1665.59 | 602 | 606 | 139.8 |
| C | 1 | 23 | 60199 | 426.39 | 602 | 606 | 139.8 |
| C | 3 | 233 | 27181 | 190.15 | 602 | 606 | 139.8 |
| D | 12 | 235 | 1826388 | 12492.61 | 599 | 584 | 146.2 |
| D | 13 | 249 | 255580 | 1744.75 | 599 | 584 | 146.2 |
| D | 1 | 52 | 47666 | 322.15 | 599 | 584 | 146.2 |
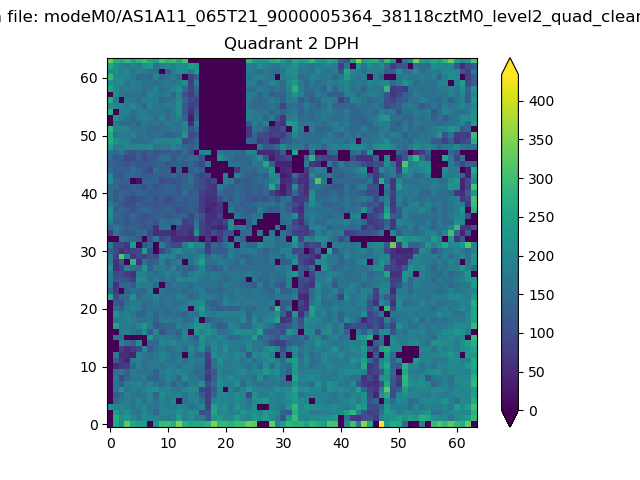
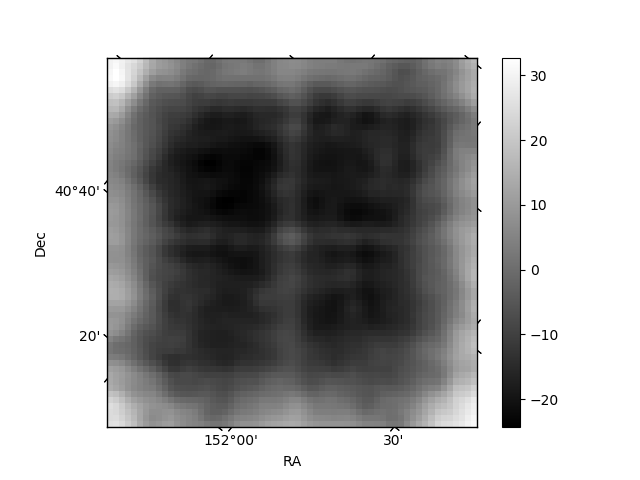
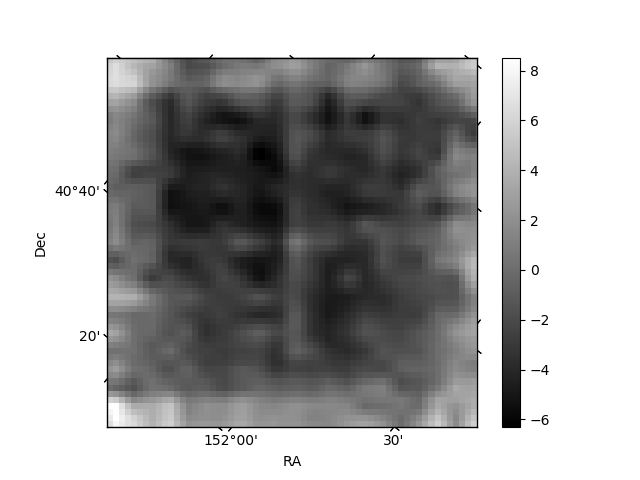
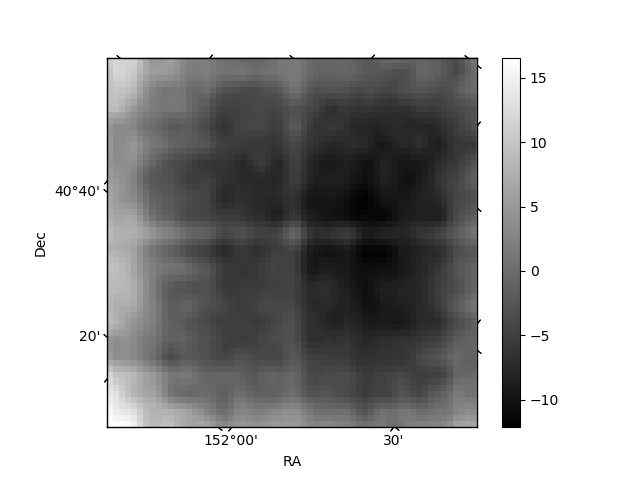
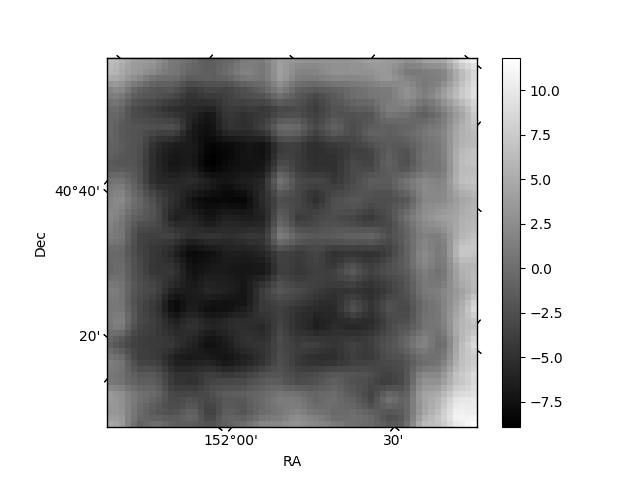
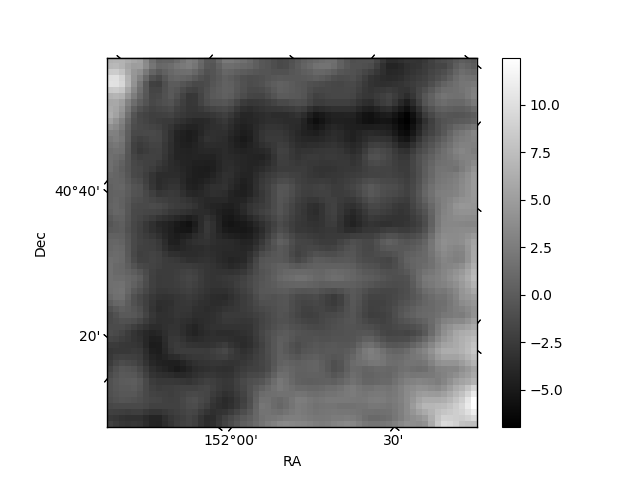
Histogram calculated using DETX and DETY for each event in the final _common_clean file
| Quadrant A | 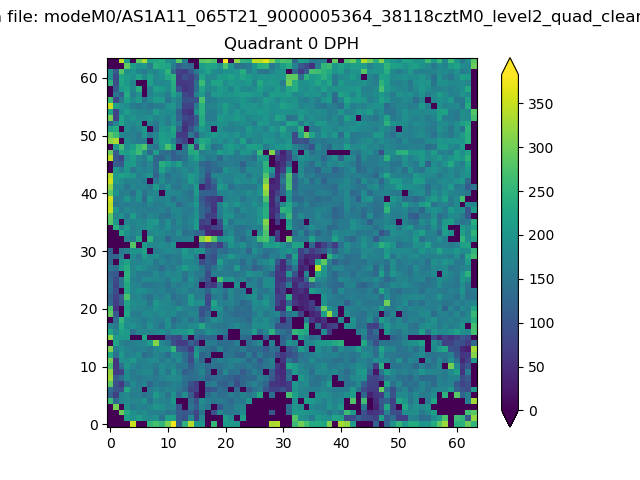 |
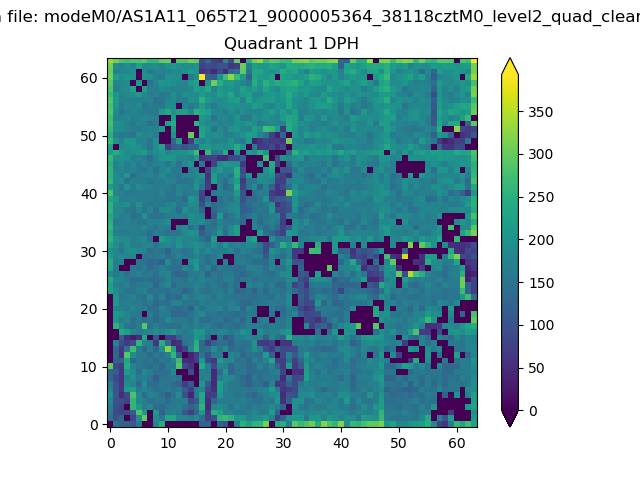 |
Quadrant B |
|---|---|---|---|
| Quadrant D | 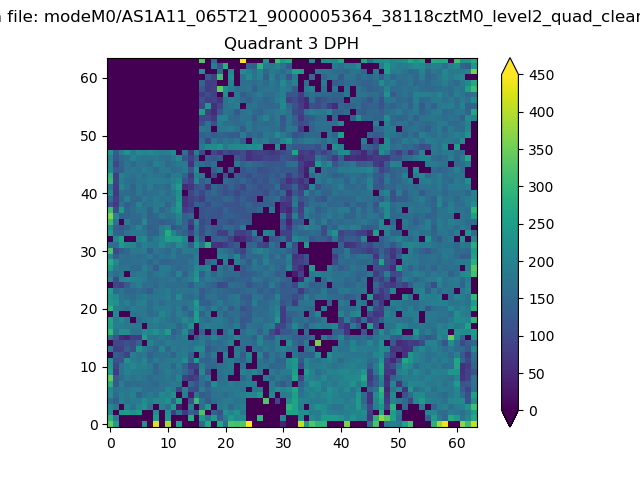 |
 |
Quadrant C |
| Plot type | Count rate plots | Images |
|---|---|---|
| Comparison with Poisson distribution Blue bars denote a histogram of data divided into 1 sec bins. Red curve is a Poisson curve with rate = median count rate of data. |
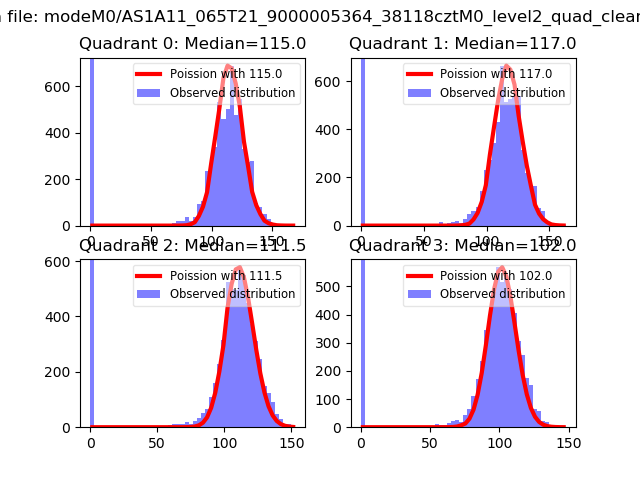 |
 |
| Quadrant-wise count rates Data is divided into 100 sec bins |
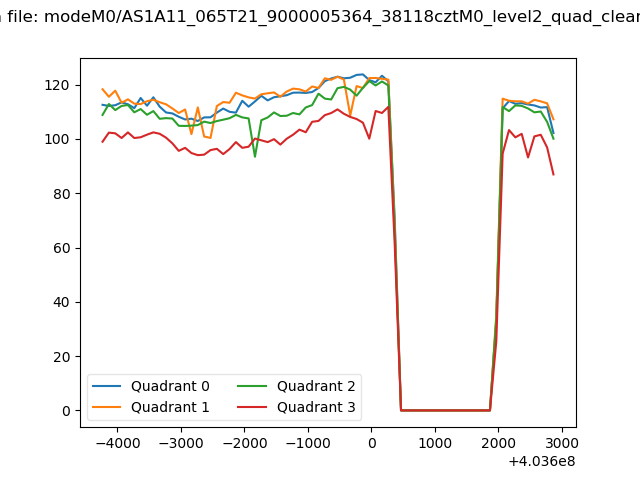 |
|
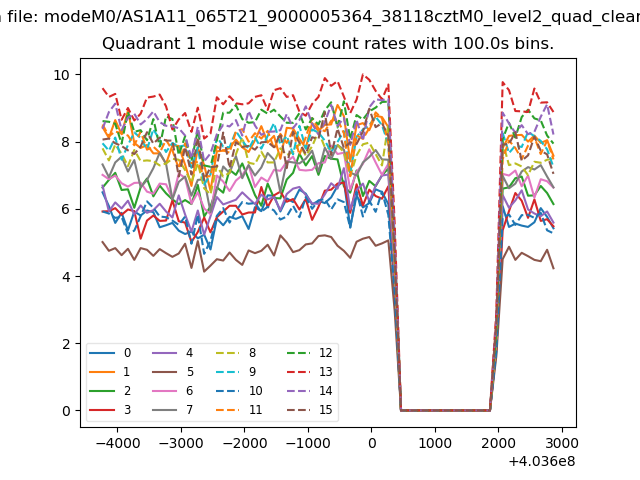
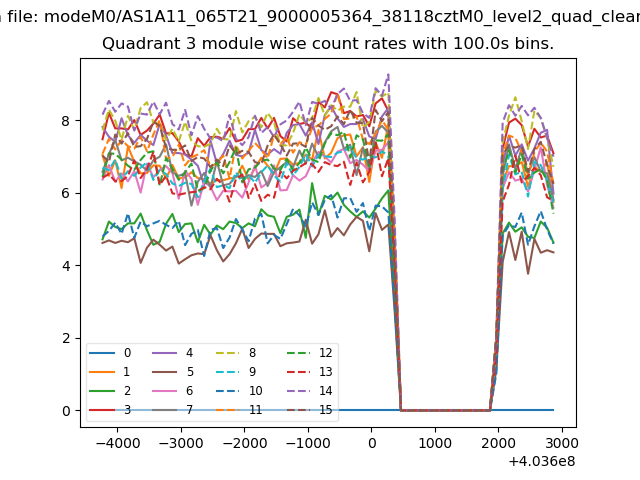
| Module-wise count rates for Quadrant A Data is divided into 100 sec bins |
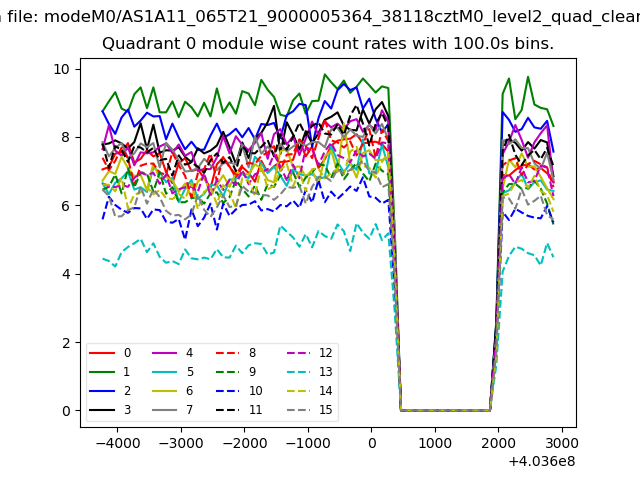 |
 |
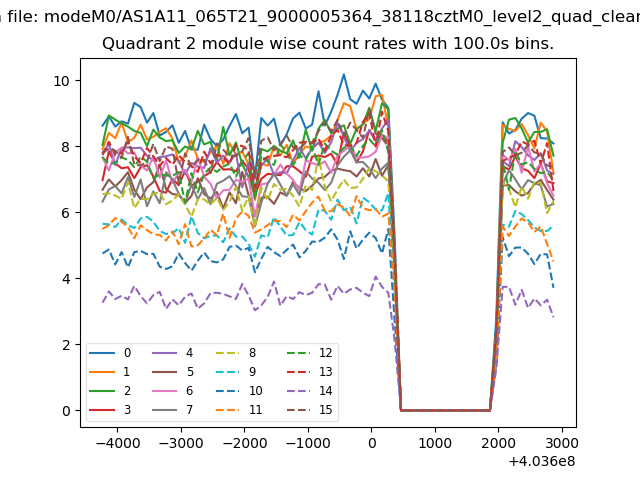
| Module-wise count rates for Quadrant B Data is divided into 100 sec bins |
 |
 |
| Module-wise count rates for Quadrant C Data is divided into 100 sec bins |
 |
 |
| Module-wise count rates for Quadrant D Data is divided into 100 sec bins |
 |
 |
| Parameter | Plot |
|---|---|
| CZT HV Monitor | 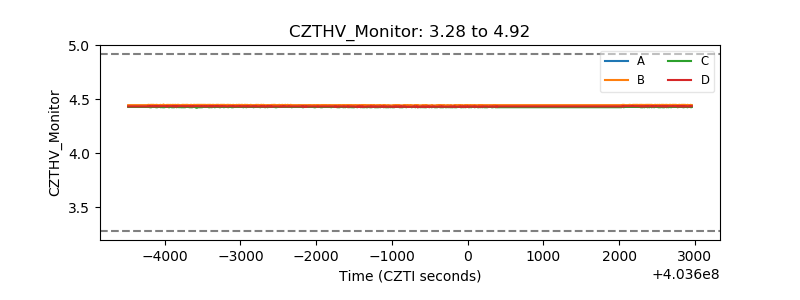 |
| D_VDD | 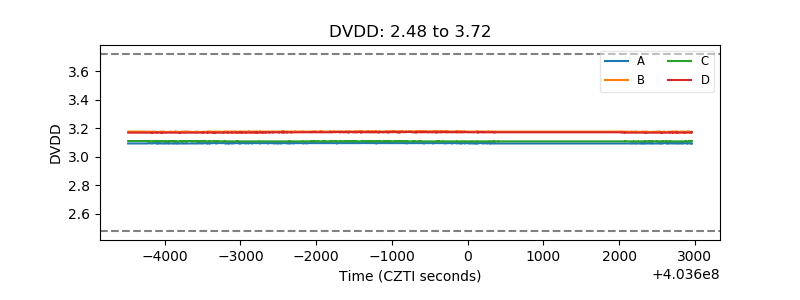 |
| Temperature 1 | 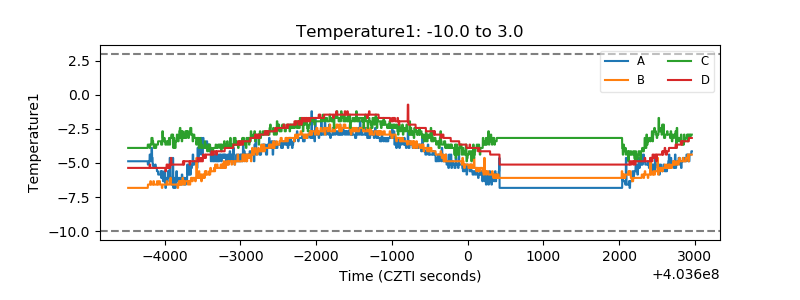 |
| Veto HV Monitor | 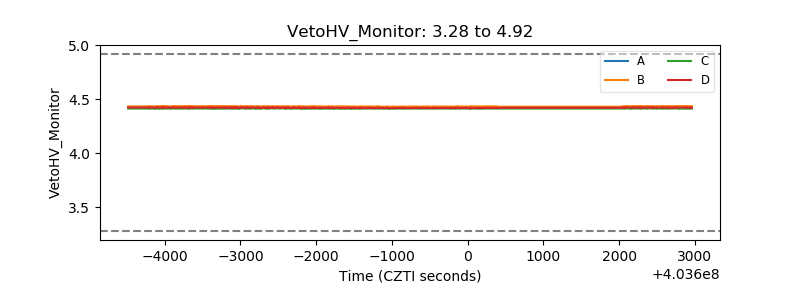 |
| Veto LLD | 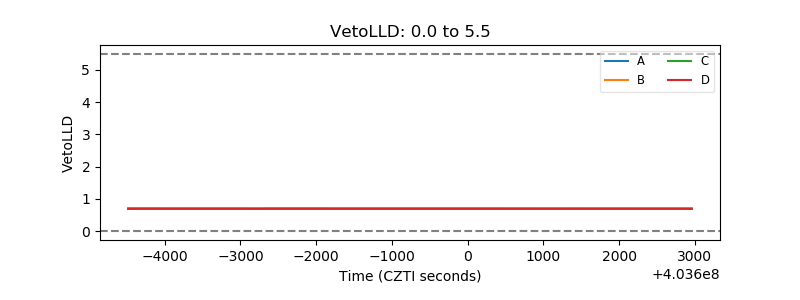 |
| Alpha Counter | 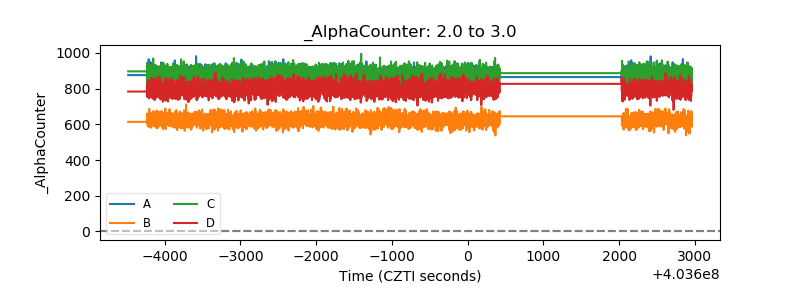 |
| _CPM_Rate | 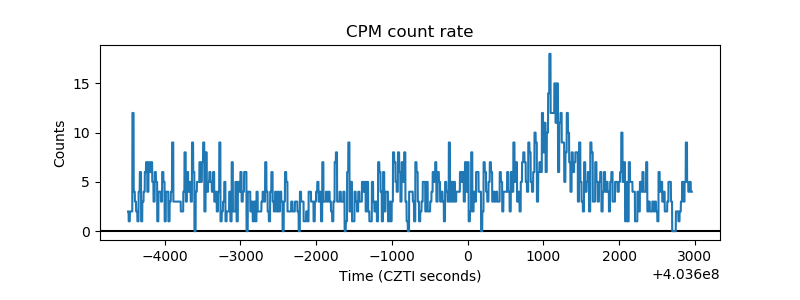 |
| CZT Counter | 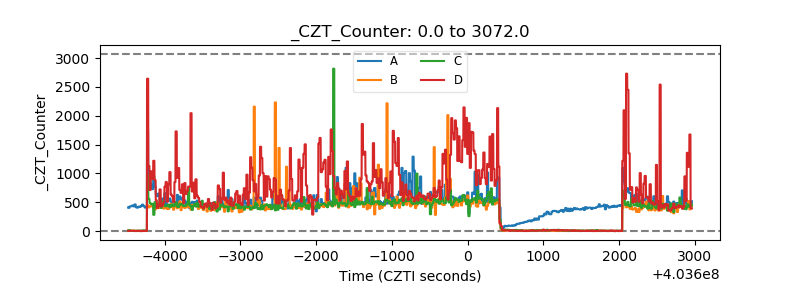 |
| +2.5 Volts monitor | 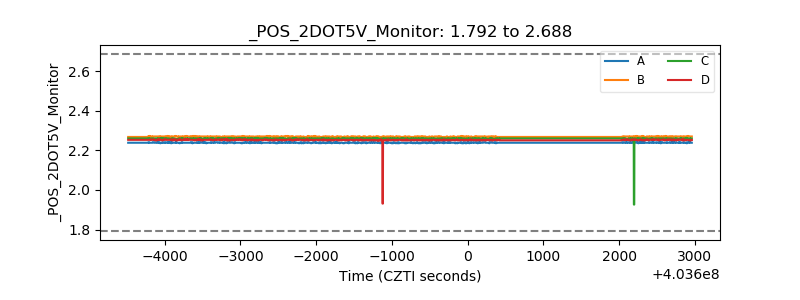 |
| +5 Volts monitor | 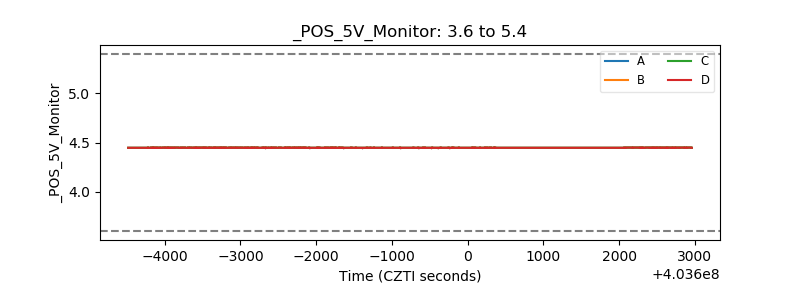 |
| _ROLL_ROT | 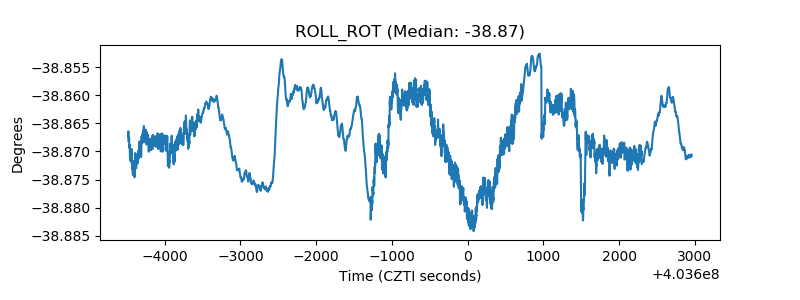 |
| _Roll_DEC | 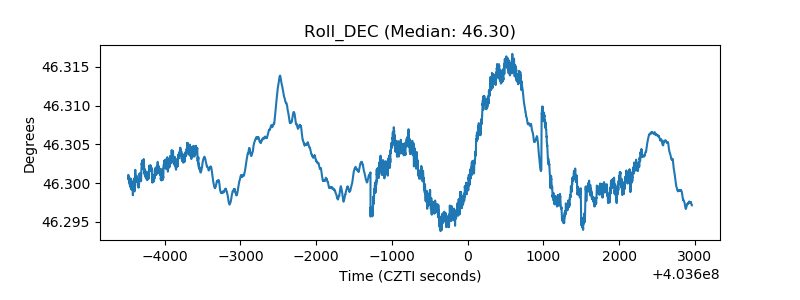 |
| _Roll_RA | 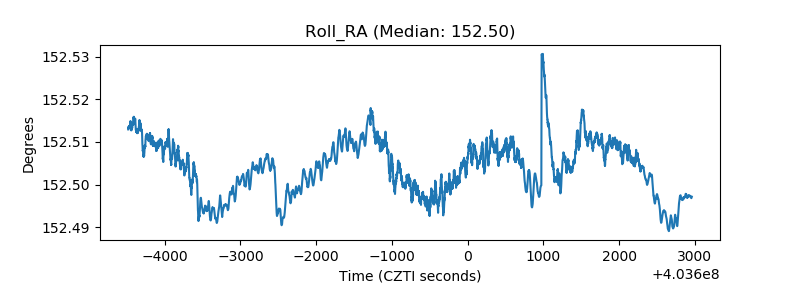 |
| Veto Counter | 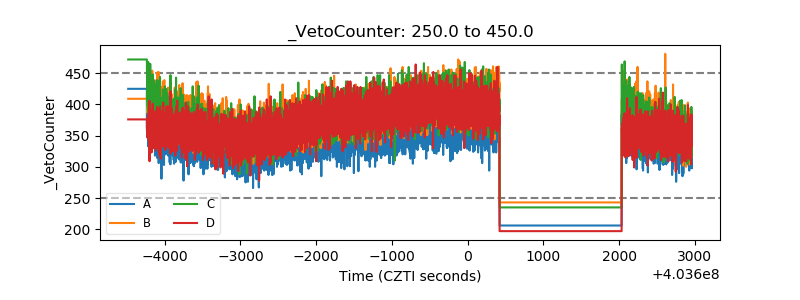 |