| Param | Original file | Final file |
|---|---|---|
| Filename | modeM0/AS1A11_065T21_9000005364_38119cztM0_level2.fits | modeM0/AS1A11_065T21_9000005364_38119cztM0_level2_quad_clean.evt |
| Size (bytes) | 351,567,360 | 96,874,560 |
| Size | 335.3 MB | 92.4 MB |
| Events in quadrant A | 3,362,192 | 651,596 |
| Events in quadrant B | 2,792,409 | 666,236 |
| Events in quadrant C | 2,974,950 | 630,246 |
| Events in quadrant D | 3,433,584 | 580,445 |
| Mode M9 | |||
|---|---|---|---|
| Quadrant | BADHDUFLAG | Total packets | Discarded packets |
| A | 0 | 18 | 0 |
| B | 0 | 18 | 0 |
| C | 0 | 18 | 0 |
| D | 0 | 19 | 0 |
| Mode M0 | |||
|---|---|---|---|
| Quadrant | BADHDUFLAG | Total packets | Discarded packets |
| A | 0 | 13518 | 3 |
| B | 0 | 12285 | 2 |
| C | 0 | 12361 | 2 |
| D | 0 | 13911 | 2 |
| Mode SS | |||
|---|---|---|---|
| Quadrant | BADHDUFLAG | Total packets | Discarded packets |
| A | 0 | 118 | 0 |
| B | 0 | 118 | 0 |
| C | 0 | 118 | 0 |
| D | 0 | 118 | 0 |
| Quadrant | Total seconds | Saturated seconds | Saturation percentage |
|---|---|---|---|
| A | 5790 | 25 | 0.431779% |
| B | 5790 | 30 | 0.518135% |
| C | 5790 | 56 | 0.967185% |
| D | 5790 | 90 | 1.554404% |
Noise dominated data is calculated using 1-second bins in cleaned event files. If a bin has >2000 counts, and if more than 50% of those come from <1% of pixels, then it is considered to be noise-dominated and hence unusable.
| Quadrant | # 1 sec bins | Bins with >0 counts | Bins with >2000 counts | High rate bins dominated by noise | Noise dominated (total time) | Noise dominated (detector-on time) | Marked lightcurve |
|---|---|---|---|---|---|---|---|
| A | 7163 | 5791 | 12 | 12 | 0.17% | 0.21% | 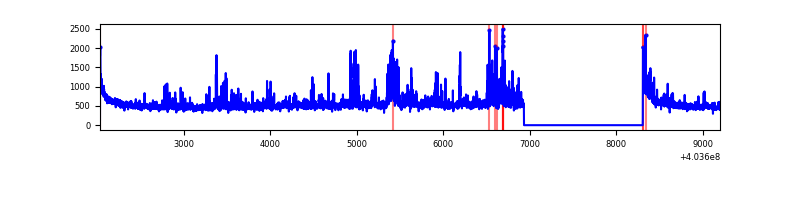 |
| B | 7163 | 5791 | 9 | 9 | 0.13% | 0.16% | 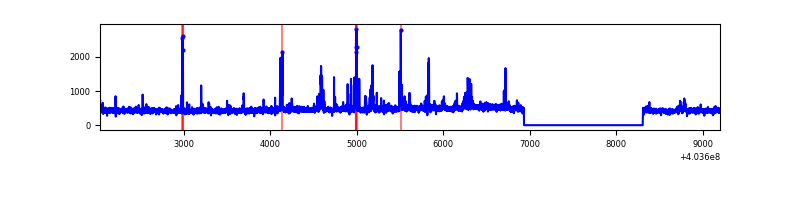 |
| C | 7163 | 5791 | 50 | 50 | 0.70% | 0.86% | 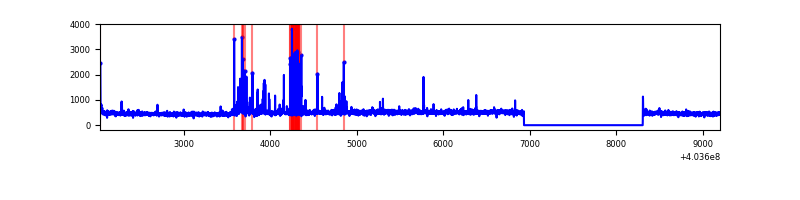 |
| D | 7163 | 5791 | 86 | 86 | 1.20% | 1.49% | 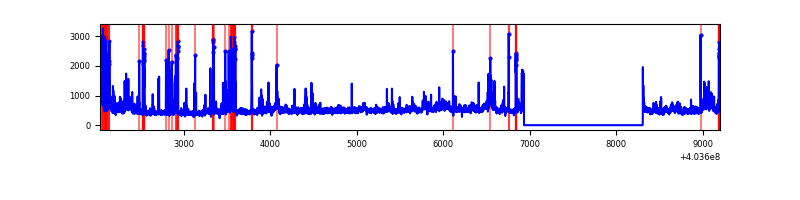 |
Top three noisy pixels from each quadrant. If the there are fewer than three noisy pixels in the level2.evt file, extra rows are filled as -1
| Pixel properties | Quadrant properties | ||||||
|---|---|---|---|---|---|---|---|
| Quadrant | DetID | PixID | Counts | Sigma | Mean | Median | Sigma |
| A | 10 | 83 | 377862 | 2887.5 | 646 | 635 | 130.6 |
| A | 12 | 16 | 353289 | 2699.41 | 646 | 635 | 130.6 |
| A | 12 | 194 | 58578 | 443.53 | 646 | 635 | 130.6 |
| B | 0 | 229 | 193728 | 1542.36 | 643 | 624 | 125.2 |
| B | 5 | 172 | 40206 | 316.15 | 643 | 624 | 125.2 |
| B | 15 | 85 | 17651 | 136.0 | 643 | 624 | 125.2 |
| C | 15 | 214 | 240927 | 1648.16 | 627 | 630 | 145.8 |
| C | 0 | 239 | 228638 | 1563.87 | 627 | 630 | 145.8 |
| C | 3 | 233 | 31920 | 214.61 | 627 | 630 | 145.8 |
| D | 12 | 235 | 388639 | 2514.02 | 628 | 609 | 154.3 |
| D | 13 | 249 | 324839 | 2100.66 | 628 | 609 | 154.3 |
| D | 1 | 20 | 99839 | 642.9 | 628 | 609 | 154.3 |
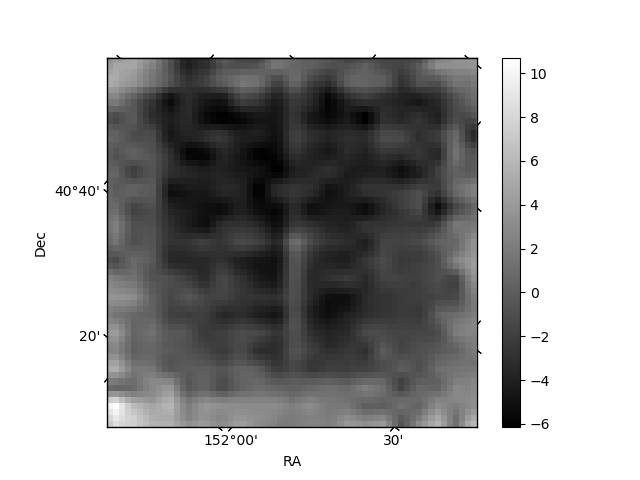
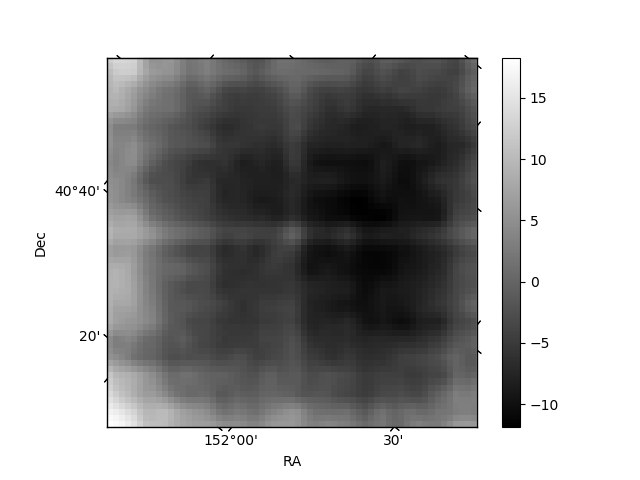
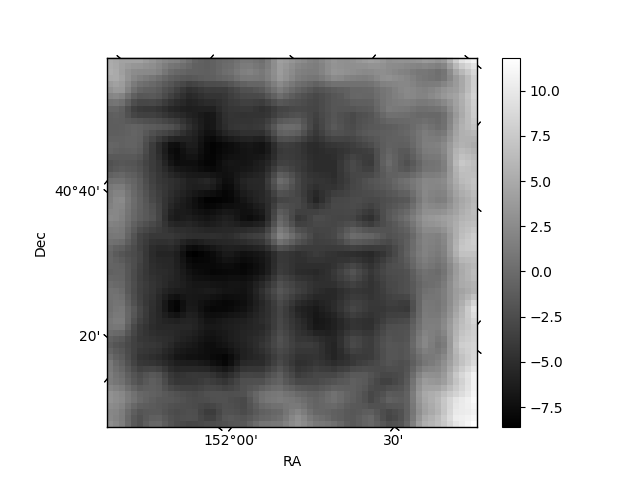
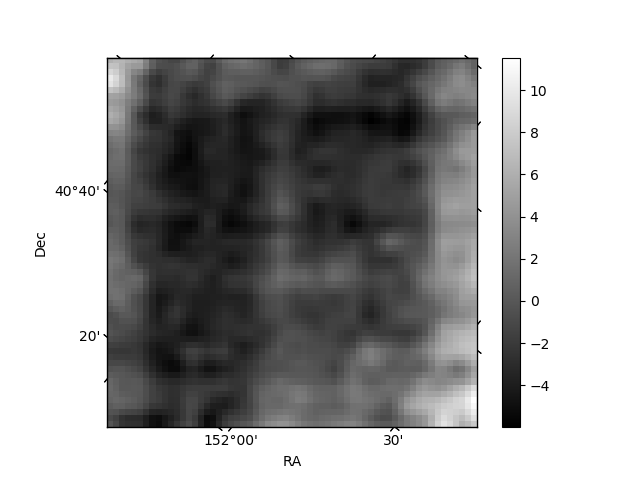
Histogram calculated using DETX and DETY for each event in the final _common_clean file
| Quadrant A | 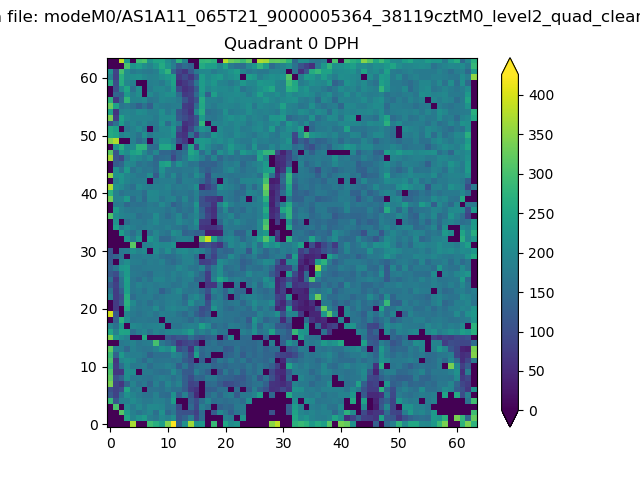 |
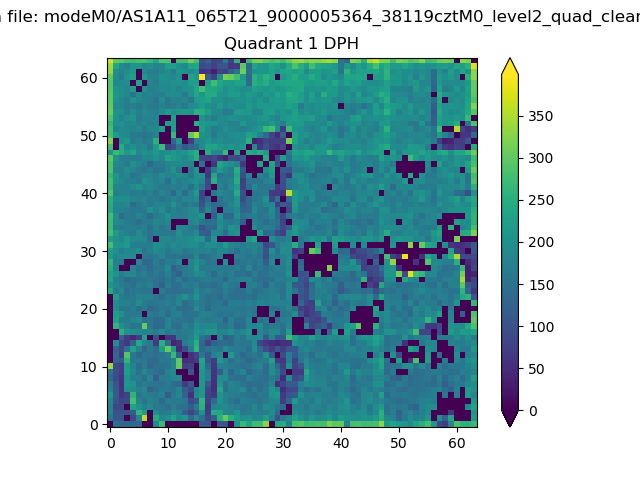 |
Quadrant B |
|---|---|---|---|
| Quadrant D | 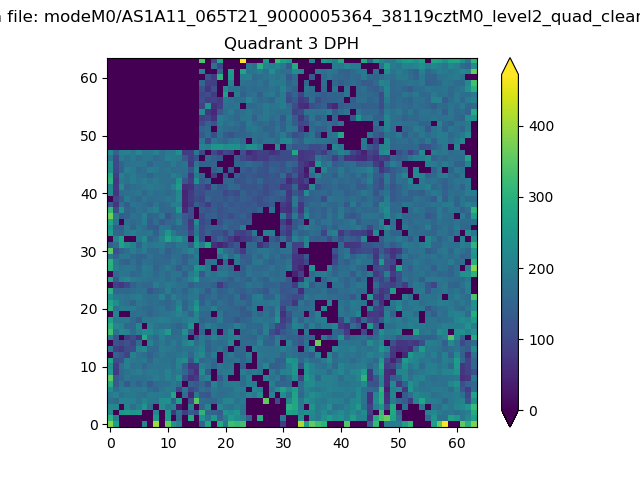 |
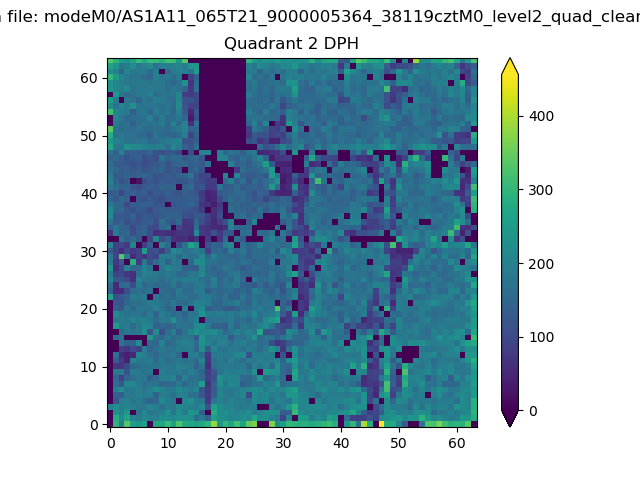 |
Quadrant C |
| Plot type | Count rate plots | Images |
|---|---|---|
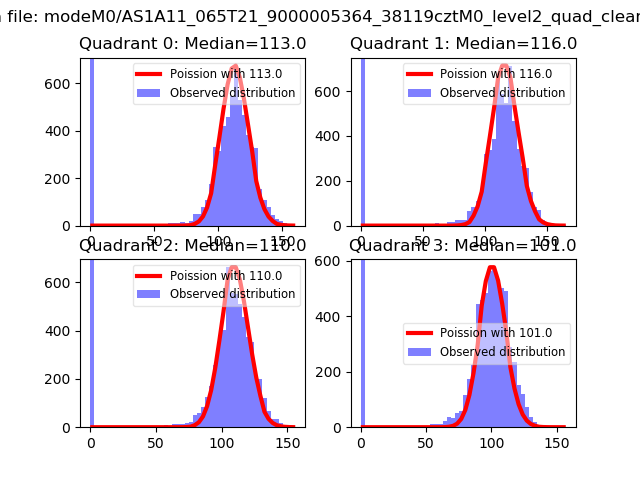
| Comparison with Poisson distribution Blue bars denote a histogram of data divided into 1 sec bins. Red curve is a Poisson curve with rate = median count rate of data. |
 |
 |
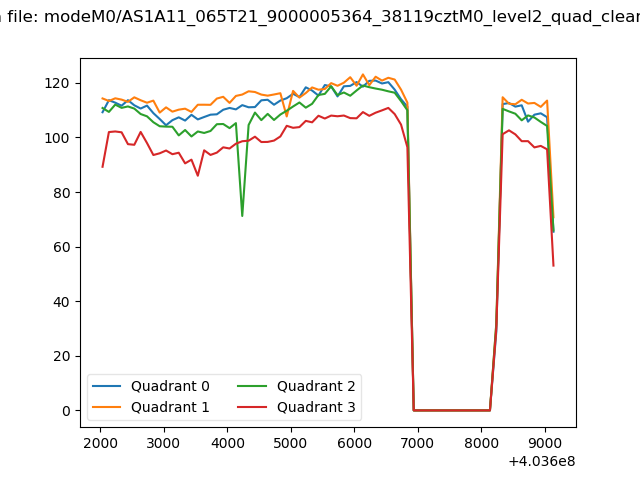
| Quadrant-wise count rates Data is divided into 100 sec bins |
 |
|
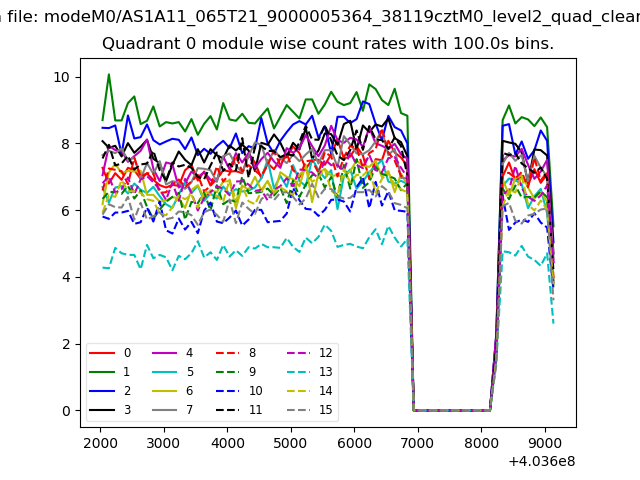
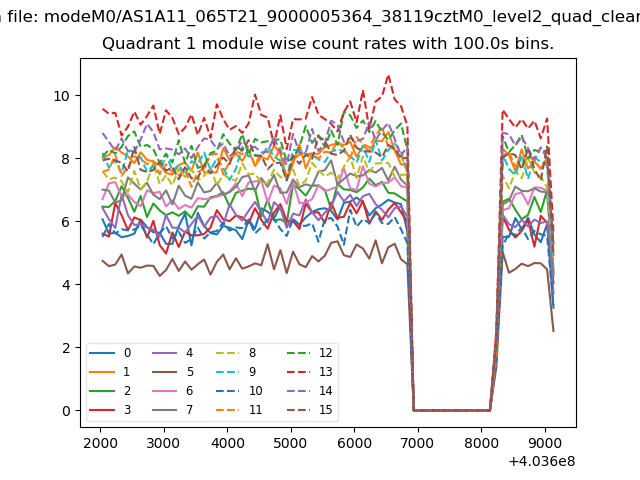
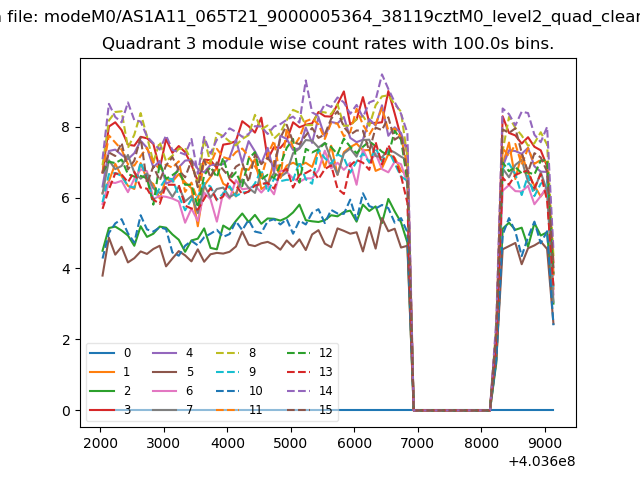
| Module-wise count rates for Quadrant A Data is divided into 100 sec bins |
 |
 |
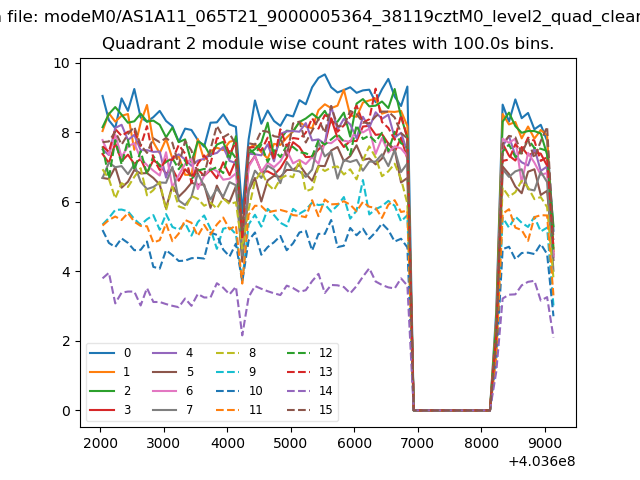
| Module-wise count rates for Quadrant B Data is divided into 100 sec bins |
 |
 |
| Module-wise count rates for Quadrant C Data is divided into 100 sec bins |
 |
 |
| Module-wise count rates for Quadrant D Data is divided into 100 sec bins |
 |
 |
| Parameter | Plot |
|---|---|
| CZT HV Monitor | 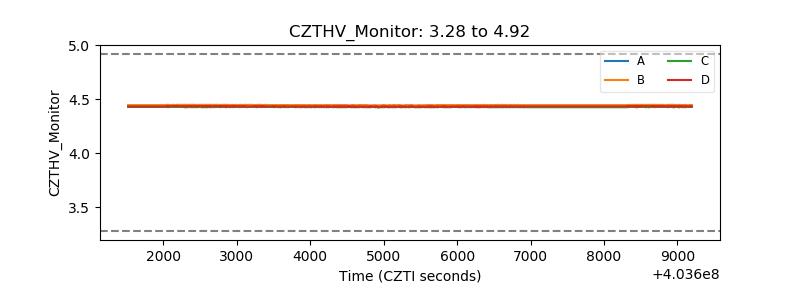 |
| D_VDD | 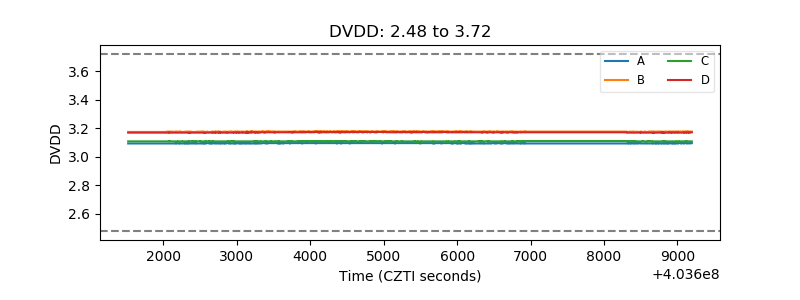 |
| Temperature 1 | 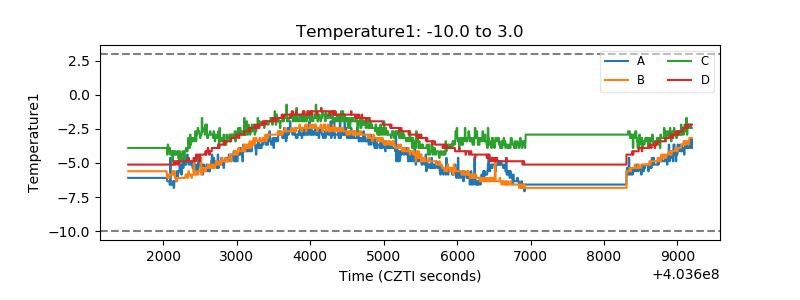 |
| Veto HV Monitor | 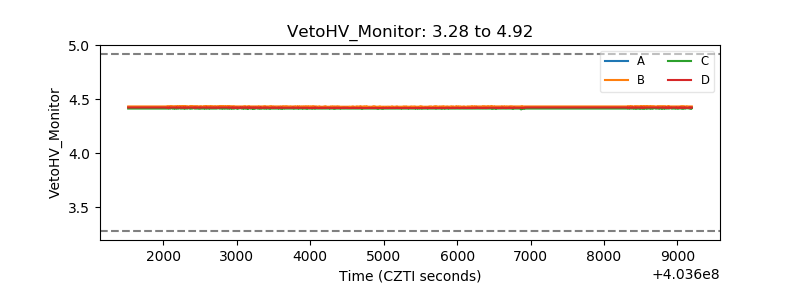 |
| Veto LLD | 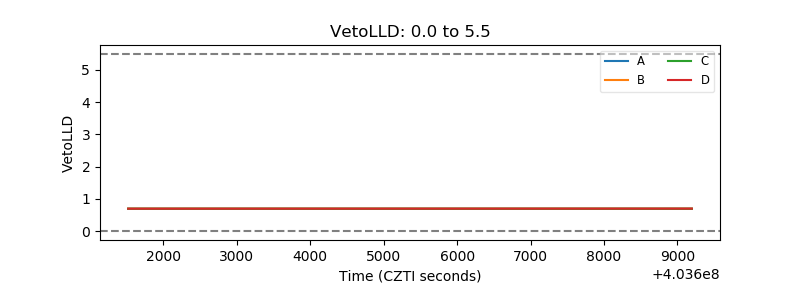 |
| Alpha Counter | 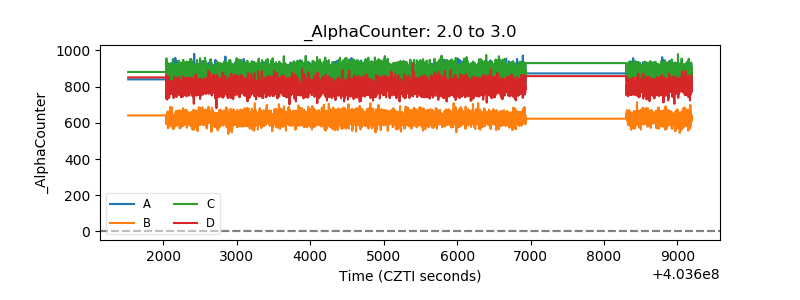 |
| _CPM_Rate | 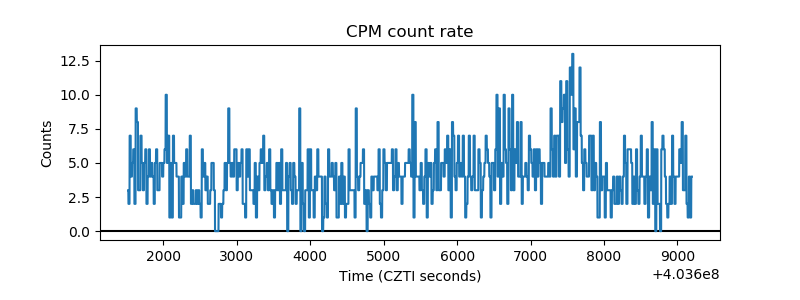 |
| CZT Counter | 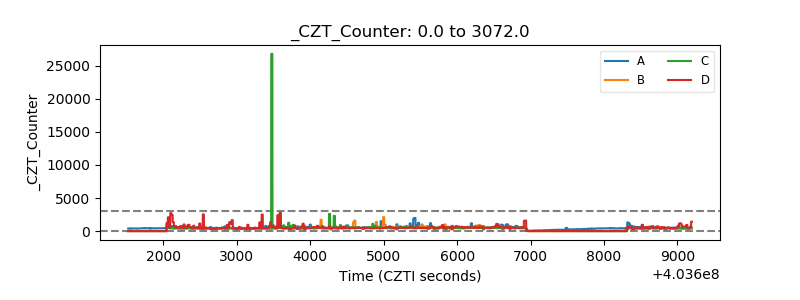 |
| +2.5 Volts monitor | 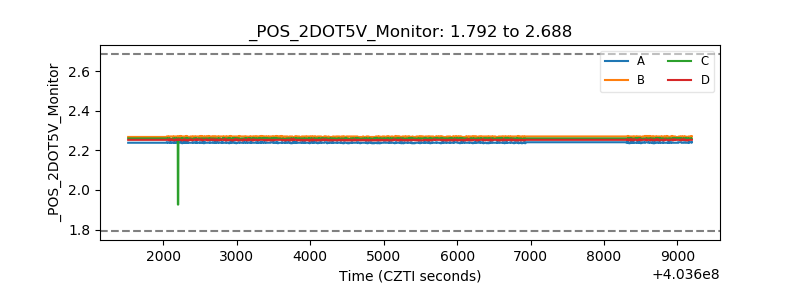 |
| +5 Volts monitor | 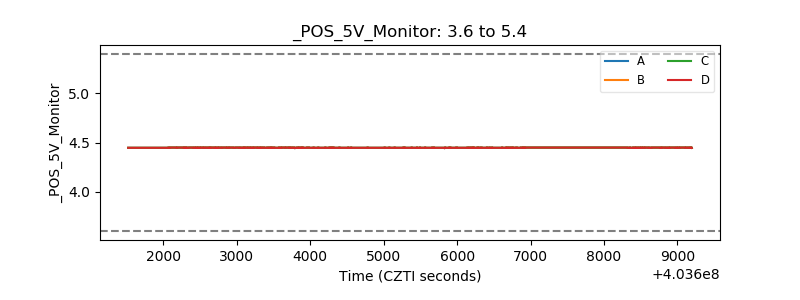 |
| _ROLL_ROT | 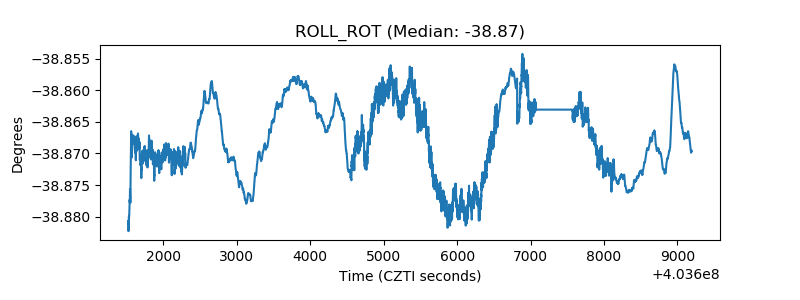 |
| _Roll_DEC | 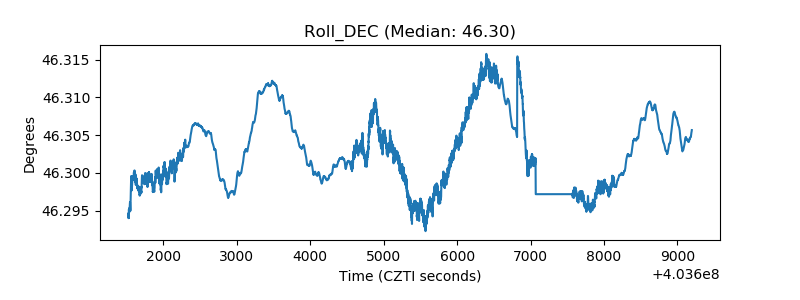 |
| _Roll_RA | 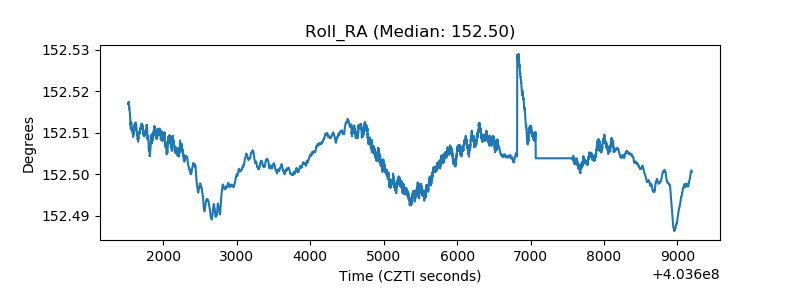 |
| Veto Counter | 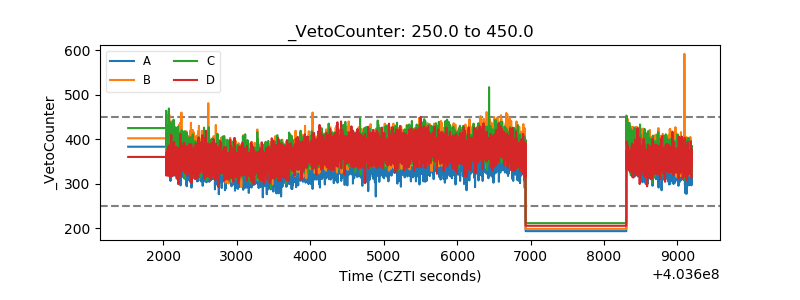 |