| Param | Original file | Final file |
|---|---|---|
| Filename | modeM0/AS1A11_065T21_9000005364_38120cztM0_level2.fits | modeM0/AS1A11_065T21_9000005364_38120cztM0_level2_quad_clean.evt |
| Size (bytes) | 366,840,000 | 97,640,640 |
| Size | 349.8 MB | 93.1 MB |
| Events in quadrant A | 3,681,686 | 656,128 |
| Events in quadrant B | 3,013,678 | 661,766 |
| Events in quadrant C | 2,885,689 | 640,046 |
| Events in quadrant D | 3,538,678 | 585,552 |
| Mode M9 | |||
|---|---|---|---|
| Quadrant | BADHDUFLAG | Total packets | Discarded packets |
| A | 0 | 19 | 0 |
| B | 0 | 19 | 0 |
| C | 0 | 19 | 0 |
| D | 0 | 20 | 0 |
| Mode M0 | |||
|---|---|---|---|
| Quadrant | BADHDUFLAG | Total packets | Discarded packets |
| A | 0 | 14510 | 3 |
| B | 0 | 12910 | 2 |
| C | 0 | 12043 | 2 |
| D | 0 | 14331 | 2 |
| Mode SS | |||
|---|---|---|---|
| Quadrant | BADHDUFLAG | Total packets | Discarded packets |
| A | 0 | 122 | 0 |
| B | 0 | 122 | 0 |
| C | 0 | 122 | 0 |
| D | 0 | 122 | 0 |
| Quadrant | Total seconds | Saturated seconds | Saturation percentage |
|---|---|---|---|
| A | 5903 | 74 | 1.253600% |
| B | 5903 | 132 | 2.236151% |
| C | 5903 | 8 | 0.135524% |
| D | 5903 | 83 | 1.406065% |
Noise dominated data is calculated using 1-second bins in cleaned event files. If a bin has >2000 counts, and if more than 50% of those come from <1% of pixels, then it is considered to be noise-dominated and hence unusable.
| Quadrant | # 1 sec bins | Bins with >0 counts | Bins with >2000 counts | High rate bins dominated by noise | Noise dominated (total time) | Noise dominated (detector-on time) | Marked lightcurve |
|---|---|---|---|---|---|---|---|
| A | 7216 | 5904 | 57 | 57 | 0.79% | 0.97% | 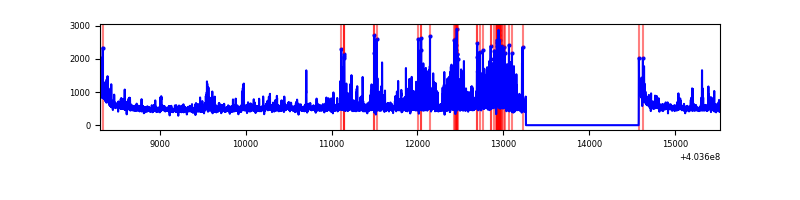 |
| B | 7216 | 5904 | 72 | 72 | 1.00% | 1.22% | 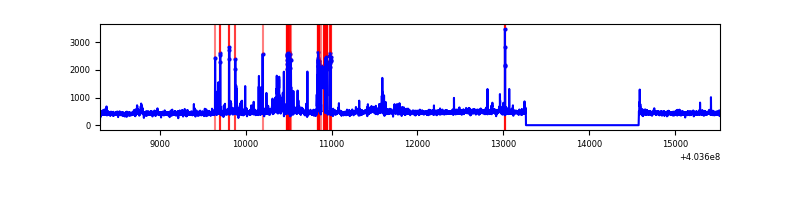 |
| C | 7216 | 5904 | 9 | 9 | 0.12% | 0.15% | 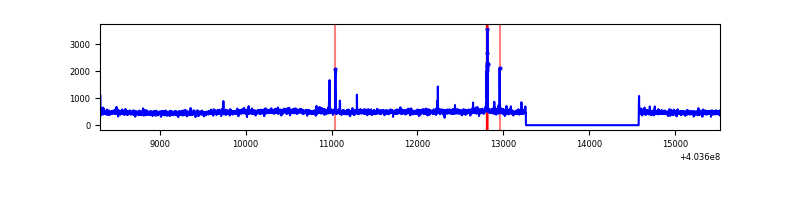 |
| D | 7216 | 5904 | 76 | 76 | 1.05% | 1.29% | 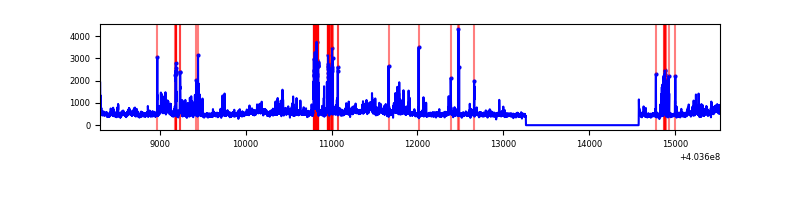 |
Top three noisy pixels from each quadrant. If the there are fewer than three noisy pixels in the level2.evt file, extra rows are filled as -1
| Pixel properties | Quadrant properties | ||||||
|---|---|---|---|---|---|---|---|
| Quadrant | DetID | PixID | Counts | Sigma | Mean | Median | Sigma |
| A | 12 | 16 | 581182 | 4327.75 | 661 | 648 | 134.1 |
| A | 10 | 83 | 386534 | 2876.69 | 661 | 648 | 134.1 |
| A | 12 | 194 | 85482 | 632.42 | 661 | 648 | 134.1 |
| B | 0 | 229 | 376240 | 2968.36 | 649 | 632 | 126.5 |
| B | 5 | 172 | 41074 | 319.61 | 649 | 632 | 126.5 |
| B | 15 | 85 | 16133 | 122.5 | 649 | 632 | 126.5 |
| C | 15 | 214 | 246796 | 1629.01 | 645 | 649 | 151.1 |
| C | 3 | 233 | 59488 | 389.4 | 645 | 649 | 151.1 |
| C | 1 | 23 | 53865 | 352.18 | 645 | 649 | 151.1 |
| D | 12 | 235 | 358345 | 2258.56 | 640 | 620 | 158.4 |
| D | 1 | 20 | 158148 | 994.58 | 640 | 620 | 158.4 |
| D | 12 | 227 | 144692 | 909.62 | 640 | 620 | 158.4 |
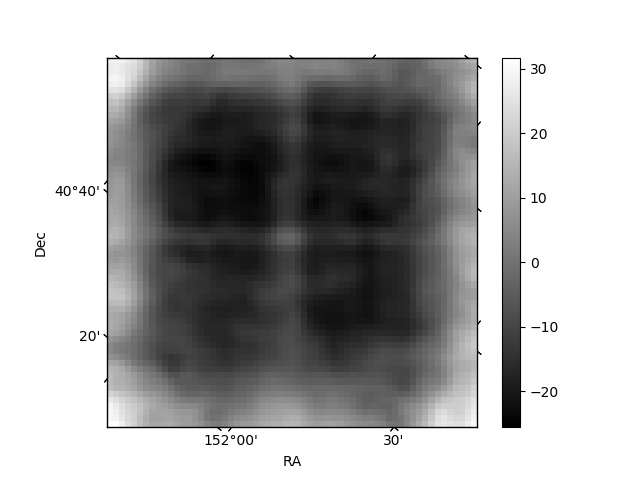
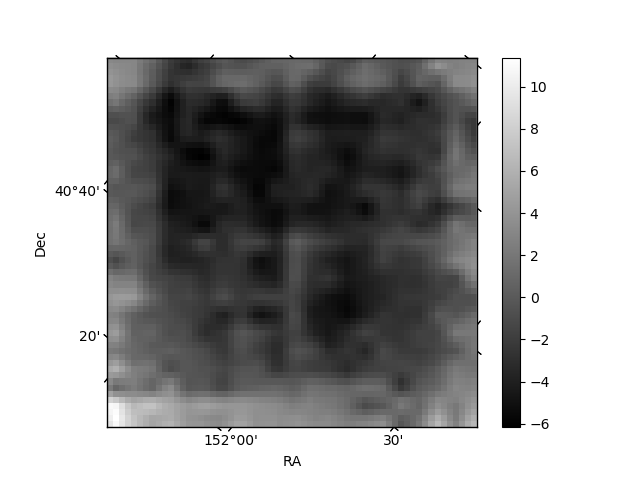
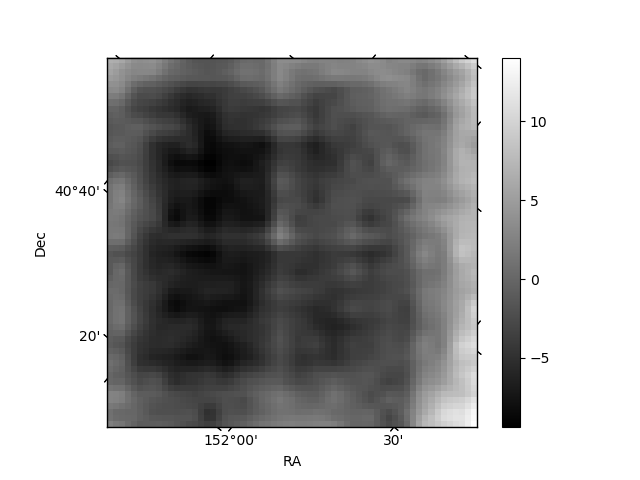
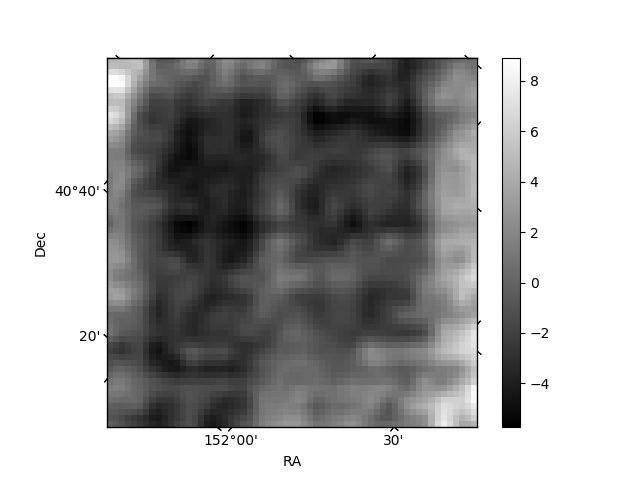
Histogram calculated using DETX and DETY for each event in the final _common_clean file
| Quadrant A | 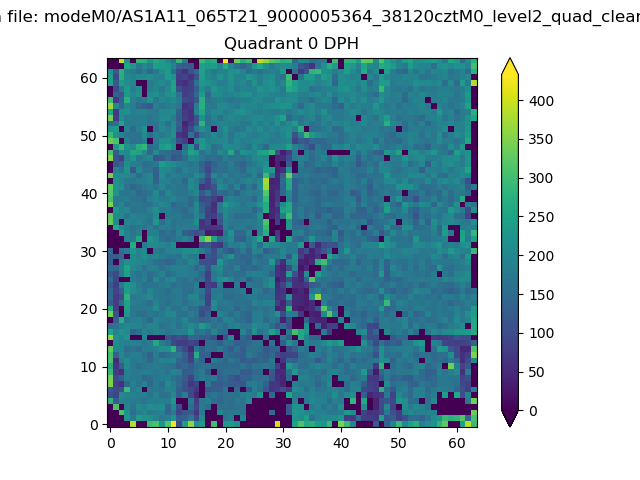 |
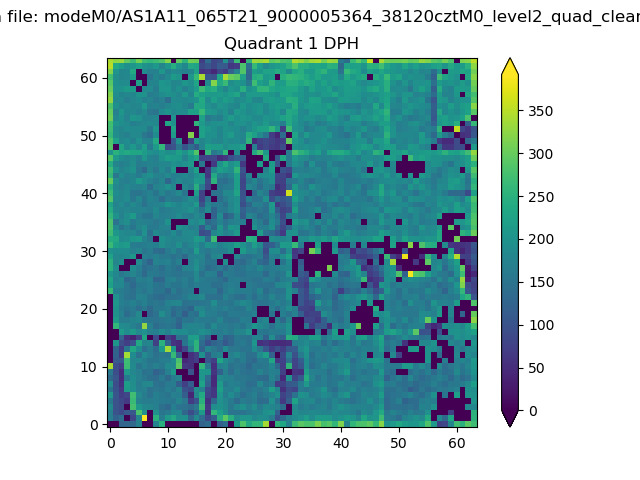 |
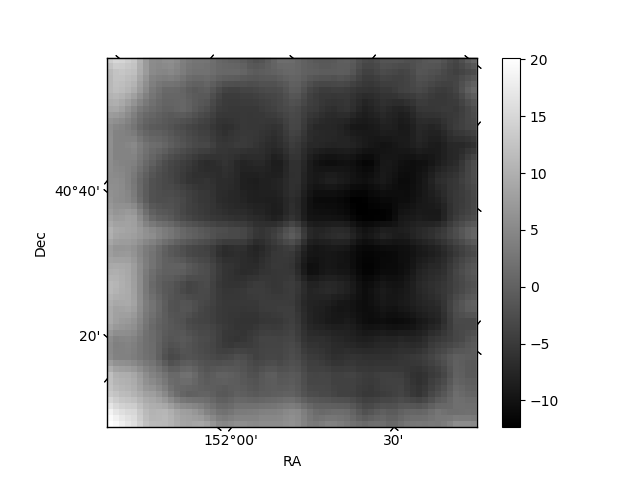
Quadrant B |
|---|---|---|---|
| Quadrant D | 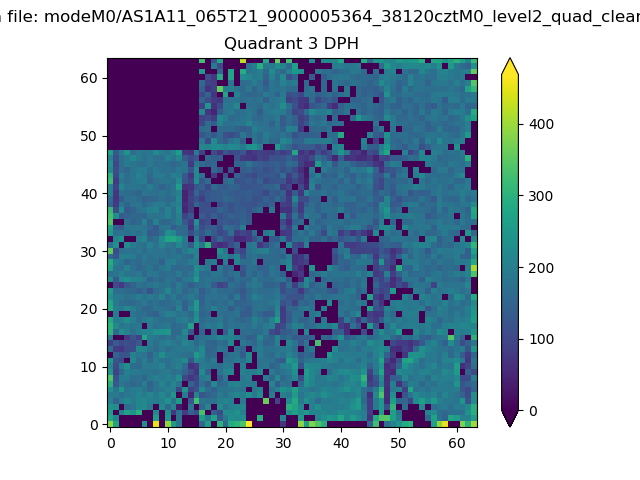 |
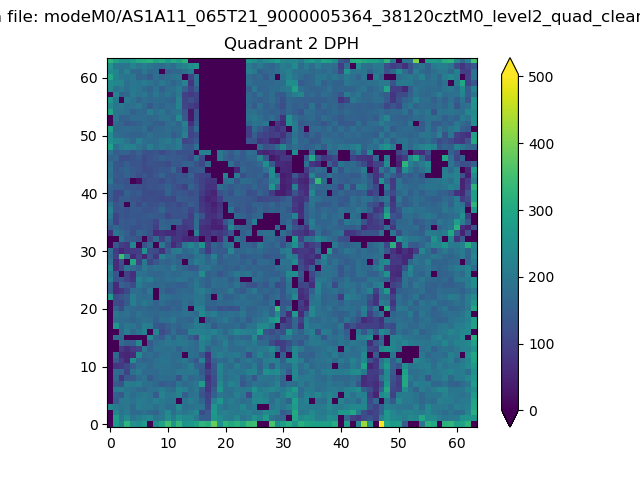 |
Quadrant C |
| Plot type | Count rate plots | Images |
|---|---|---|
| Comparison with Poisson distribution Blue bars denote a histogram of data divided into 1 sec bins. Red curve is a Poisson curve with rate = median count rate of data. |
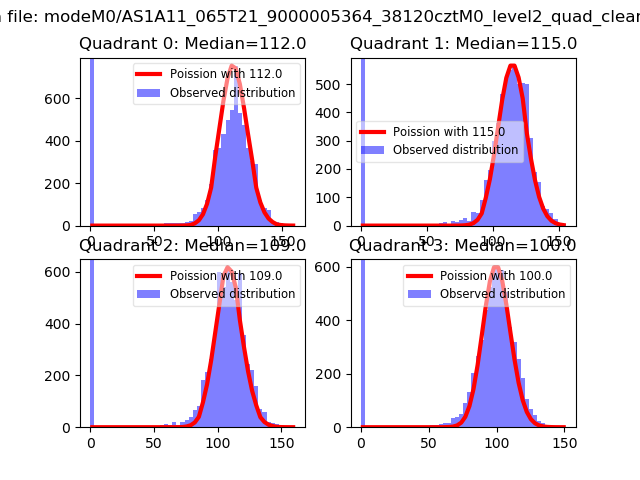 |
 |
| Quadrant-wise count rates Data is divided into 100 sec bins |
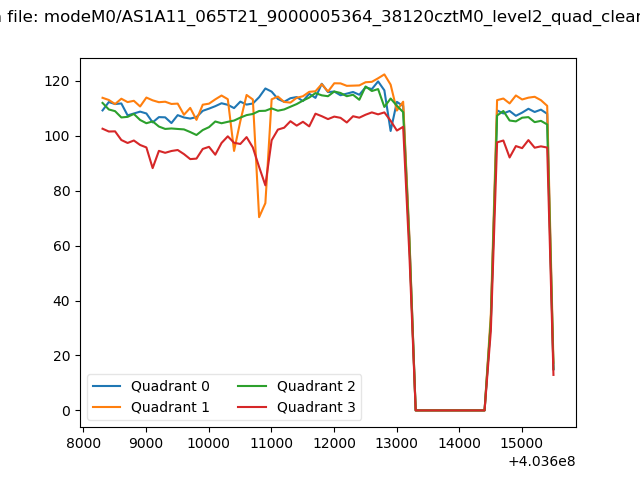 |
|
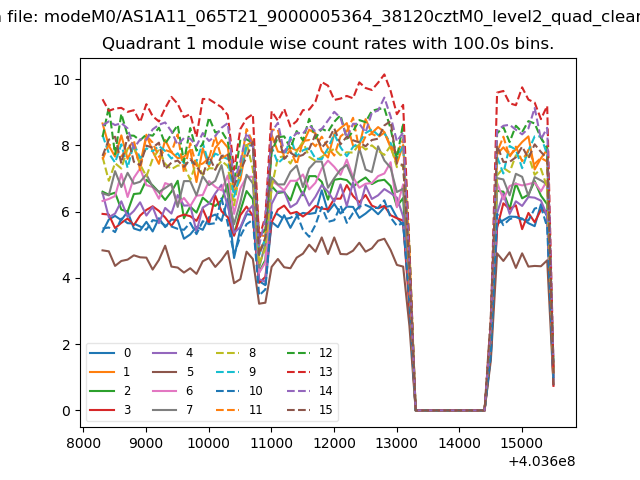
| Module-wise count rates for Quadrant A Data is divided into 100 sec bins |
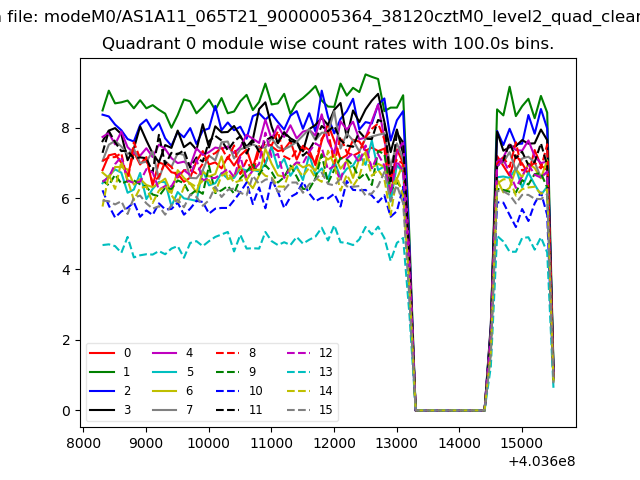 |
 |
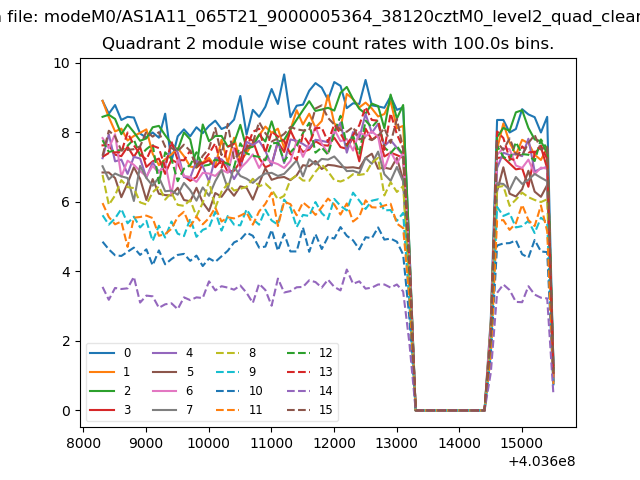
| Module-wise count rates for Quadrant B Data is divided into 100 sec bins |
 |
 |
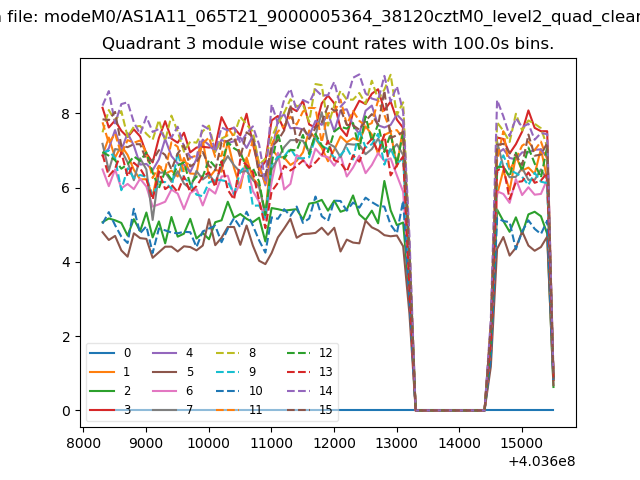
| Module-wise count rates for Quadrant C Data is divided into 100 sec bins |
 |
 |
| Module-wise count rates for Quadrant D Data is divided into 100 sec bins |
 |
 |
| Parameter | Plot |
|---|---|
| CZT HV Monitor |  |
| D_VDD | 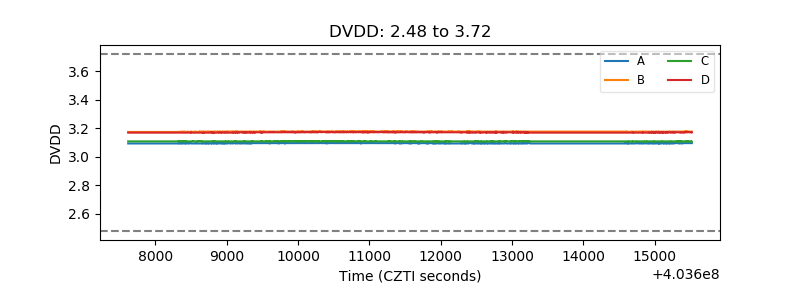 |
| Temperature 1 | 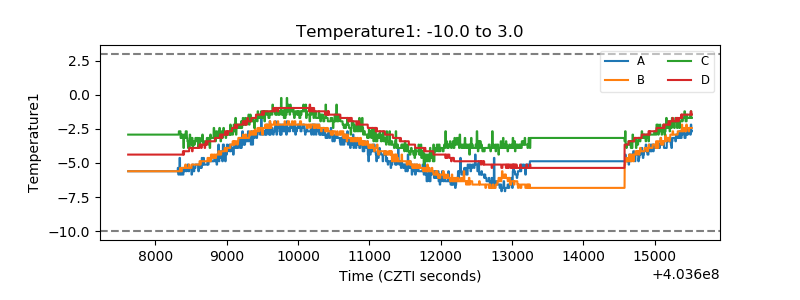 |
| Veto HV Monitor | 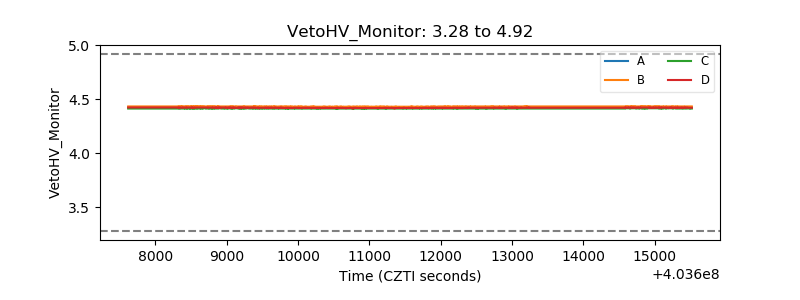 |
| Veto LLD | 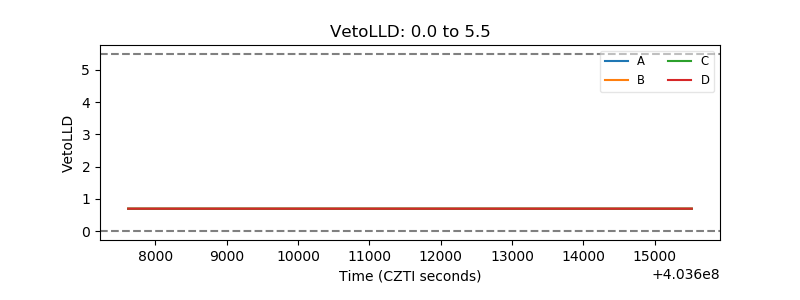 |
| Alpha Counter | 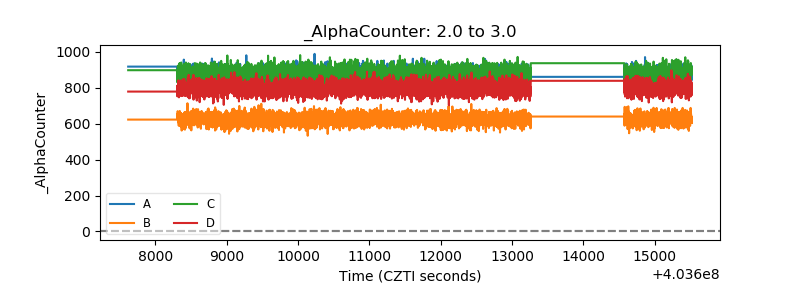 |
| _CPM_Rate | 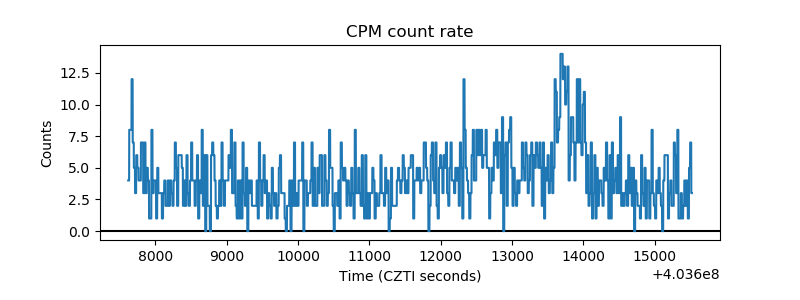 |
| CZT Counter | 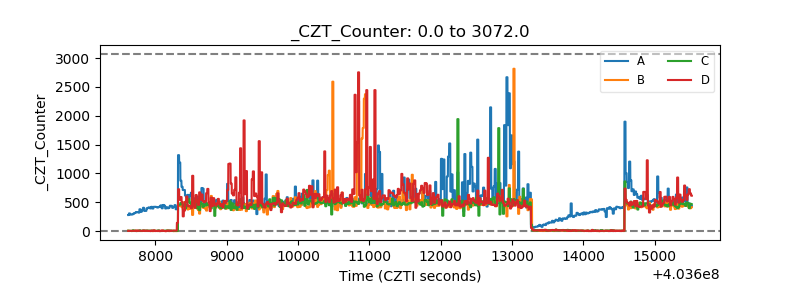 |
| +2.5 Volts monitor | 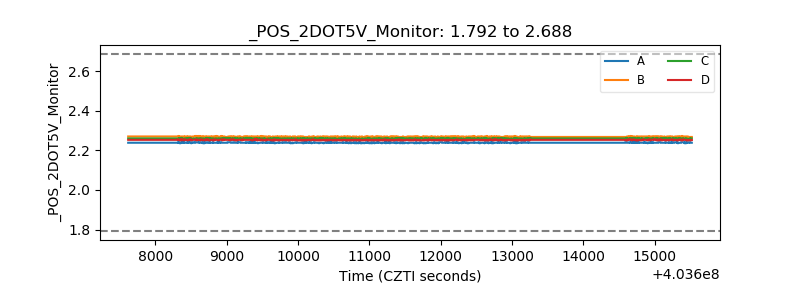 |
| +5 Volts monitor | 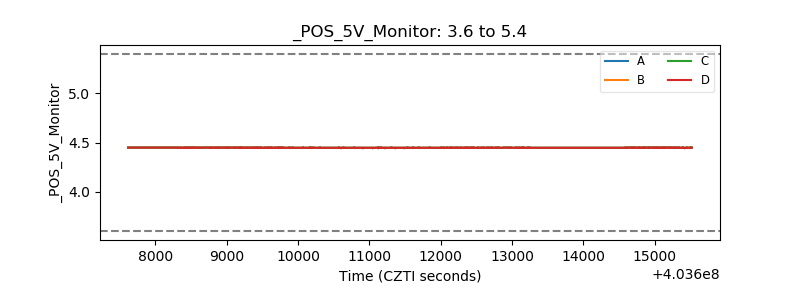 |
| _ROLL_ROT | 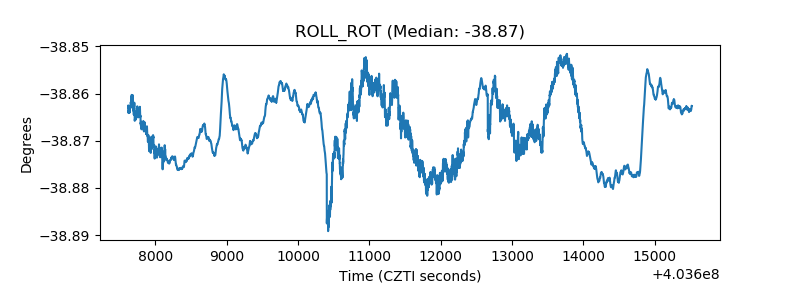 |
| _Roll_DEC | 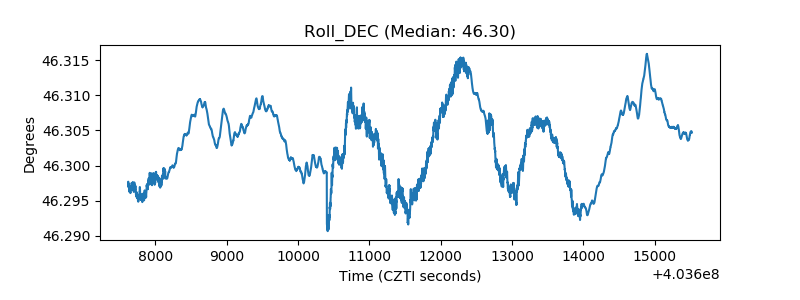 |
| _Roll_RA | 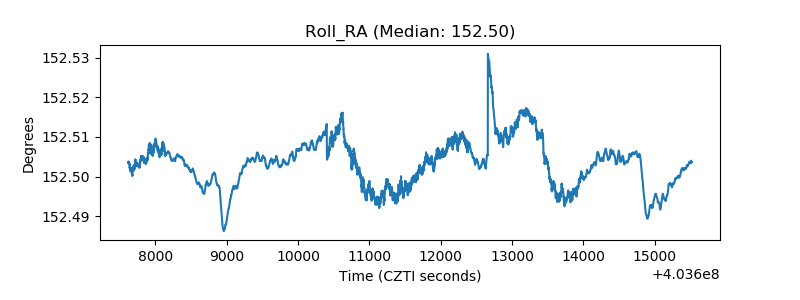 |
| Veto Counter | 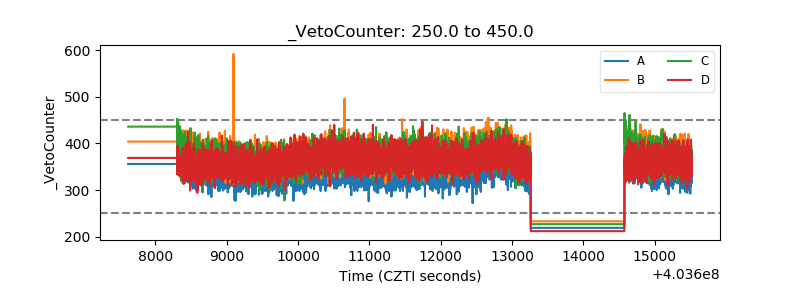 |