| Param | Original file | Final file |
|---|---|---|
| Filename | modeM0/AS1A11_065T21_9000005364_38122cztM0_level2.fits | modeM0/AS1A11_065T21_9000005364_38122cztM0_level2_quad_clean.evt |
| Size (bytes) | 658,667,520 | 176,526,720 |
| Size | 628.2 MB | 168.3 MB |
| Events in quadrant A | 6,350,446 | 1,190,837 |
| Events in quadrant B | 5,451,519 | 1,199,341 |
| Events in quadrant C | 5,353,682 | 1,154,227 |
| Events in quadrant D | 6,397,124 | 1,060,128 |
| Mode M9 | |||
|---|---|---|---|
| Quadrant | BADHDUFLAG | Total packets | Discarded packets |
| A | 0 | 28 | 0 |
| B | 0 | 28 | 0 |
| C | 0 | 28 | 0 |
| D | 0 | 28 | 0 |
| Mode M0 | |||
|---|---|---|---|
| Quadrant | BADHDUFLAG | Total packets | Discarded packets |
| A | 0 | 25437 | 3 |
| B | 0 | 23258 | 5 |
| C | 0 | 22162 | 10 |
| D | 0 | 26025 | 9 |
| Mode SS | |||
|---|---|---|---|
| Quadrant | BADHDUFLAG | Total packets | Discarded packets |
| A | 0 | 218 | 0 |
| B | 0 | 218 | 0 |
| C | 0 | 218 | 0 |
| D | 0 | 218 | 0 |
| Quadrant | Total seconds | Saturated seconds | Saturation percentage |
|---|---|---|---|
| A | 10693 | 84 | 0.785561% |
| B | 10691 | 157 | 1.468525% |
| C | 10688 | 29 | 0.271332% |
| D | 10689 | 83 | 0.776499% |
Noise dominated data is calculated using 1-second bins in cleaned event files. If a bin has >2000 counts, and if more than 50% of those come from <1% of pixels, then it is considered to be noise-dominated and hence unusable.
| Quadrant | # 1 sec bins | Bins with >0 counts | Bins with >2000 counts | High rate bins dominated by noise | Noise dominated (total time) | Noise dominated (detector-on time) | Marked lightcurve |
|---|---|---|---|---|---|---|---|
| A | 13469 | 10695 | 61 | 61 | 0.45% | 0.57% | 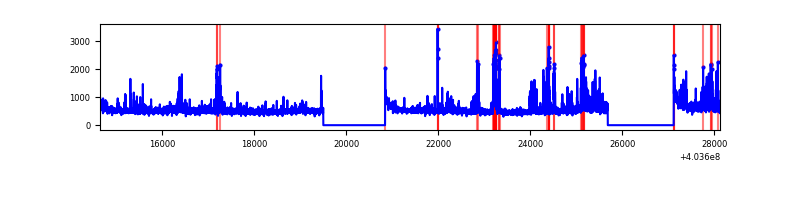 |
| B | 13469 | 10694 | 121 | 121 | 0.90% | 1.13% | 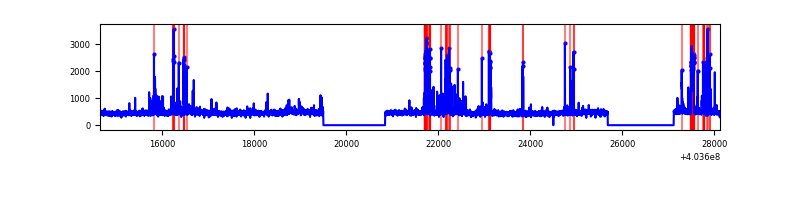 |
| C | 13469 | 10693 | 17 | 17 | 0.13% | 0.16% | 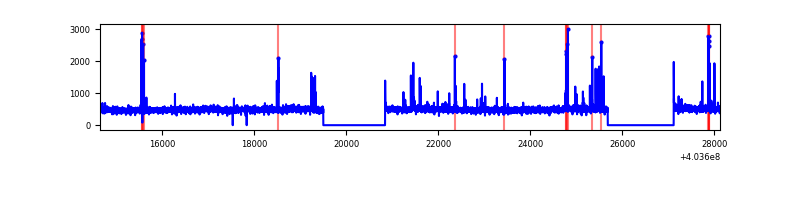 |
| D | 13469 | 10693 | 69 | 69 | 0.51% | 0.65% | 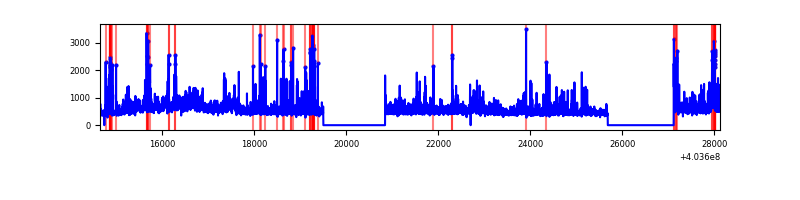 |
Top three noisy pixels from each quadrant. If the there are fewer than three noisy pixels in the level2.evt file, extra rows are filled as -1
| Pixel properties | Quadrant properties | ||||||
|---|---|---|---|---|---|---|---|
| Quadrant | DetID | PixID | Counts | Sigma | Mean | Median | Sigma |
| A | 12 | 16 | 759726 | 3102.53 | 1213 | 1189 | 244.5 |
| A | 10 | 83 | 640210 | 2613.69 | 1213 | 1189 | 244.5 |
| A | 12 | 194 | 123055 | 498.45 | 1213 | 1189 | 244.5 |
| B | 5 | 172 | 352284 | 1517.88 | 1197 | 1163 | 231.3 |
| B | 0 | 229 | 322578 | 1389.46 | 1197 | 1163 | 231.3 |
| B | 12 | 111 | 29425 | 122.17 | 1197 | 1163 | 231.3 |
| C | 15 | 214 | 441700 | 1604.86 | 1180 | 1187 | 274.5 |
| C | 5 | 250 | 139823 | 505.07 | 1180 | 1187 | 274.5 |
| C | 3 | 233 | 88524 | 318.18 | 1180 | 1187 | 274.5 |
| D | 12 | 235 | 537397 | 1879.39 | 1178 | 1148 | 285.3 |
| D | 1 | 52 | 349876 | 1222.19 | 1178 | 1148 | 285.3 |
| D | 7 | 223 | 233870 | 815.62 | 1178 | 1148 | 285.3 |
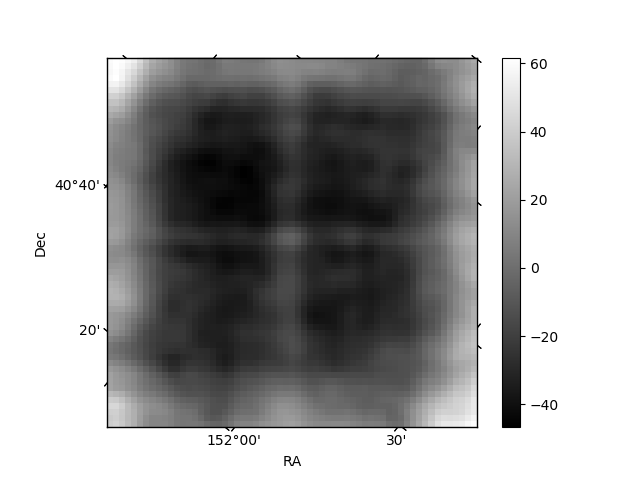
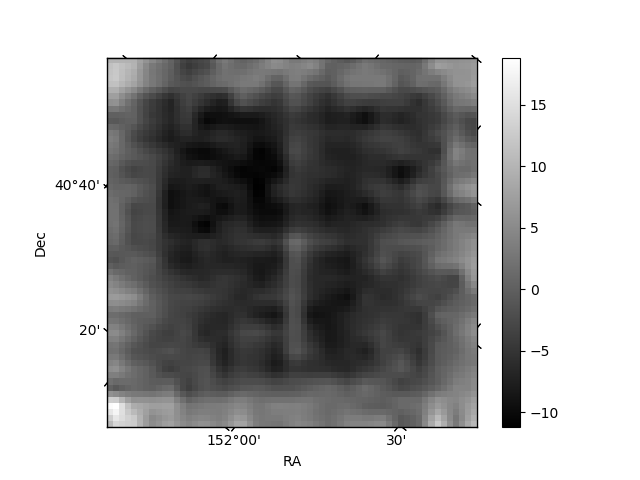
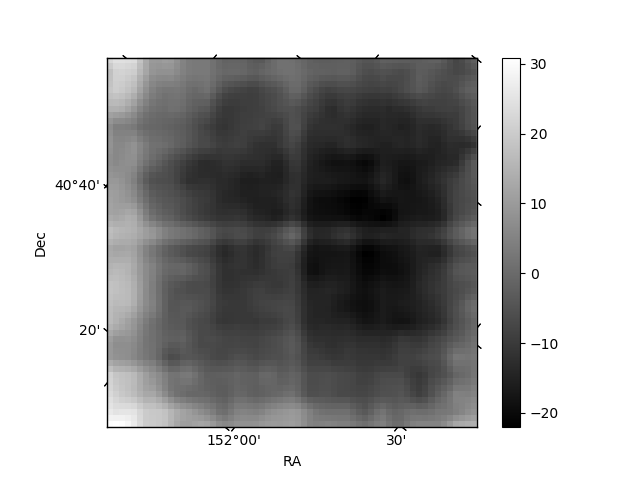
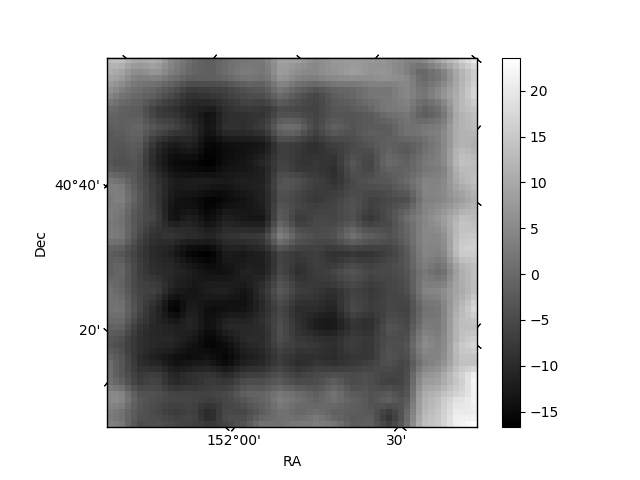
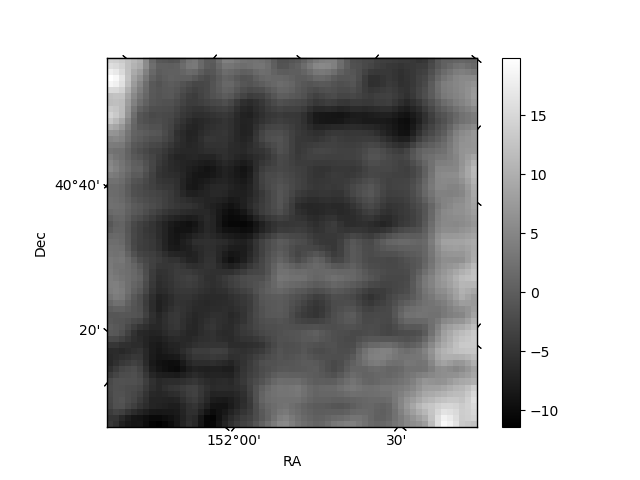
Histogram calculated using DETX and DETY for each event in the final _common_clean file
| Quadrant A | 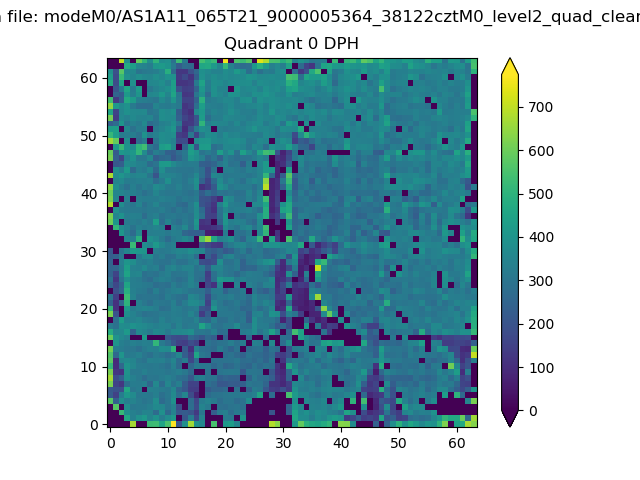 |
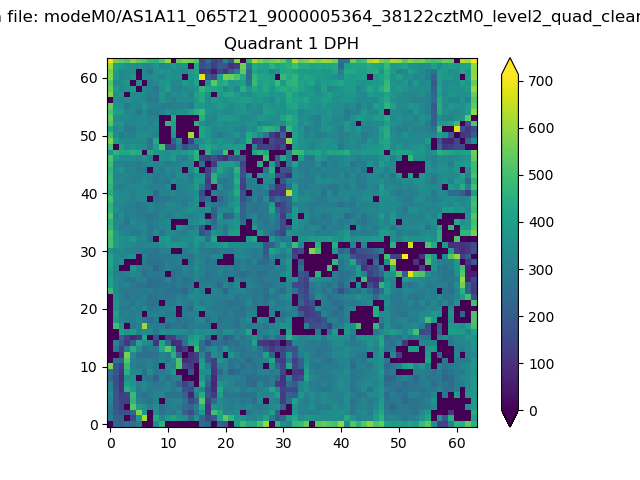 |
Quadrant B |
|---|---|---|---|
| Quadrant D | 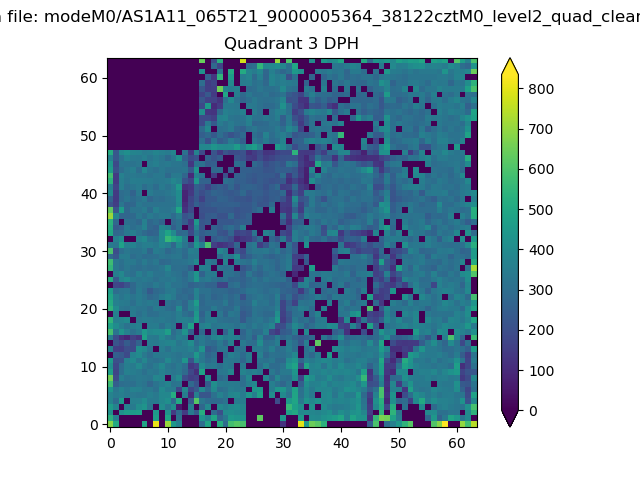 |
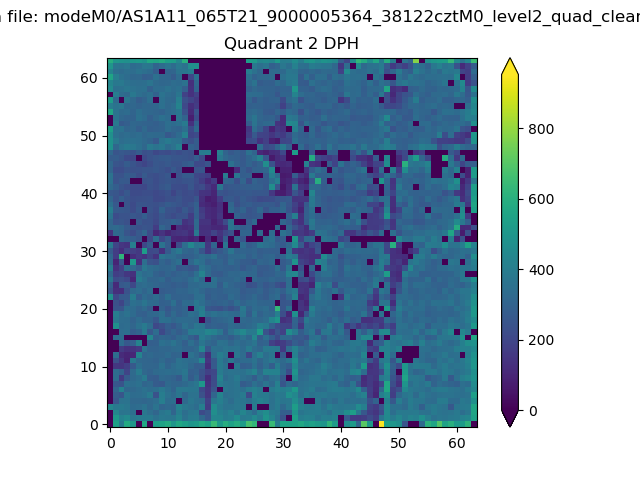 |
Quadrant C |
| Plot type | Count rate plots | Images |
|---|---|---|
| Comparison with Poisson distribution Blue bars denote a histogram of data divided into 1 sec bins. Red curve is a Poisson curve with rate = median count rate of data. |
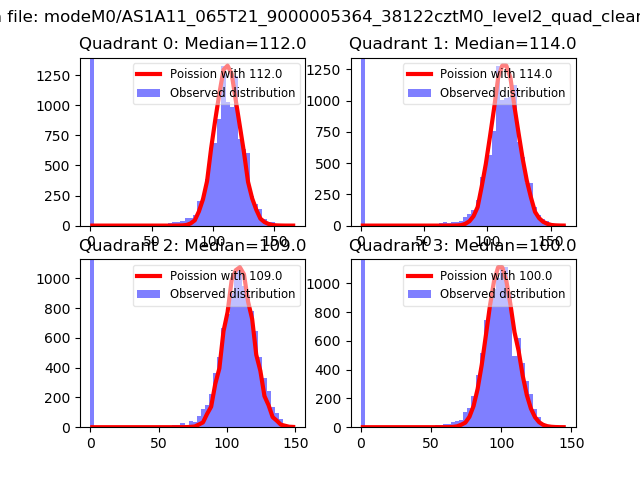 |
 |
| Quadrant-wise count rates Data is divided into 100 sec bins |
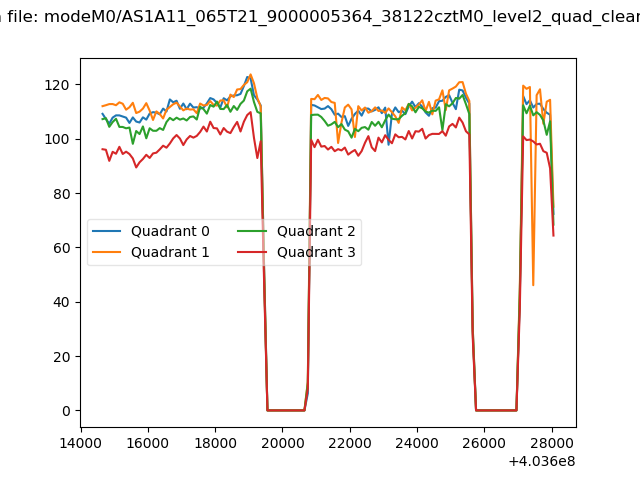 |
|
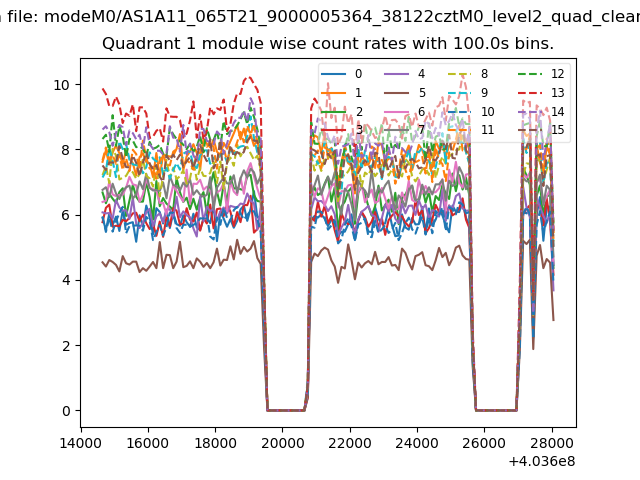
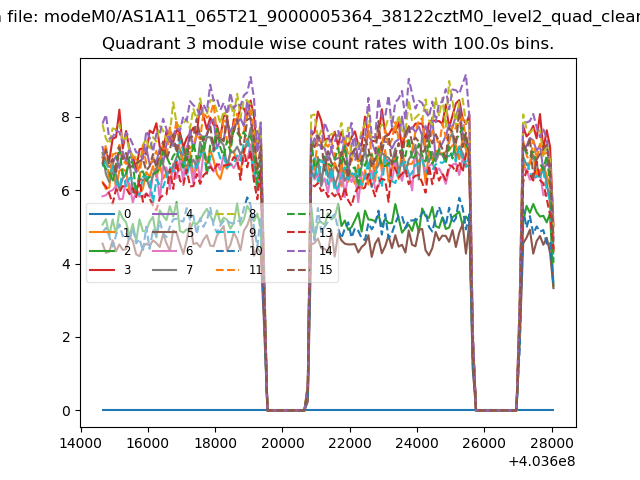
| Module-wise count rates for Quadrant A Data is divided into 100 sec bins |
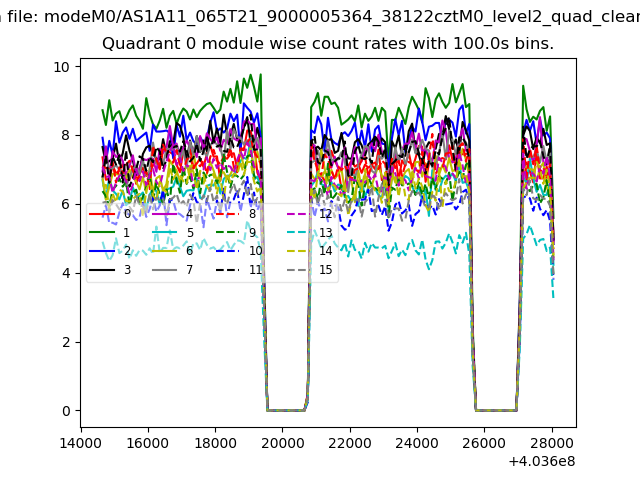 |
 |
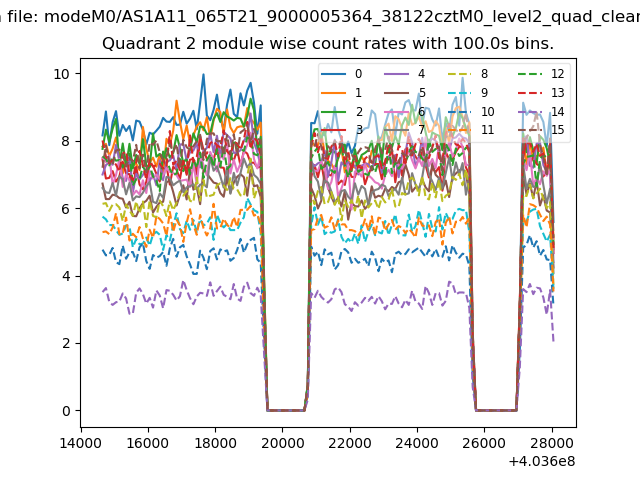
| Module-wise count rates for Quadrant B Data is divided into 100 sec bins |
 |
 |
| Module-wise count rates for Quadrant C Data is divided into 100 sec bins |
 |
 |
| Module-wise count rates for Quadrant D Data is divided into 100 sec bins |
 |
 |
| Parameter | Plot |
|---|---|
| CZT HV Monitor |  |
| D_VDD | 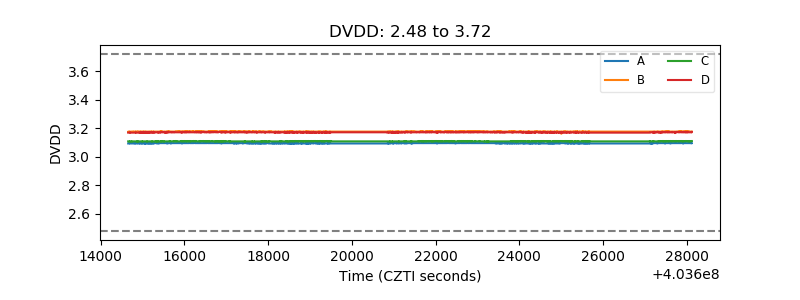 |
| Temperature 1 | 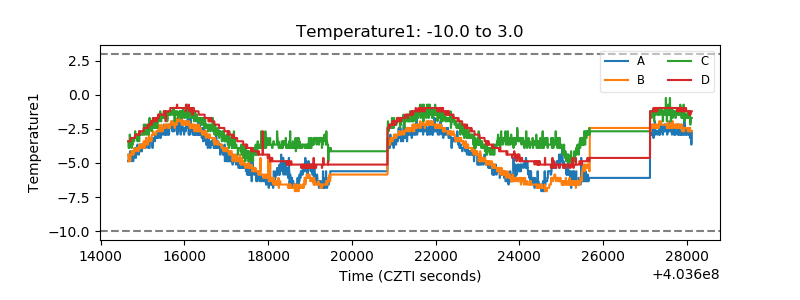 |
| Veto HV Monitor | 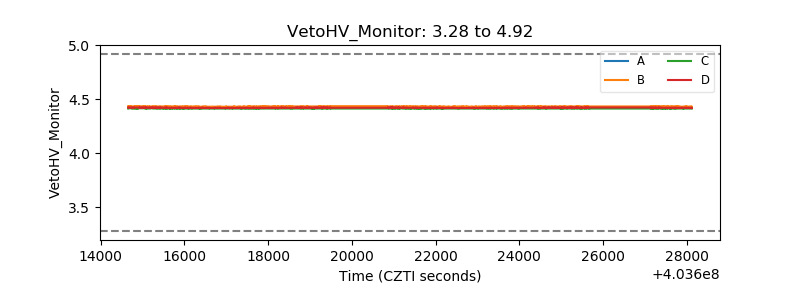 |
| Veto LLD | 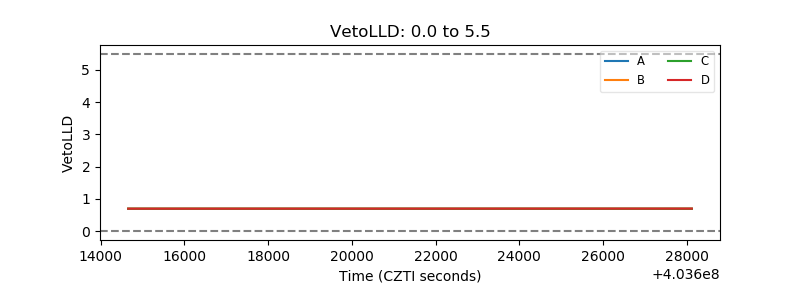 |
| Alpha Counter | 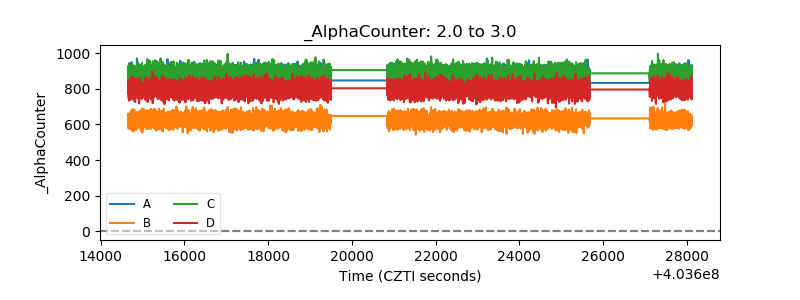 |
| _CPM_Rate | 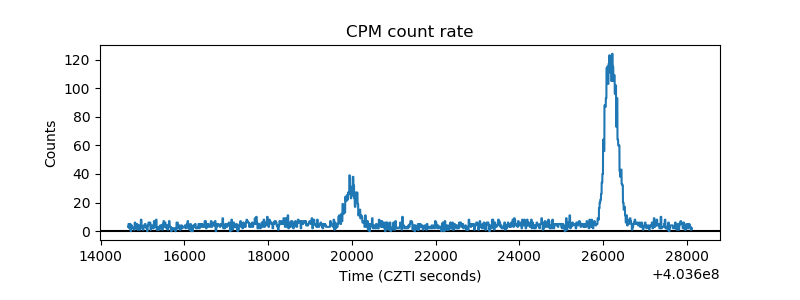 |
| CZT Counter | 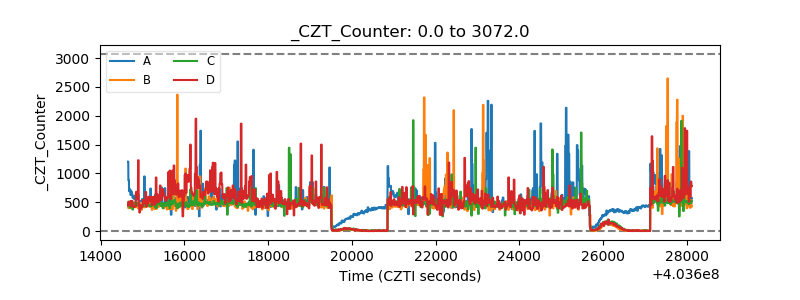 |
| +2.5 Volts monitor | 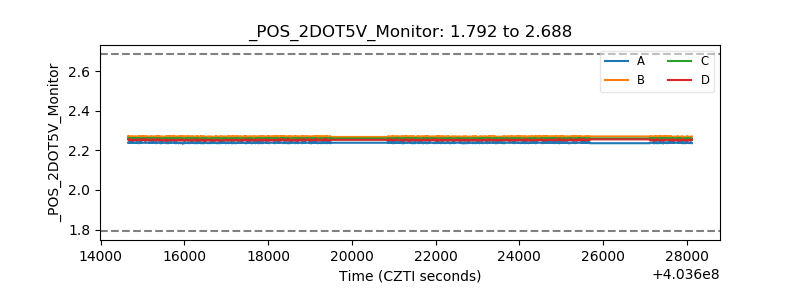 |
| +5 Volts monitor | 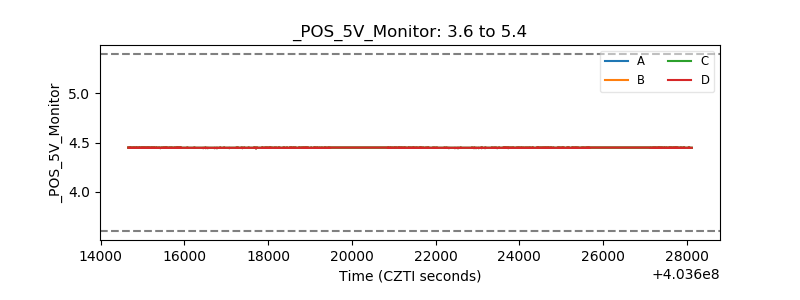 |
| _ROLL_ROT | 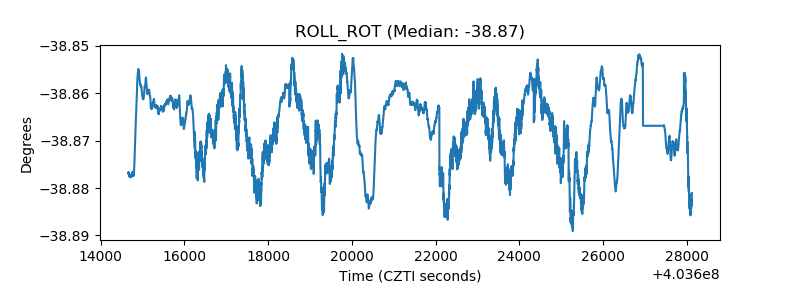 |
| _Roll_DEC | 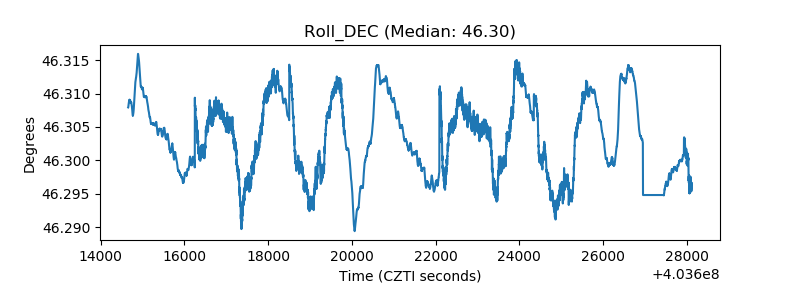 |
| _Roll_RA | 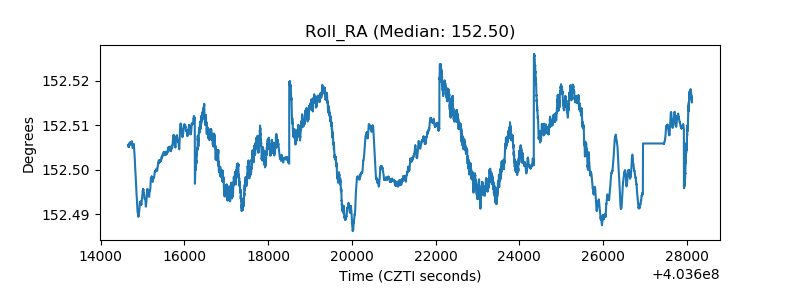 |
| Veto Counter | 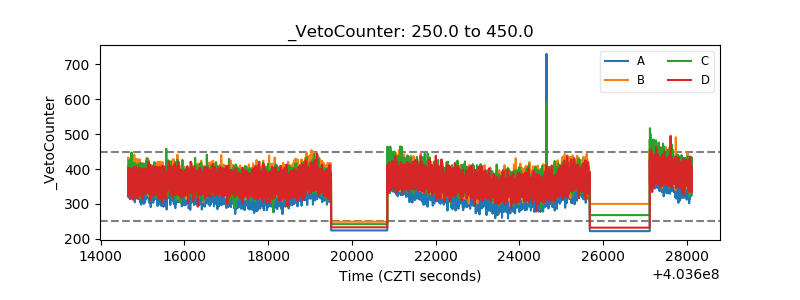 |