| Param | Original file | Final file |
|---|---|---|
| Filename | modeM0/AS1A11_065T21_9000005364_38123cztM0_level2.fits | modeM0/AS1A11_065T21_9000005364_38123cztM0_level2_quad_clean.evt |
| Size (bytes) | 374,993,280 | 96,557,760 |
| Size | 357.6 MB | 92.1 MB |
| Events in quadrant A | 3,643,843 | 654,040 |
| Events in quadrant B | 3,047,464 | 654,114 |
| Events in quadrant C | 3,252,777 | 626,089 |
| Events in quadrant D | 3,489,850 | 587,360 |
| Mode M9 | |||
|---|---|---|---|
| Quadrant | BADHDUFLAG | Total packets | Discarded packets |
| A | 0 | 15 | 0 |
| B | 0 | 15 | 0 |
| C | 0 | 15 | 0 |
| D | 0 | 16 | 0 |
| Mode M0 | |||
|---|---|---|---|
| Quadrant | BADHDUFLAG | Total packets | Discarded packets |
| A | 0 | 14576 | 3 |
| B | 0 | 12897 | 2 |
| C | 0 | 13076 | 2 |
| D | 0 | 14239 | 2 |
| Mode SS | |||
|---|---|---|---|
| Quadrant | BADHDUFLAG | Total packets | Discarded packets |
| A | 0 | 118 | 0 |
| B | 0 | 118 | 0 |
| C | 0 | 118 | 0 |
| D | 0 | 118 | 0 |
| Quadrant | Total seconds | Saturated seconds | Saturation percentage |
|---|---|---|---|
| A | 5747 | 65 | 1.131025% |
| B | 5747 | 125 | 2.175048% |
| C | 5747 | 116 | 2.018444% |
| D | 5747 | 61 | 1.061423% |
Noise dominated data is calculated using 1-second bins in cleaned event files. If a bin has >2000 counts, and if more than 50% of those come from <1% of pixels, then it is considered to be noise-dominated and hence unusable.
| Quadrant | # 1 sec bins | Bins with >0 counts | Bins with >2000 counts | High rate bins dominated by noise | Noise dominated (total time) | Noise dominated (detector-on time) | Marked lightcurve |
|---|---|---|---|---|---|---|---|
| A | 7271 | 5748 | 36 | 36 | 0.50% | 0.63% | 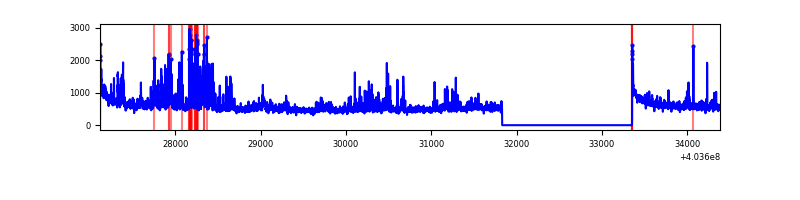 |
| B | 7271 | 5748 | 75 | 75 | 1.03% | 1.30% | 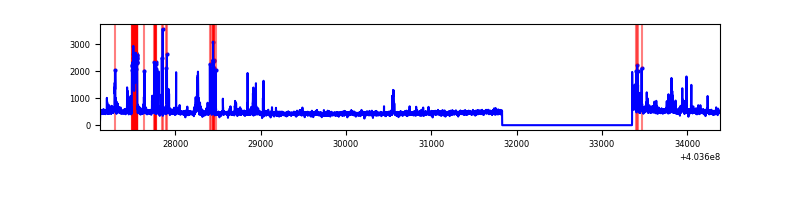 |
| C | 7271 | 5748 | 109 | 109 | 1.50% | 1.90% | 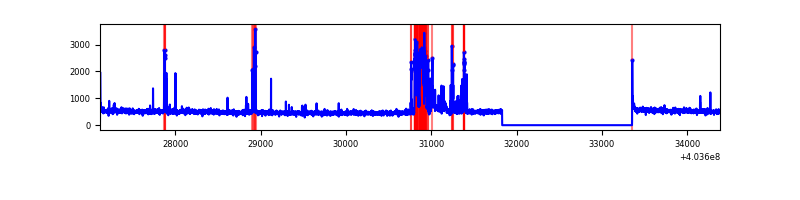 |
| D | 7271 | 5748 | 50 | 50 | 0.69% | 0.87% | 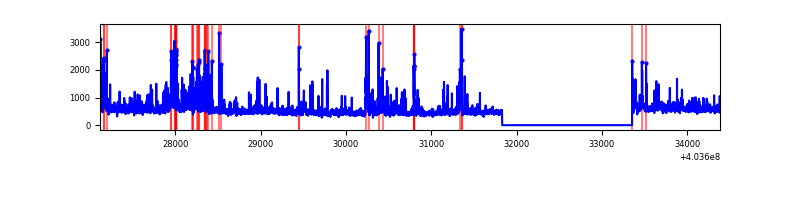 |
Top three noisy pixels from each quadrant. If the there are fewer than three noisy pixels in the level2.evt file, extra rows are filled as -1
| Pixel properties | Quadrant properties | ||||||
|---|---|---|---|---|---|---|---|
| Quadrant | DetID | PixID | Counts | Sigma | Mean | Median | Sigma |
| A | 12 | 16 | 504876 | 3806.05 | 657 | 643 | 132.5 |
| A | 10 | 83 | 394725 | 2974.61 | 657 | 643 | 132.5 |
| A | 12 | 189 | 104498 | 783.92 | 657 | 643 | 132.5 |
| B | 5 | 172 | 203350 | 1613.8 | 648 | 629 | 125.6 |
| B | 0 | 229 | 201472 | 1598.85 | 648 | 629 | 125.6 |
| B | 0 | 186 | 54051 | 425.28 | 648 | 629 | 125.6 |
| C | 5 | 250 | 428565 | 2839.54 | 641 | 642 | 150.7 |
| C | 15 | 214 | 237892 | 1574.31 | 641 | 642 | 150.7 |
| C | 5 | 233 | 40045 | 261.46 | 641 | 642 | 150.7 |
| D | 1 | 52 | 215939 | 1371.08 | 642 | 624 | 157.0 |
| D | 12 | 233 | 211173 | 1340.73 | 642 | 624 | 157.0 |
| D | 13 | 249 | 97442 | 616.52 | 642 | 624 | 157.0 |
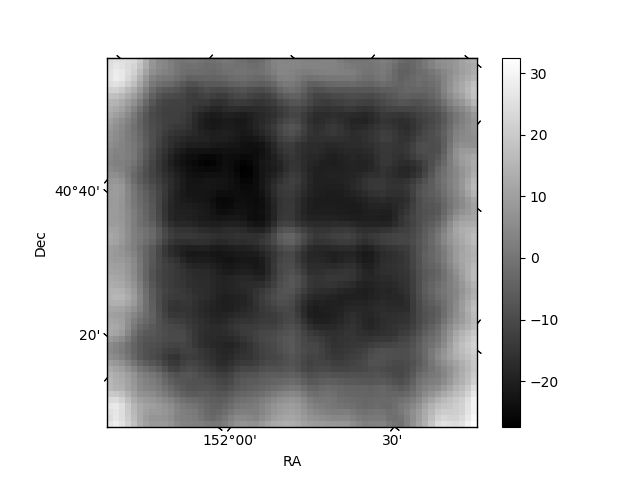
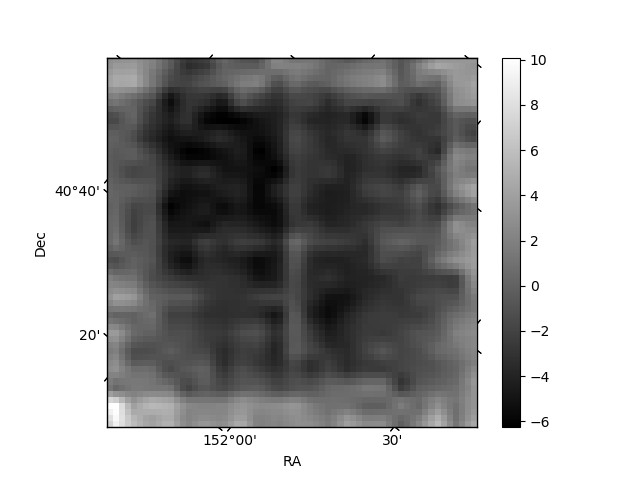
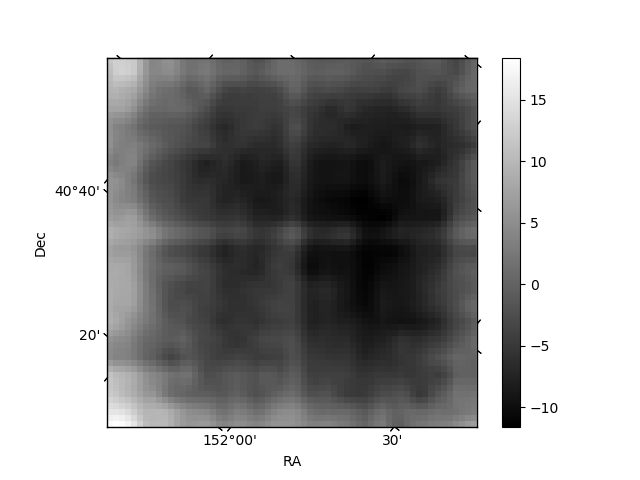
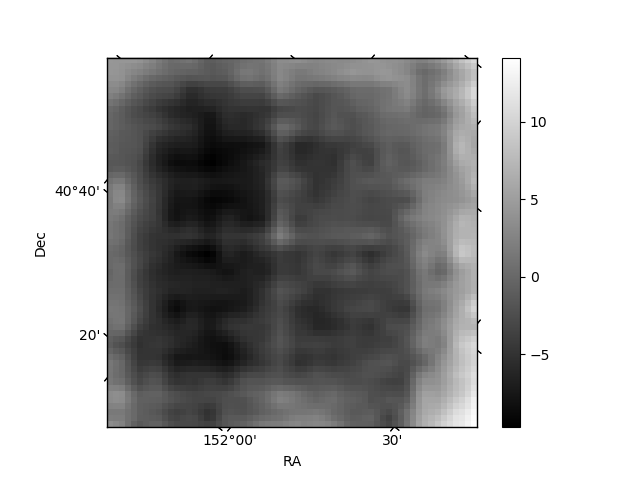
Histogram calculated using DETX and DETY for each event in the final _common_clean file
| Quadrant A | 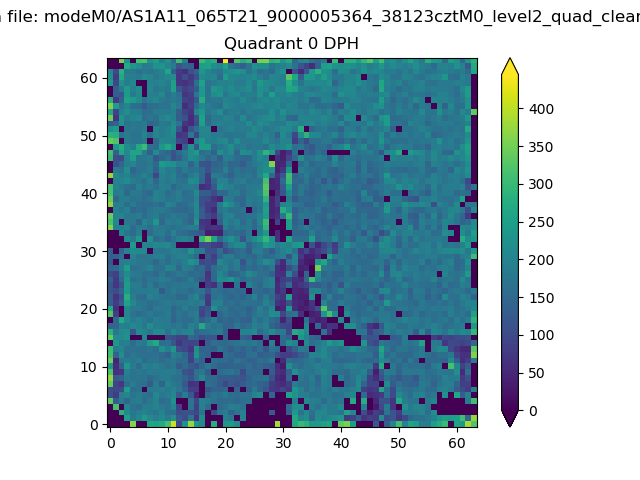 |
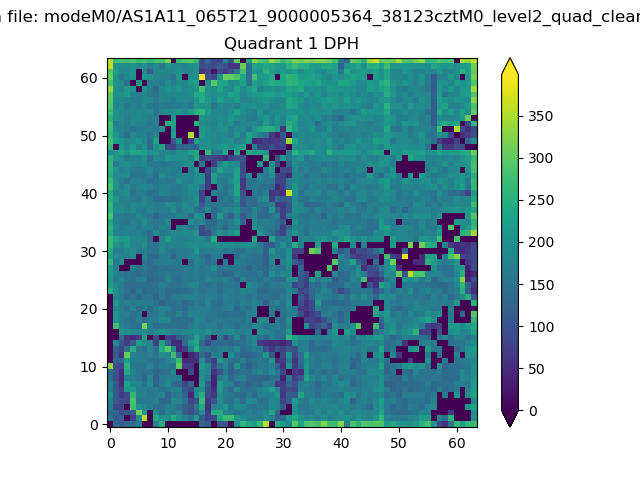 |
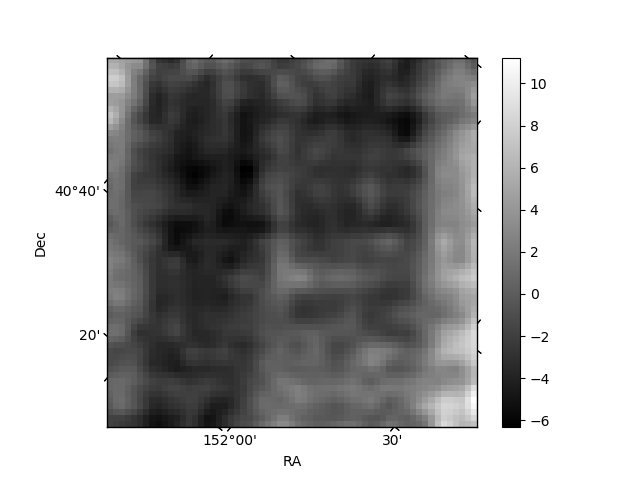
Quadrant B |
|---|---|---|---|
| Quadrant D | 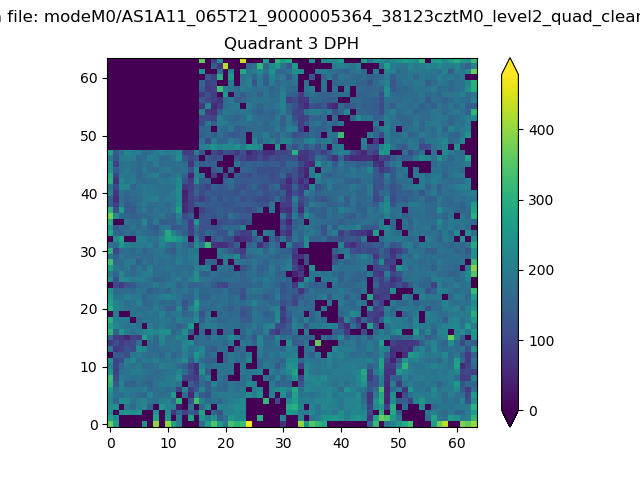 |
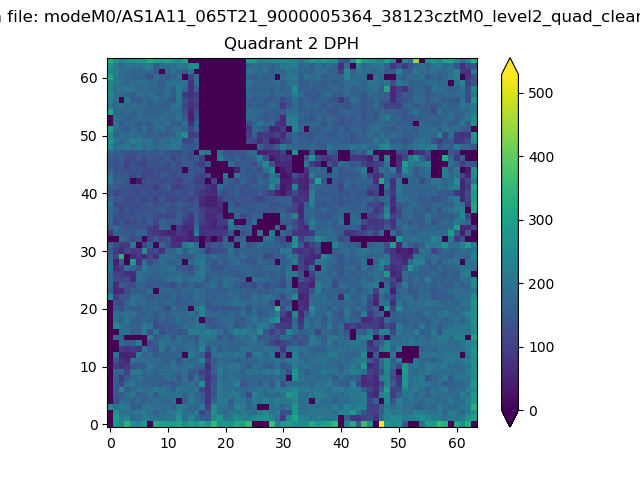 |
Quadrant C |
| Plot type | Count rate plots | Images |
|---|---|---|
| Comparison with Poisson distribution Blue bars denote a histogram of data divided into 1 sec bins. Red curve is a Poisson curve with rate = median count rate of data. |
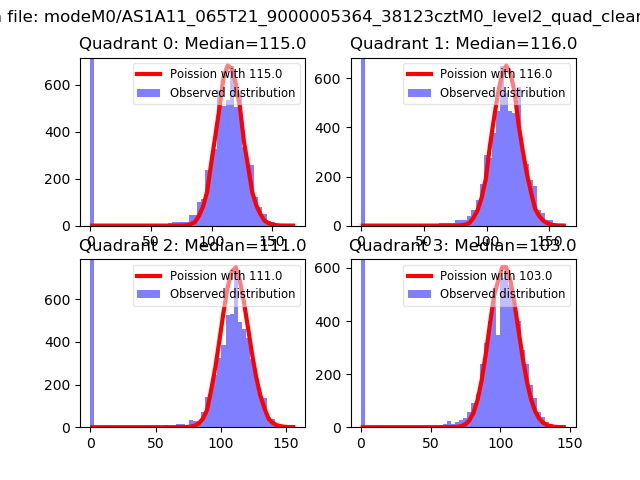 |
 |
| Quadrant-wise count rates Data is divided into 100 sec bins |
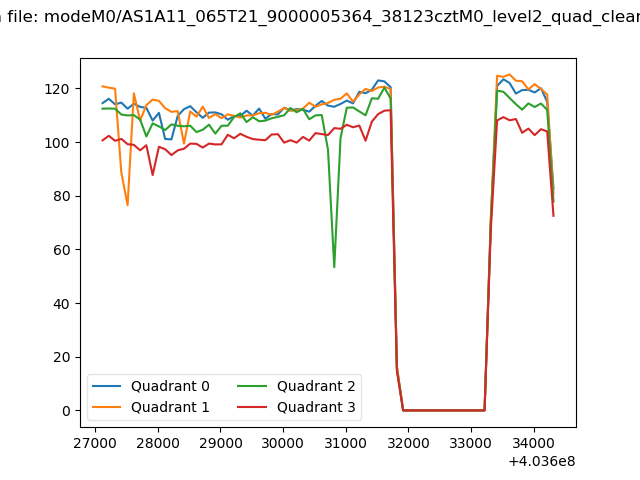 |
|
| Module-wise count rates for Quadrant A Data is divided into 100 sec bins |
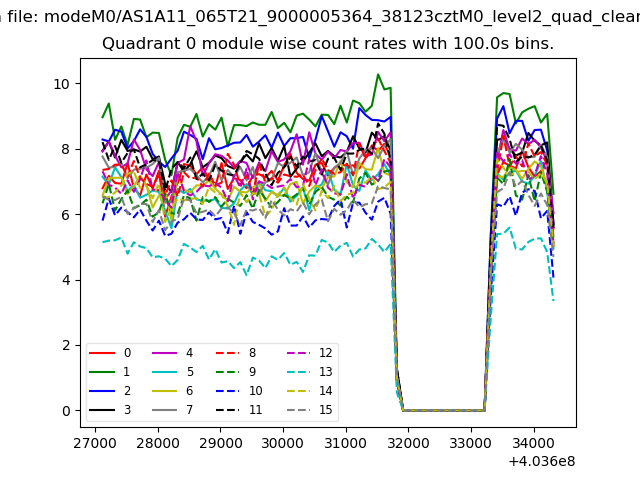 |
 |
| Module-wise count rates for Quadrant B Data is divided into 100 sec bins |
 |
 |
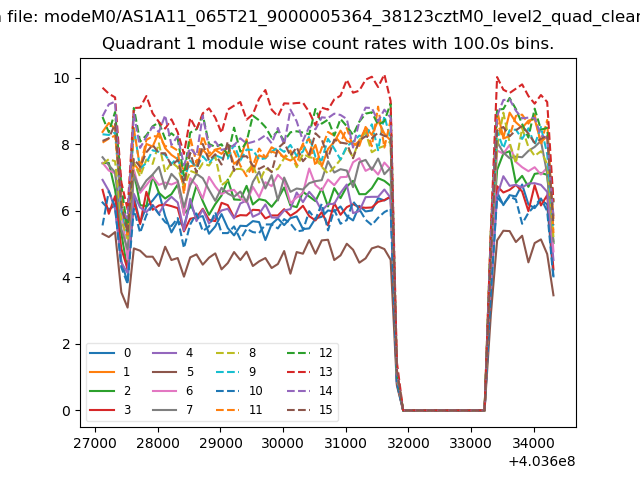
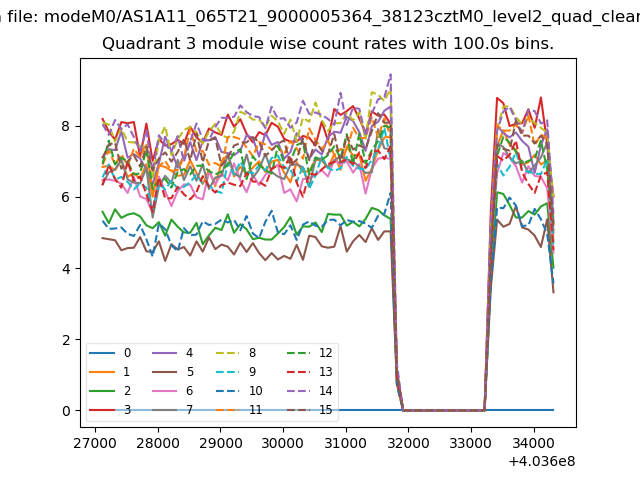
| Module-wise count rates for Quadrant C Data is divided into 100 sec bins |
 |
 |
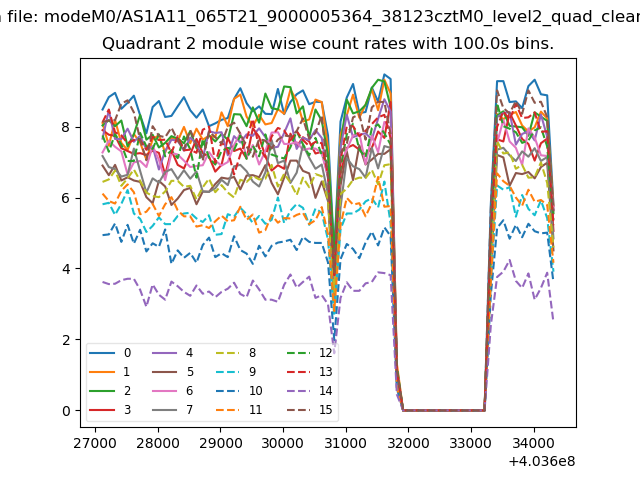
| Module-wise count rates for Quadrant D Data is divided into 100 sec bins |
 |
 |
| Parameter | Plot |
|---|---|
| CZT HV Monitor | 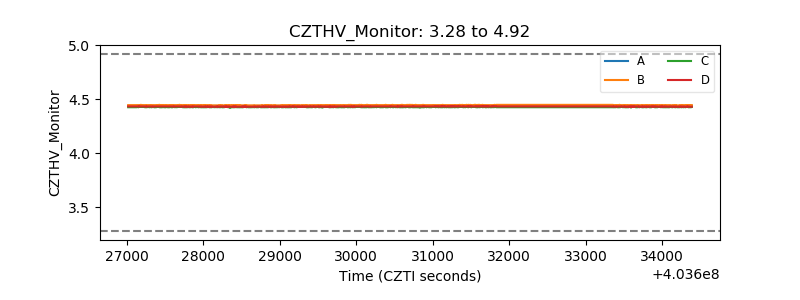 |
| D_VDD | 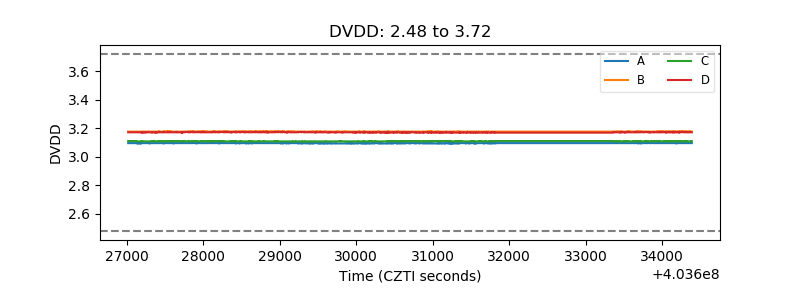 |
| Temperature 1 | 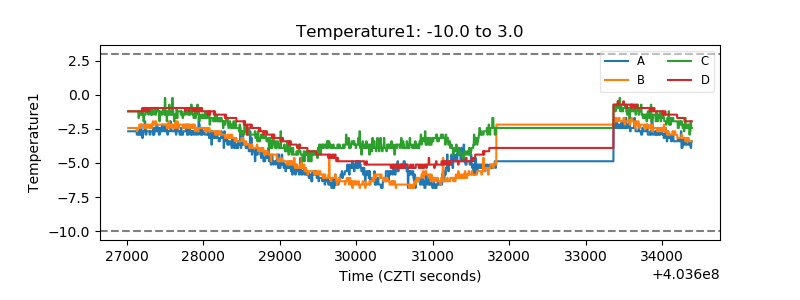 |
| Veto HV Monitor | 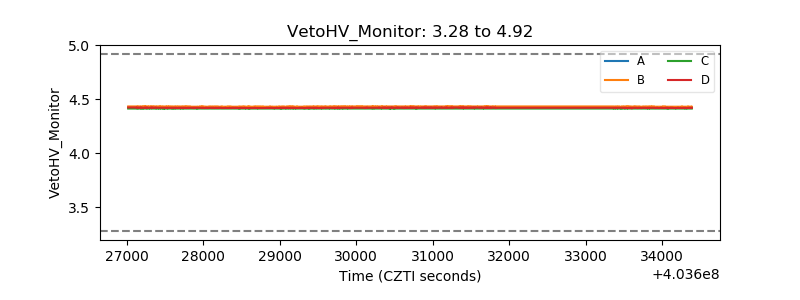 |
| Veto LLD | 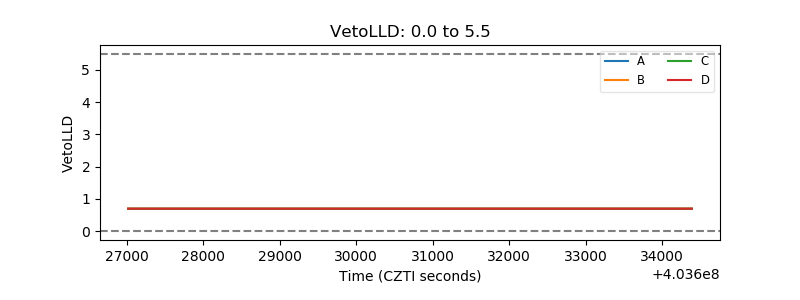 |
| Alpha Counter | 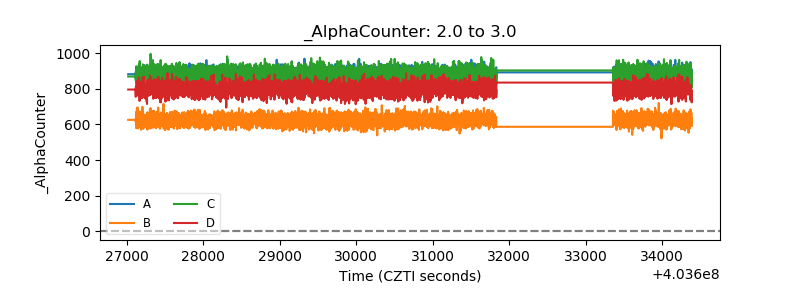 |
| _CPM_Rate | 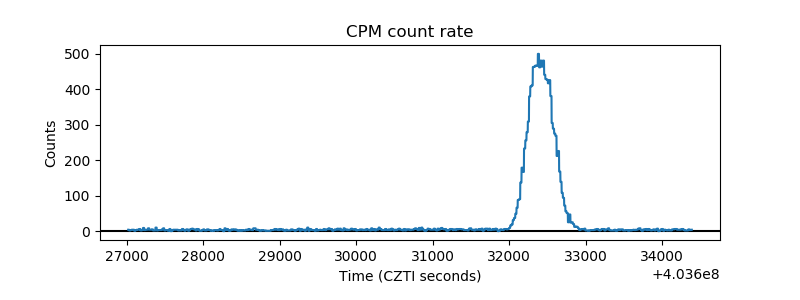 |
| CZT Counter | 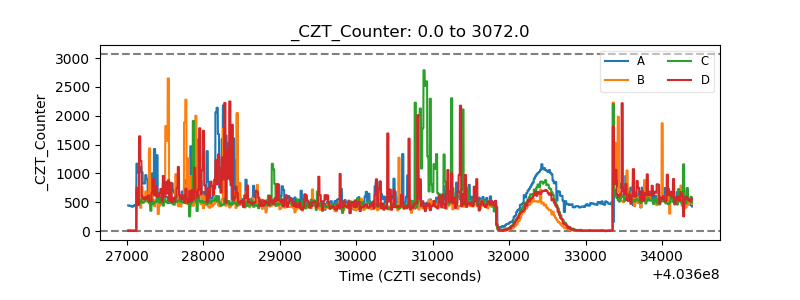 |
| +2.5 Volts monitor | 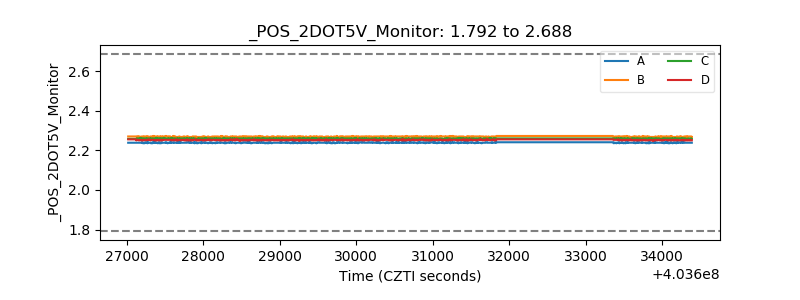 |
| +5 Volts monitor | 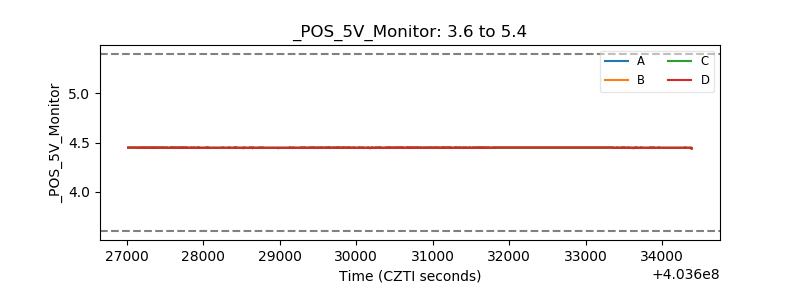 |
| _ROLL_ROT | 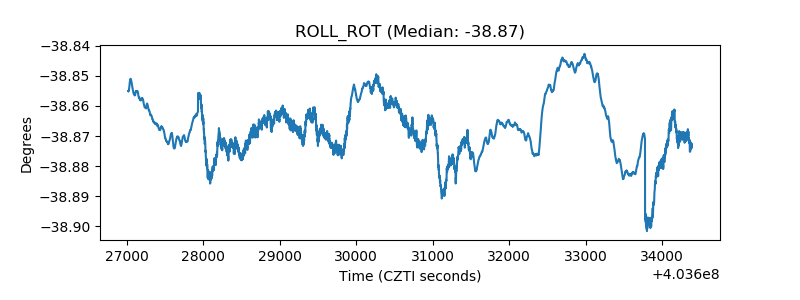 |
| _Roll_DEC | 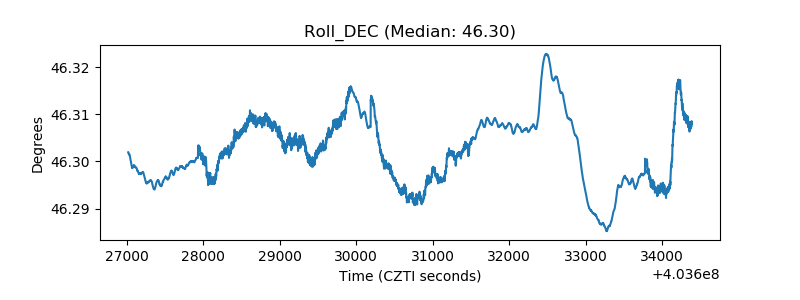 |
| _Roll_RA | 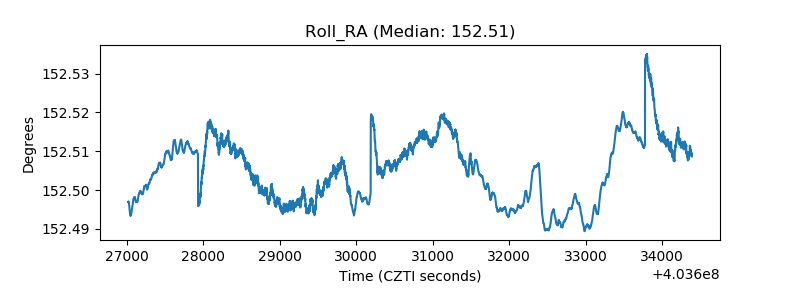 |
| Veto Counter | 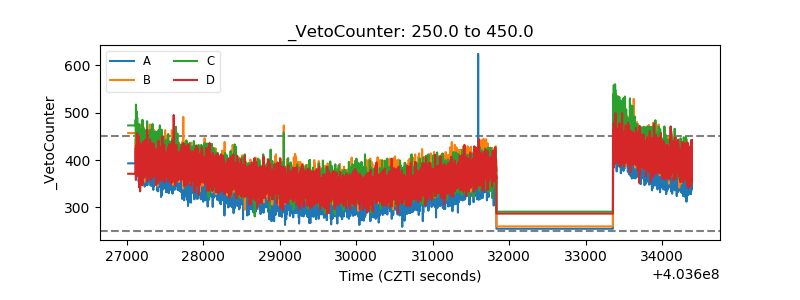 |