| Param | Original file | Final file |
|---|---|---|
| Filename | modeM0/AS1A11_065T21_9000005364_38124cztM0_level2.fits | modeM0/AS1A11_065T21_9000005364_38124cztM0_level2_quad_clean.evt |
| Size (bytes) | 153,938,880 | 39,533,760 |
| Size | 146.8 MB | 37.7 MB |
| Events in quadrant A | 1,747,118 | 264,419 |
| Events in quadrant B | 1,240,846 | 268,471 |
| Events in quadrant C | 1,147,816 | 258,104 |
| Events in quadrant D | 1,380,747 | 239,806 |
| Mode M9 | |||
|---|---|---|---|
| Quadrant | BADHDUFLAG | Total packets | Discarded packets |
| A | 0 | 2 | 0 |
| B | 0 | 2 | 0 |
| C | 0 | 2 | 0 |
| D | 0 | 3 | 0 |
| Mode M0 | |||
|---|---|---|---|
| Quadrant | BADHDUFLAG | Total packets | Discarded packets |
| A | 0 | 6755 | 10 |
| B | 0 | 5190 | 1 |
| C | 0 | 4764 | 5 |
| D | 0 | 5645 | 9 |
| Mode SS | |||
|---|---|---|---|
| Quadrant | BADHDUFLAG | Total packets | Discarded packets |
| A | 0 | 46 | 0 |
| B | 0 | 46 | 0 |
| C | 0 | 46 | 0 |
| D | 0 | 46 | 0 |
| Quadrant | Total seconds | Saturated seconds | Saturation percentage |
|---|---|---|---|
| A | 2309 | 54 | 2.338675% |
| B | 2311 | 16 | 0.692341% |
| C | 2308 | 5 | 0.216638% |
| D | 2307 | 15 | 0.650195% |
Noise dominated data is calculated using 1-second bins in cleaned event files. If a bin has >2000 counts, and if more than 50% of those come from <1% of pixels, then it is considered to be noise-dominated and hence unusable.
| Quadrant | # 1 sec bins | Bins with >0 counts | Bins with >2000 counts | High rate bins dominated by noise | Noise dominated (total time) | Noise dominated (detector-on time) | Marked lightcurve |
|---|---|---|---|---|---|---|---|
| A | 2311 | 2311 | 39 | 39 | 1.69% | 1.69% | 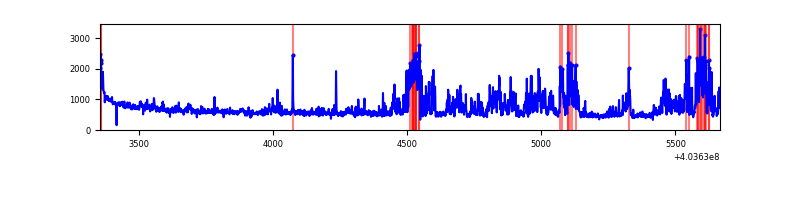 |
| B | 2311 | 2311 | 4 | 4 | 0.17% | 0.17% | 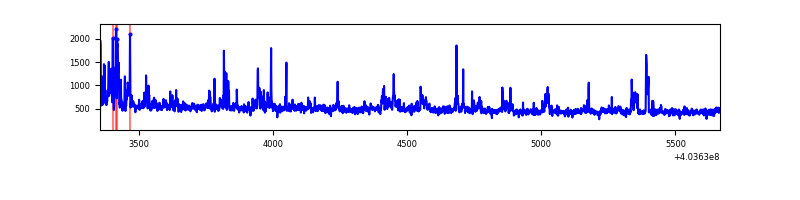 |
| C | 2311 | 2310 | 1 | 1 | 0.04% | 0.04% | 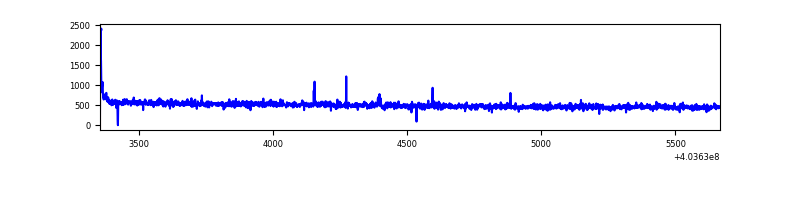 |
| D | 2311 | 2309 | 13 | 13 | 0.56% | 0.56% | 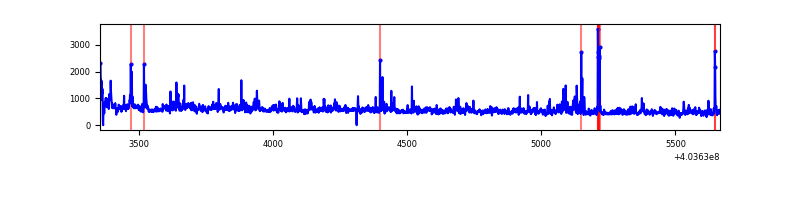 |
Top three noisy pixels from each quadrant. If the there are fewer than three noisy pixels in the level2.evt file, extra rows are filled as -1
| Pixel properties | Quadrant properties | ||||||
|---|---|---|---|---|---|---|---|
| Quadrant | DetID | PixID | Counts | Sigma | Mean | Median | Sigma |
| A | 12 | 16 | 374135 | 6716.78 | 264 | 258 | 55.7 |
| A | 10 | 83 | 180142 | 3231.65 | 264 | 258 | 55.7 |
| A | 7 | 16 | 82862 | 1484.0 | 264 | 258 | 55.7 |
| B | 0 | 229 | 112934 | 2145.48 | 263 | 256 | 52.5 |
| B | 5 | 172 | 47892 | 907.03 | 263 | 256 | 52.5 |
| B | 4 | 21 | 33666 | 636.15 | 263 | 256 | 52.5 |
| C | 15 | 214 | 97383 | 1539.81 | 263 | 264 | 63.1 |
| C | 0 | 10 | 8506 | 130.68 | 263 | 264 | 63.1 |
| C | 3 | 233 | 6595 | 100.38 | 263 | 264 | 63.1 |
| D | 1 | 52 | 105633 | 1633.78 | 263 | 256 | 64.5 |
| D | 0 | 137 | 58980 | 910.46 | 263 | 256 | 64.5 |
| D | 2 | 249 | 40451 | 623.19 | 263 | 256 | 64.5 |
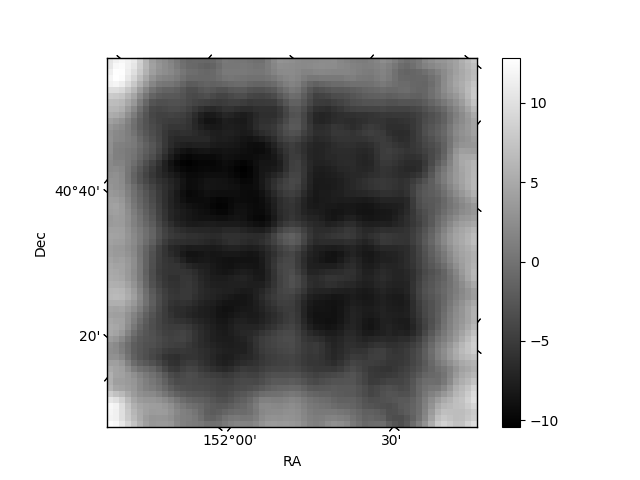
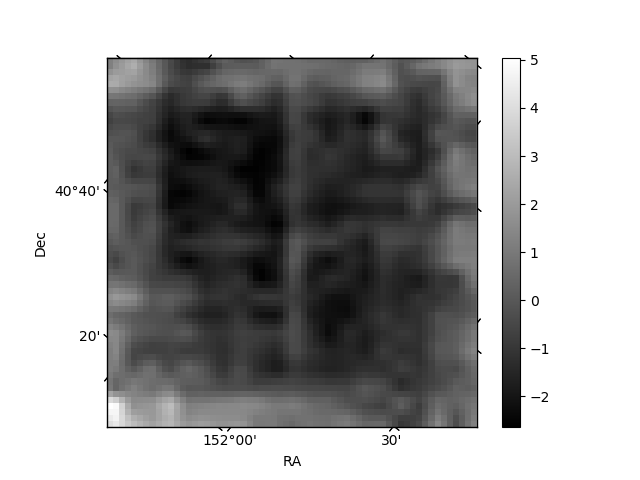
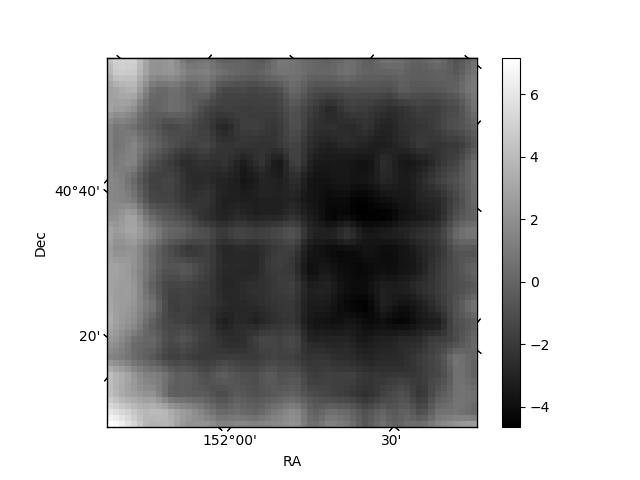
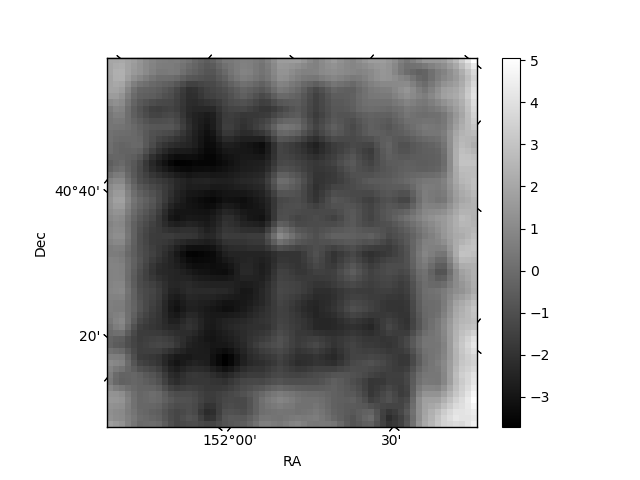
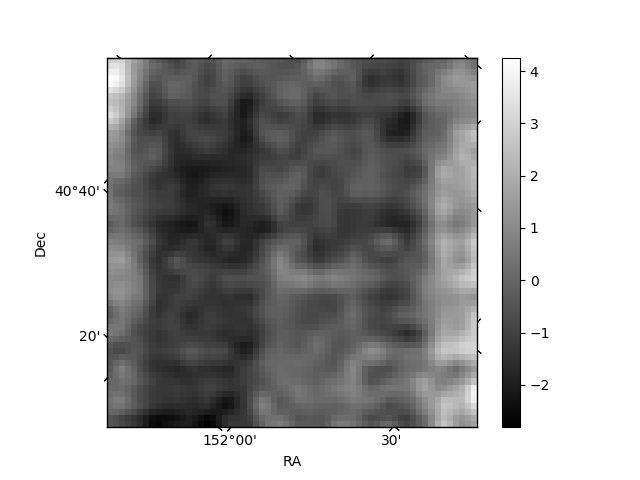
Histogram calculated using DETX and DETY for each event in the final _common_clean file
| Quadrant A | 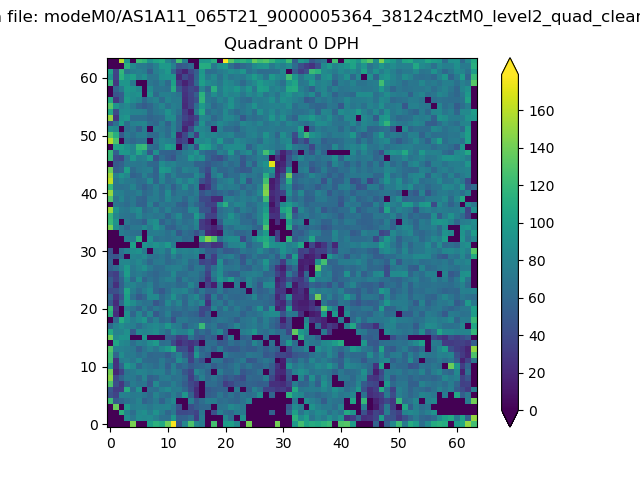 |
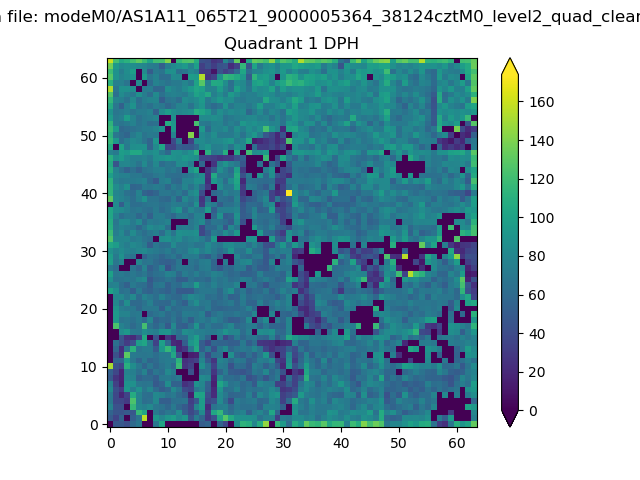 |
Quadrant B |
|---|---|---|---|
| Quadrant D | 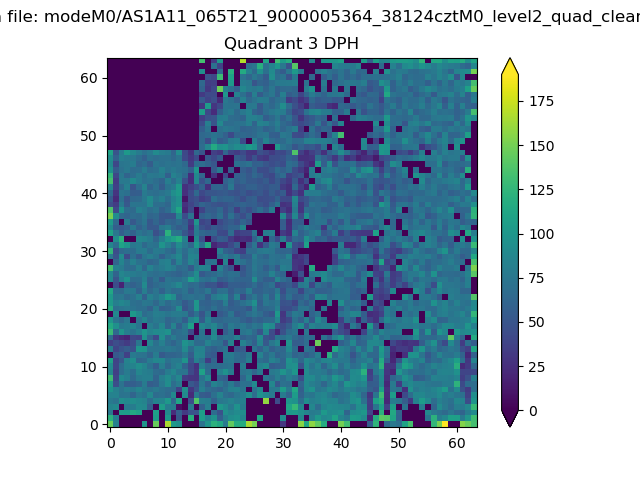 |
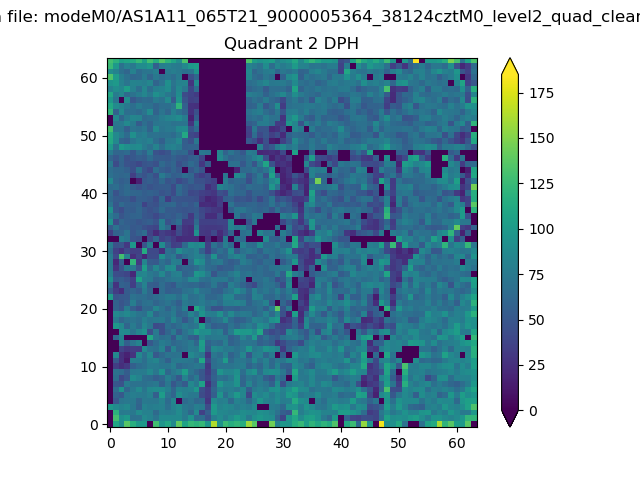 |
Quadrant C |
| Plot type | Count rate plots | Images |
|---|---|---|
| Comparison with Poisson distribution Blue bars denote a histogram of data divided into 1 sec bins. Red curve is a Poisson curve with rate = median count rate of data. |
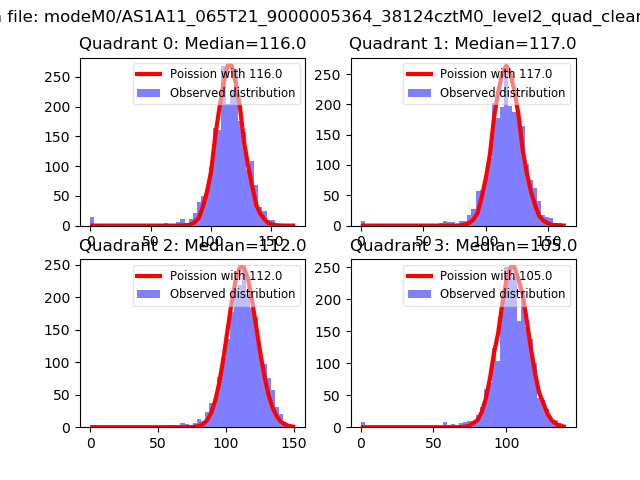 |
 |
| Quadrant-wise count rates Data is divided into 100 sec bins |
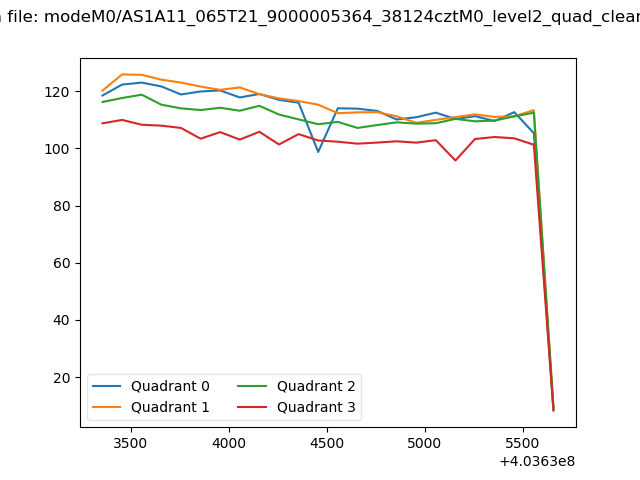 |
|
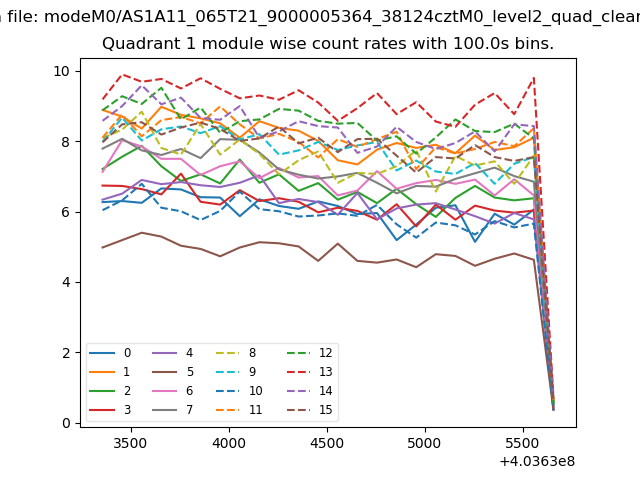
| Module-wise count rates for Quadrant A Data is divided into 100 sec bins |
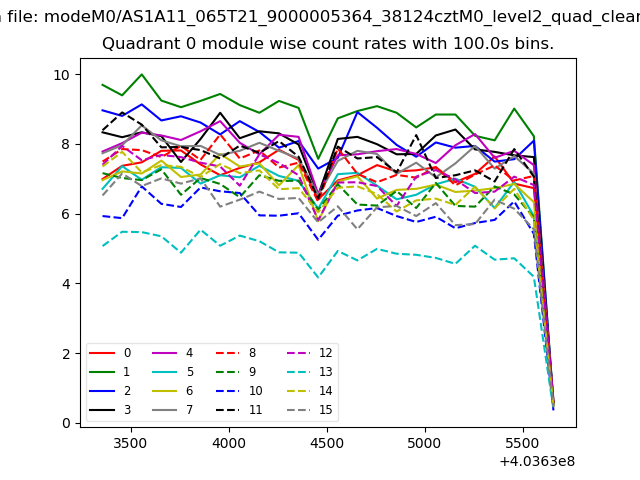 |
 |
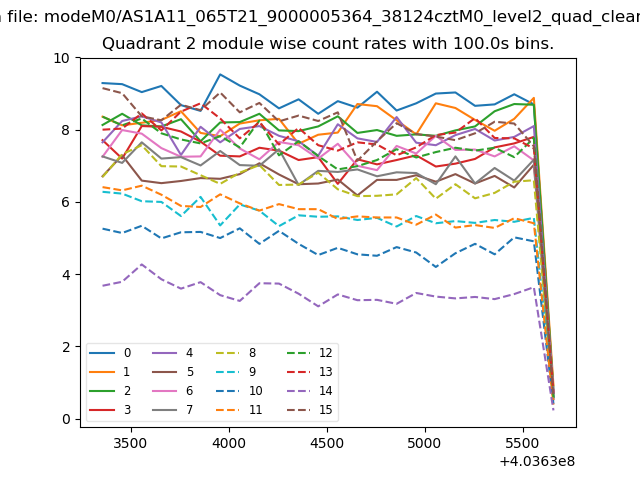
| Module-wise count rates for Quadrant B Data is divided into 100 sec bins |
 |
 |
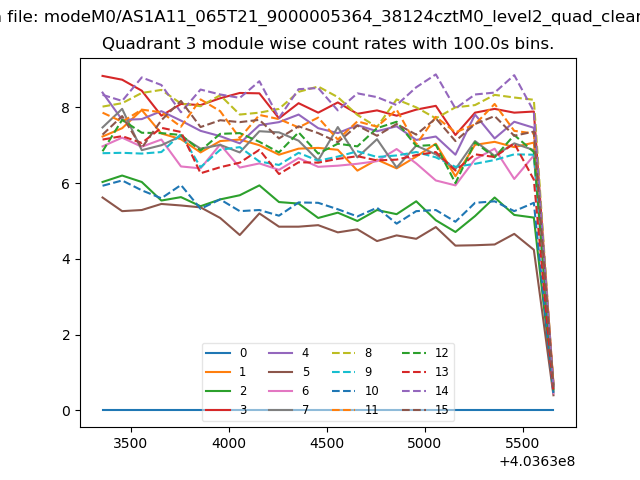
| Module-wise count rates for Quadrant C Data is divided into 100 sec bins |
 |
 |
| Module-wise count rates for Quadrant D Data is divided into 100 sec bins |
 |
 |
| Parameter | Plot |
|---|---|
| CZT HV Monitor | 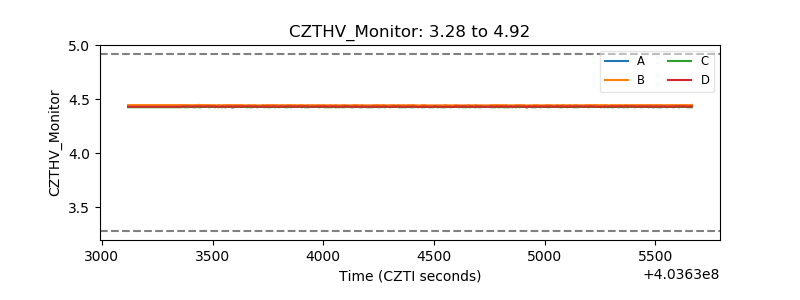 |
| D_VDD | 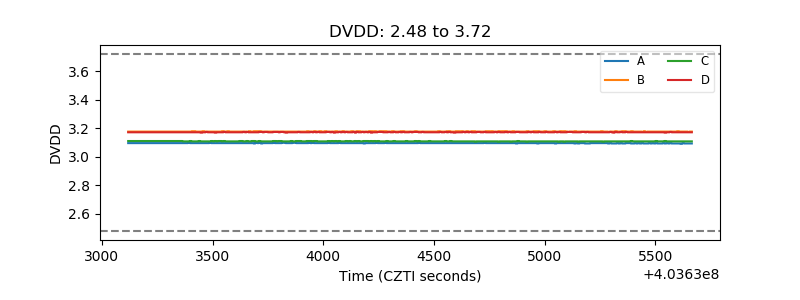 |
| Temperature 1 | 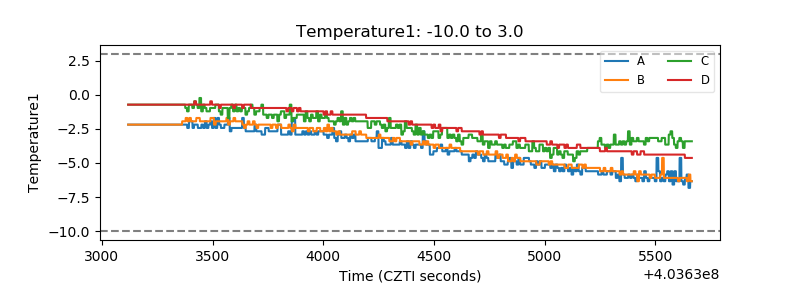 |
| Veto HV Monitor | 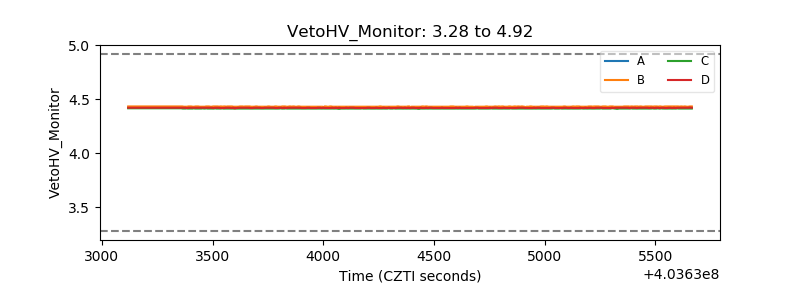 |
| Veto LLD | 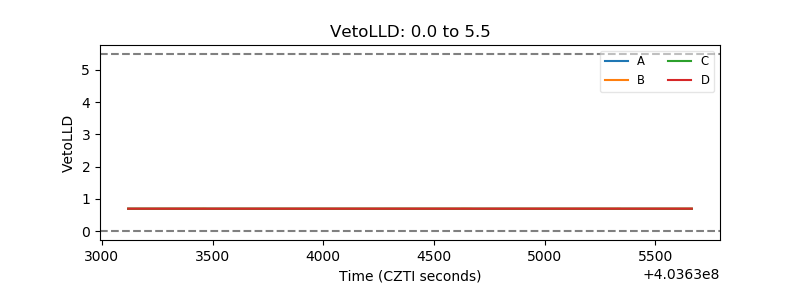 |
| Alpha Counter | 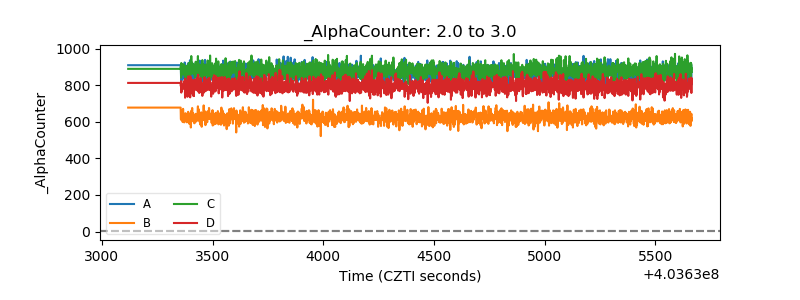 |
| _CPM_Rate | 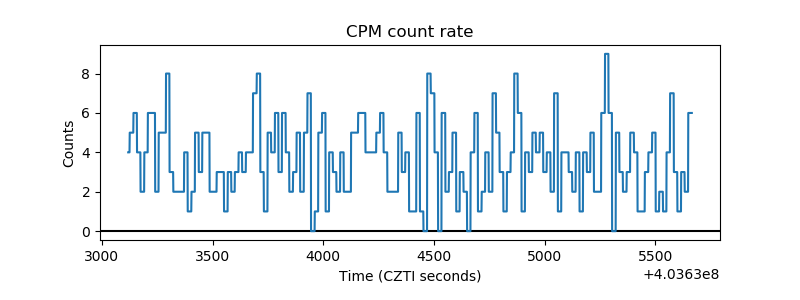 |
| CZT Counter | 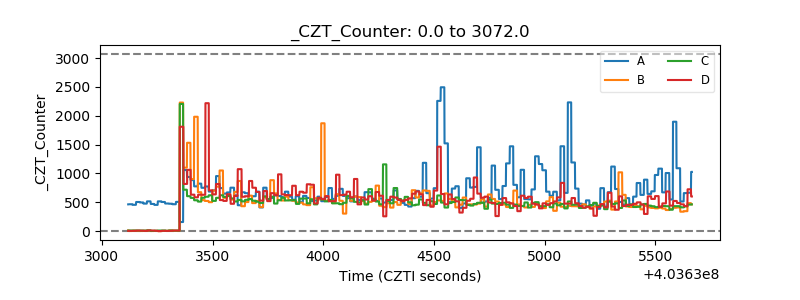 |
| +2.5 Volts monitor | 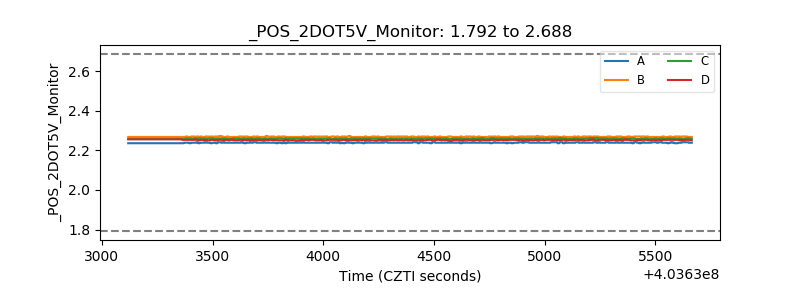 |
| +5 Volts monitor | 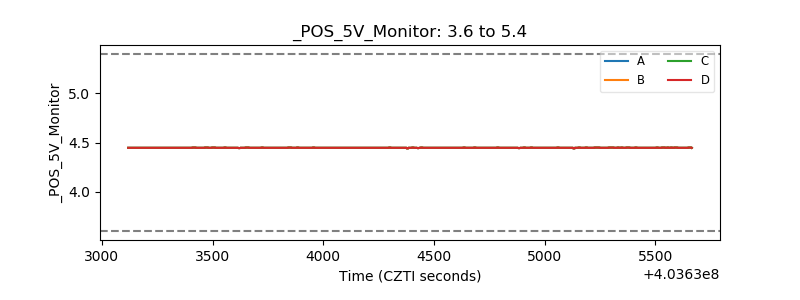 |
| _ROLL_ROT | 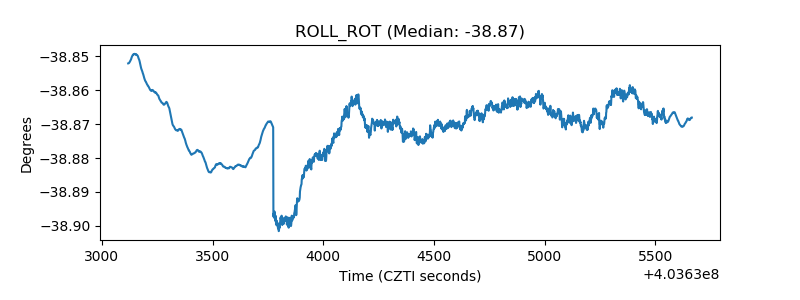 |
| _Roll_DEC | 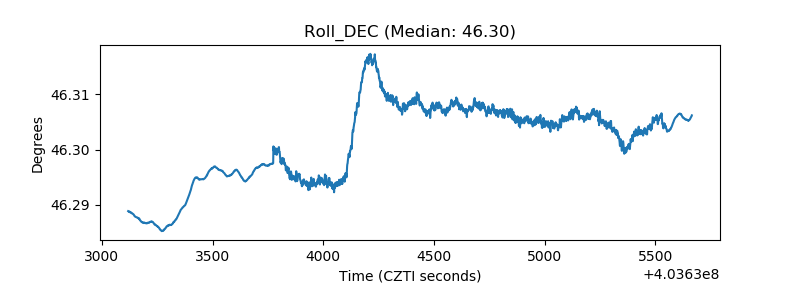 |
| _Roll_RA | 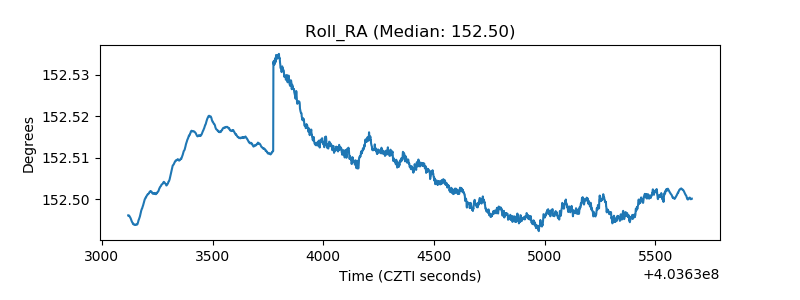 |
| Veto Counter | 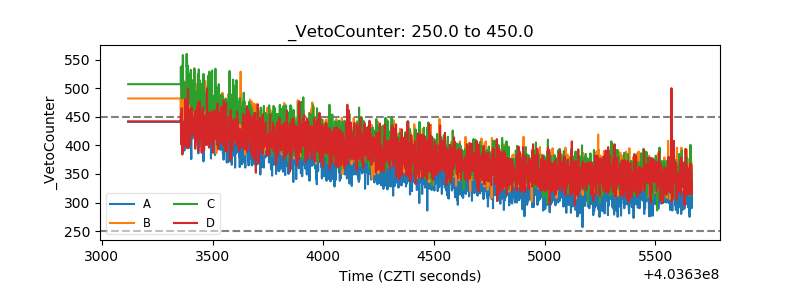 |