| Param | Original file | Final file |
|---|---|---|
| Filename | modeM0/AS1C07_001T12_9000005366cztM0_level2.fits | modeM0/AS1C07_001T12_9000005366cztM0_level2_quad_clean.evt |
| Size (bytes) | 826,453,440 | 1,250,642,880 |
| Size | 788.2 MB | 1.2 GB |
| Events in quadrant A | 4,964,952 | 8,290,795 |
| Events in quadrant B | 4,809,204 | 8,303,248 |
| Events in quadrant C | 4,899,252 | 7,941,707 |
| Events in quadrant D | 4,204,778 | 7,195,917 |
| Mode M0 | |||
|---|---|---|---|
| Quadrant | BADHDUFLAG | Total packets | Discarded packets |
| A | 0 | 201046 | 0 |
| B | 0 | 192386 | 0 |
| C | 0 | 187967 | 0 |
| D | 0 | 212939 | 0 |
| Mode M9 | |||
|---|---|---|---|
| Quadrant | BADHDUFLAG | Total packets | Discarded packets |
| A | 0 | 359 | 0 |
| B | 0 | 359 | 0 |
| C | 0 | 359 | 0 |
| D | 0 | 359 | 0 |
| Mode SS | |||
|---|---|---|---|
| Quadrant | BADHDUFLAG | Total packets | Discarded packets |
| A | 0 | 1836 | 0 |
| B | 0 | 1836 | 0 |
| C | 0 | 1836 | 0 |
| D | 0 | 1836 | 0 |
| Quadrant | Total seconds | Saturated seconds | Saturation percentage |
|---|---|---|---|
| A | 89732 | 313 | 0.348816% |
| B | 89727 | 782 | 0.871533% |
| C | 89732 | 336 | 0.374448% |
| D | 89732 | 1581 | 1.761913% |
Noise dominated data is calculated using 1-second bins in cleaned event files. If a bin has >2000 counts, and if more than 50% of those come from <1% of pixels, then it is considered to be noise-dominated and hence unusable.
| Quadrant | # 1 sec bins | Bins with >0 counts | Bins with >2000 counts | High rate bins dominated by noise | Noise dominated (total time) | Noise dominated (detector-on time) | Marked lightcurve |
|---|---|---|---|---|---|---|---|
| A | 125624 | 89733 | 0 | 0 | 0.00% | 0.00% |  |
| B | 125624 | 89725 | 0 | 0 | 0.00% | 0.00% |  |
| C | 125624 | 89725 | 0 | 0 | 0.00% | 0.00% |  |
| D | 125624 | 89678 | 0 | 0 | 0.00% | 0.00% |  |
Top three noisy pixels from each quadrant. If the there are fewer than three noisy pixels in the level2.evt file, extra rows are filled as -1
| Pixel properties | Quadrant properties | ||||||
|---|---|---|---|---|---|---|---|
| Quadrant | DetID | PixID | Counts | Sigma | Mean | Median | Sigma |
| A | 7 | 110 | 4188 | 9.17 | 1299 | 1226 | 322.9 |
| A | 9 | 19 | 4097 | 8.89 | 1299 | 1226 | 322.9 |
| A | 0 | 29 | 4005 | 8.61 | 1299 | 1226 | 322.9 |
| B | 2 | 9 | 4066 | 11.52 | 1274 | 1220 | 247.1 |
| B | 3 | 80 | 3725 | 10.14 | 1274 | 1220 | 247.1 |
| B | 5 | 255 | 3472 | 9.11 | 1274 | 1220 | 247.1 |
| C | 1 | 81 | 4150 | 8.85 | 1296 | 1224 | 330.8 |
| C | 1 | 80 | 4045 | 8.53 | 1296 | 1224 | 330.8 |
| C | 3 | 202 | 3911 | 8.12 | 1296 | 1224 | 330.8 |
| D | 7 | 3 | 3122 | 6.19 | 1208 | 1101 | 326.4 |
| D | 6 | 62 | 3060 | 6.0 | 1208 | 1101 | 326.4 |
| D | 10 | 189 | 3057 | 5.99 | 1208 | 1101 | 326.4 |
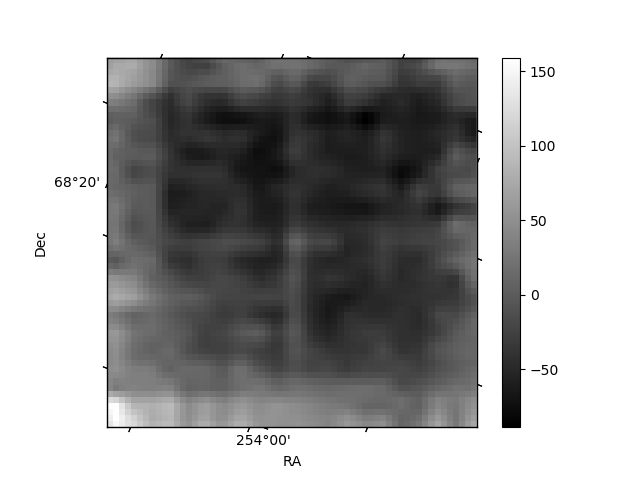
Histogram calculated using DETX and DETY for each event in the final _common_clean file
| Quadrant A | 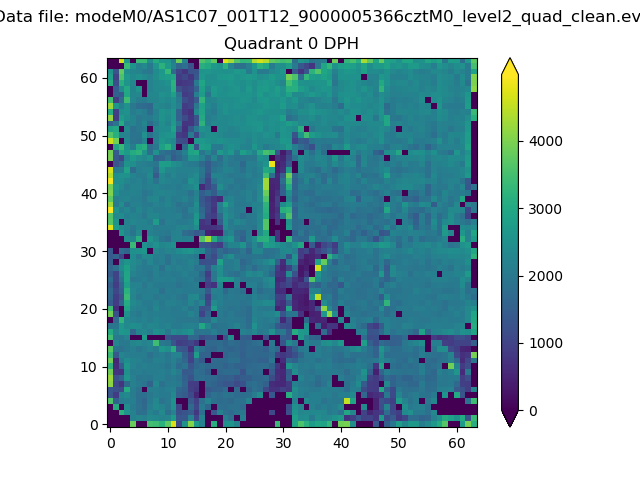 |
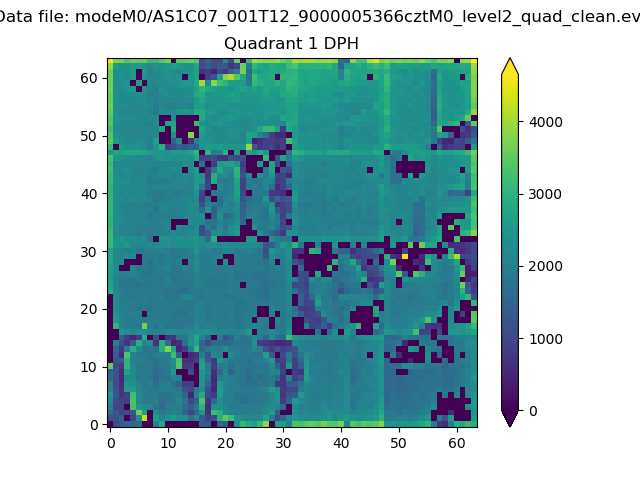 |
Quadrant B |
|---|---|---|---|
| Quadrant D | 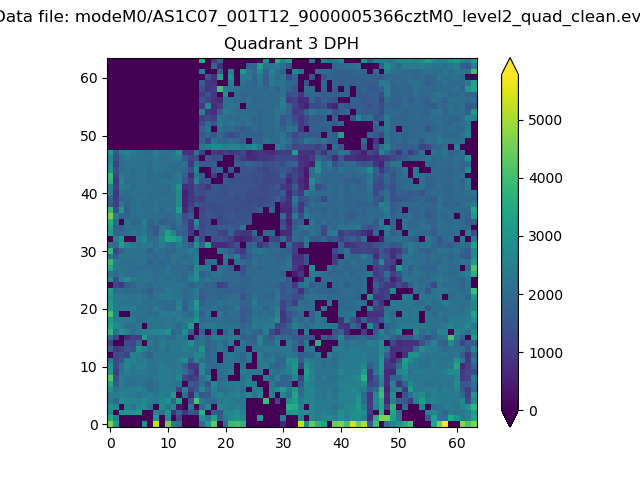 |
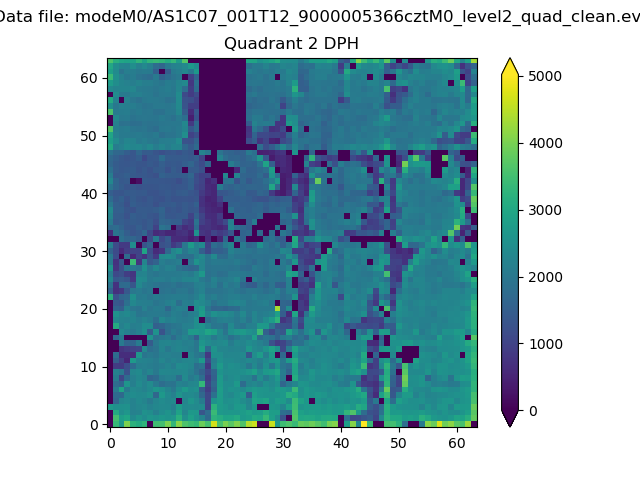 |
Quadrant C |
| Plot type | Count rate plots | Images |
|---|---|---|
| Comparison with Poisson distribution Blue bars denote a histogram of data divided into 1 sec bins. Red curve is a Poisson curve with rate = median count rate of data. |
 |
 |
| Quadrant-wise count rates Data is divided into 100 sec bins |
 |
|
| Module-wise count rates for Quadrant A Data is divided into 100 sec bins |
 |
 |
| Module-wise count rates for Quadrant B Data is divided into 100 sec bins |
 |
 |
| Module-wise count rates for Quadrant C Data is divided into 100 sec bins |
 |
 |
| Module-wise count rates for Quadrant D Data is divided into 100 sec bins |
 |
 |
| Parameter | Plot |
|---|---|
| CZT HV Monitor |  |
| D_VDD |  |
| Temperature 1 |  |
| Veto HV Monitor |  |
| Veto LLD |  |
| Alpha Counter |  |
| _CPM_Rate |  |
| CZT Counter |  |
| +2.5 Volts monitor |  |
| +5 Volts monitor |  |
| _ROLL_ROT |  |
| _Roll_DEC |  |
| _Roll_RA |  |
| Veto Counter |  |