| Param | Original file | Final file |
|---|---|---|
| Filename | modeM0/AS1C07_001T12_9000005366_38124cztM0_level2.fits | modeM0/AS1C07_001T12_9000005366_38124cztM0_level2_quad_clean.evt |
| Size (bytes) | 171,198,720 | 44,743,680 |
| Size | 163.3 MB | 42.7 MB |
| Events in quadrant A | 1,467,354 | 304,111 |
| Events in quadrant B | 1,448,716 | 305,796 |
| Events in quadrant C | 1,324,602 | 297,542 |
| Events in quadrant D | 1,895,434 | 264,219 |
| Mode M0 | |||
|---|---|---|---|
| Quadrant | BADHDUFLAG | Total packets | Discarded packets |
| A | 0 | 5970 | 2 |
| B | 0 | 5973 | 8 |
| C | 0 | 5500 | 1 |
| D | 0 | 7358 | 1 |
| Mode M9 | |||
|---|---|---|---|
| Quadrant | BADHDUFLAG | Total packets | Discarded packets |
| A | 0 | 17 | 0 |
| B | 0 | 17 | 0 |
| C | 0 | 17 | 0 |
| D | 0 | 17 | 0 |
| Mode SS | |||
|---|---|---|---|
| Quadrant | BADHDUFLAG | Total packets | Discarded packets |
| A | 0 | 52 | 0 |
| B | 0 | 52 | 0 |
| C | 0 | 52 | 0 |
| D | 0 | 52 | 0 |
| Quadrant | Total seconds | Saturated seconds | Saturation percentage |
|---|---|---|---|
| A | 2560 | 10 | 0.390625% |
| B | 2555 | 60 | 2.348337% |
| C | 2560 | 8 | 0.312500% |
| D | 2560 | 125 | 4.882812% |
Noise dominated data is calculated using 1-second bins in cleaned event files. If a bin has >2000 counts, and if more than 50% of those come from <1% of pixels, then it is considered to be noise-dominated and hence unusable.
| Quadrant | # 1 sec bins | Bins with >0 counts | Bins with >2000 counts | High rate bins dominated by noise | Noise dominated (total time) | Noise dominated (detector-on time) | Marked lightcurve |
|---|---|---|---|---|---|---|---|
| A | 4203 | 2561 | 4 | 4 | 0.10% | 0.16% | 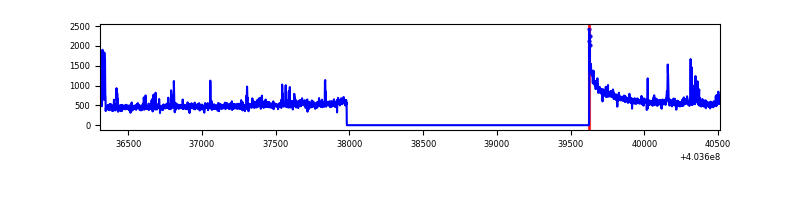 |
| B | 4203 | 2559 | 38 | 38 | 0.90% | 1.48% | 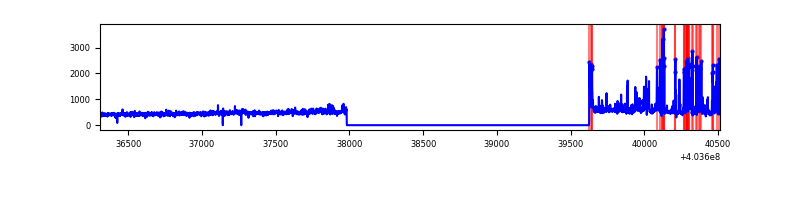 |
| C | 4203 | 2561 | 4 | 4 | 0.10% | 0.16% | 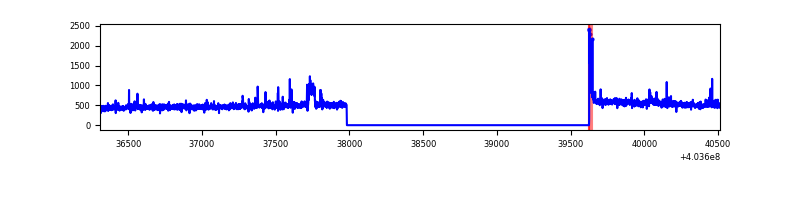 |
| D | 4203 | 2561 | 116 | 116 | 2.76% | 4.53% | 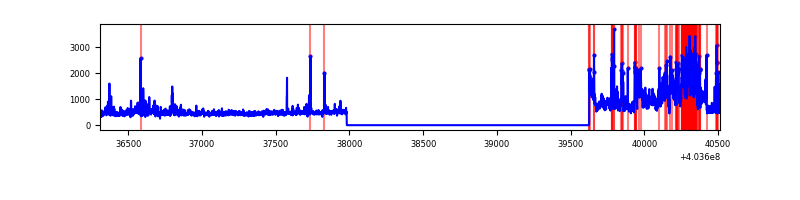 |
Top three noisy pixels from each quadrant. If the there are fewer than three noisy pixels in the level2.evt file, extra rows are filled as -1
| Pixel properties | Quadrant properties | ||||||
|---|---|---|---|---|---|---|---|
| Quadrant | DetID | PixID | Counts | Sigma | Mean | Median | Sigma |
| A | 10 | 83 | 183847 | 2963.08 | 299 | 293 | 61.9 |
| A | 12 | 16 | 35822 | 573.54 | 299 | 293 | 61.9 |
| A | 12 | 189 | 33857 | 541.82 | 299 | 293 | 61.9 |
| B | 4 | 81 | 112022 | 1923.5 | 295 | 287 | 58.1 |
| B | 5 | 172 | 76954 | 1319.81 | 295 | 287 | 58.1 |
| B | 0 | 229 | 60551 | 1037.43 | 295 | 287 | 58.1 |
| C | 15 | 214 | 106827 | 1548.13 | 291 | 293 | 68.8 |
| C | 5 | 250 | 39326 | 567.22 | 291 | 293 | 68.8 |
| C | 0 | 10 | 17175 | 245.33 | 291 | 293 | 68.8 |
| D | 10 | 40 | 479712 | 6765.46 | 286 | 277 | 70.9 |
| D | 1 | 52 | 68749 | 966.23 | 286 | 277 | 70.9 |
| D | 13 | 249 | 48040 | 674.0 | 286 | 277 | 70.9 |
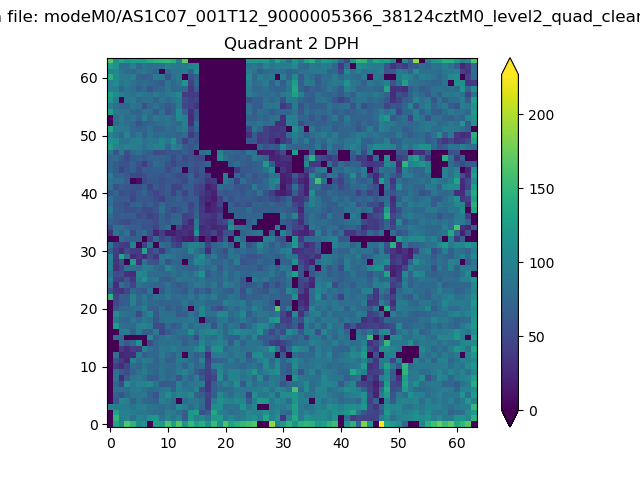
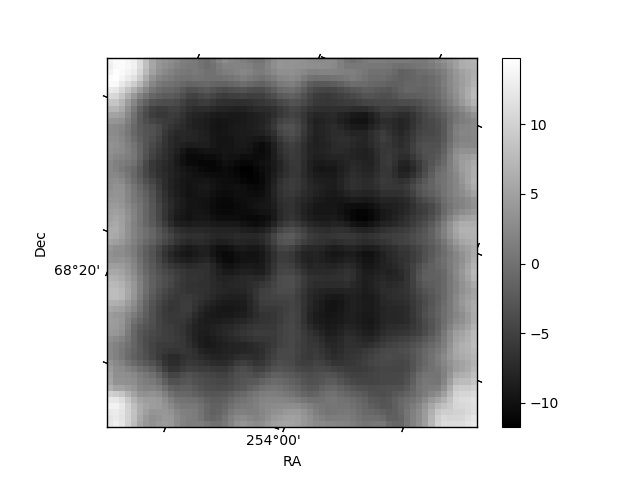
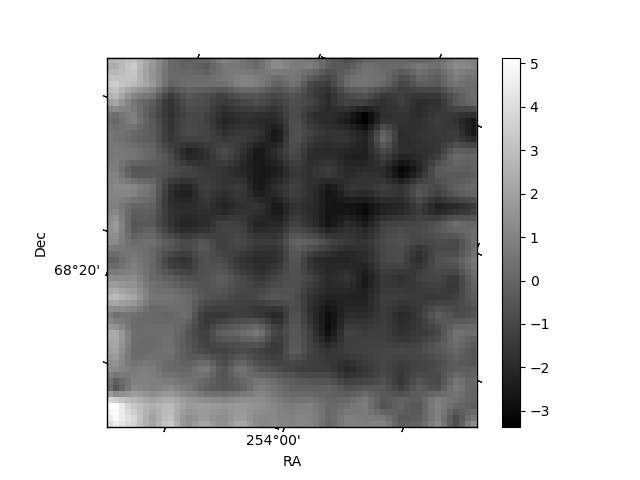
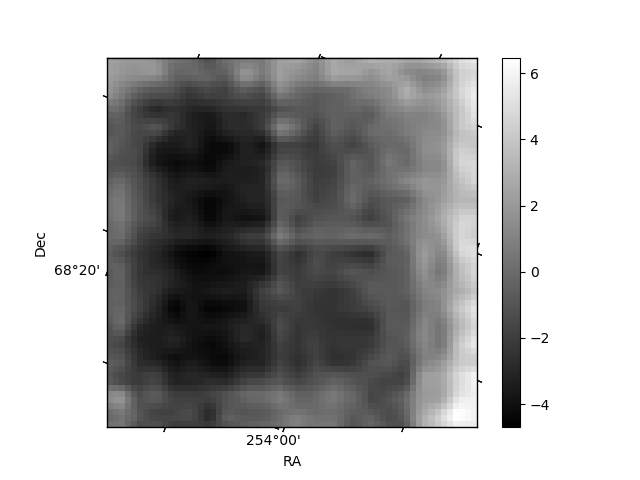
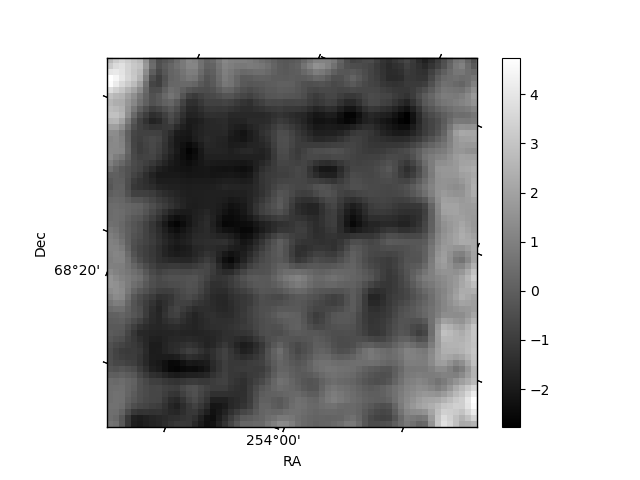
Histogram calculated using DETX and DETY for each event in the final _common_clean file
| Quadrant A | 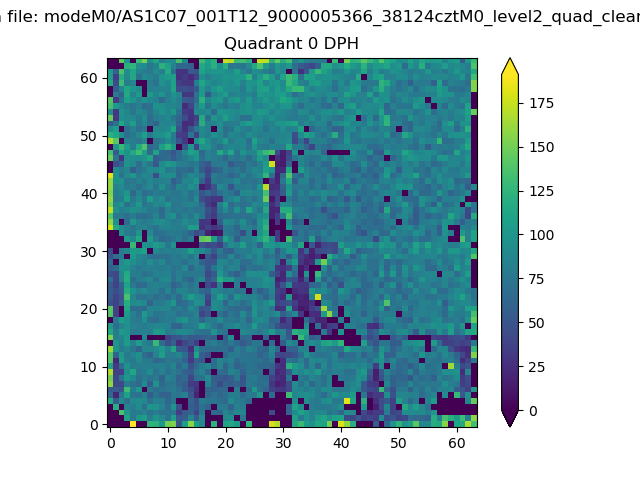 |
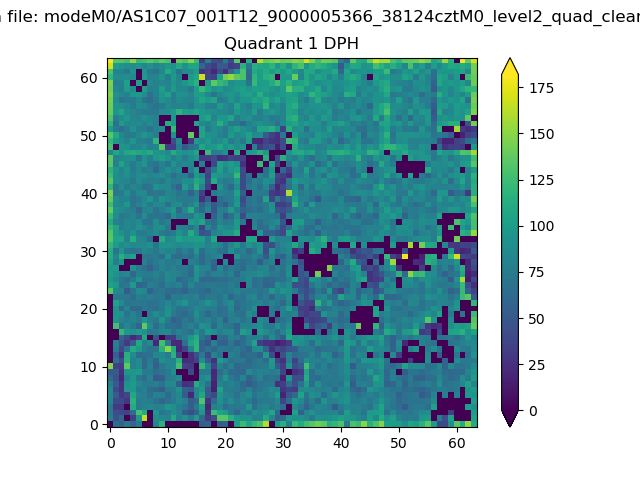 |
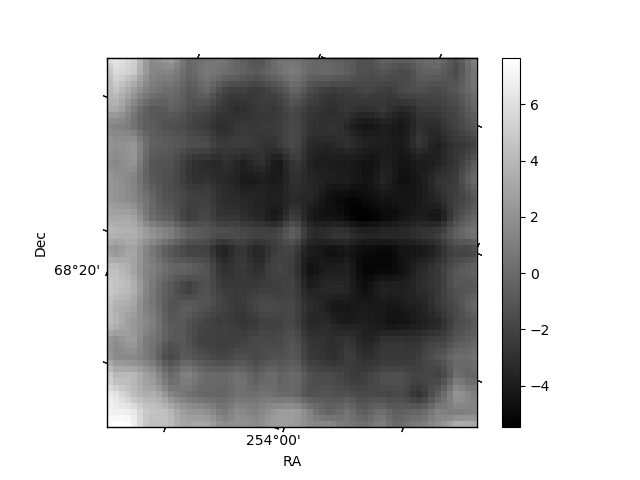
Quadrant B |
|---|---|---|---|
| Quadrant D | 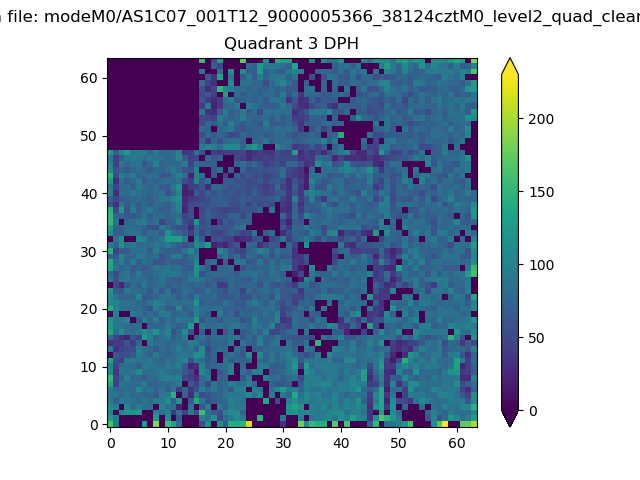 |
 |
Quadrant C |
| Plot type | Count rate plots | Images |
|---|---|---|
| Comparison with Poisson distribution Blue bars denote a histogram of data divided into 1 sec bins. Red curve is a Poisson curve with rate = median count rate of data. |
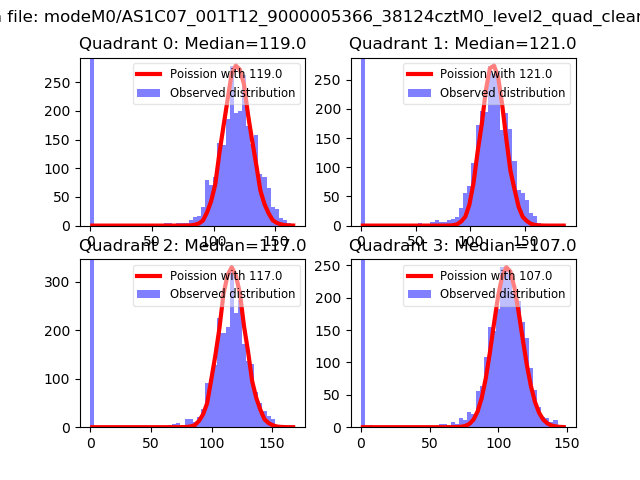 |
 |
| Quadrant-wise count rates Data is divided into 100 sec bins |
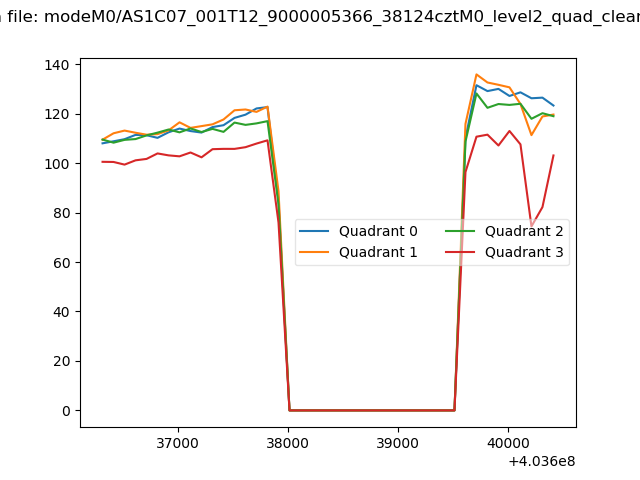 |
|
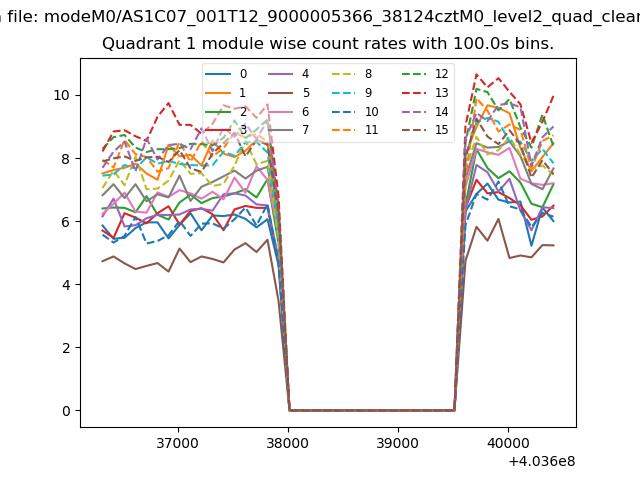
| Module-wise count rates for Quadrant A Data is divided into 100 sec bins |
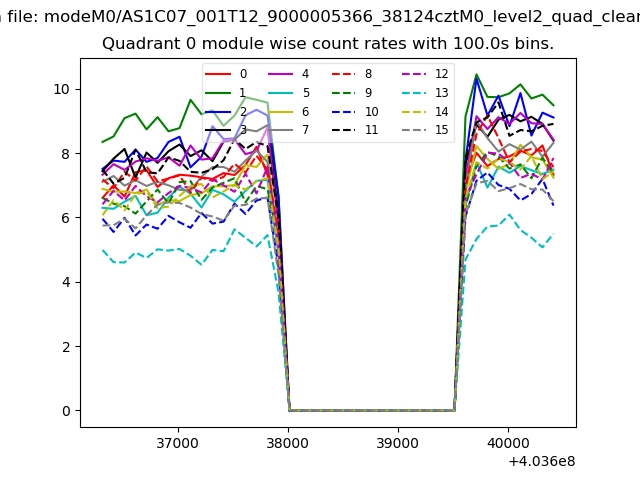 |
 |
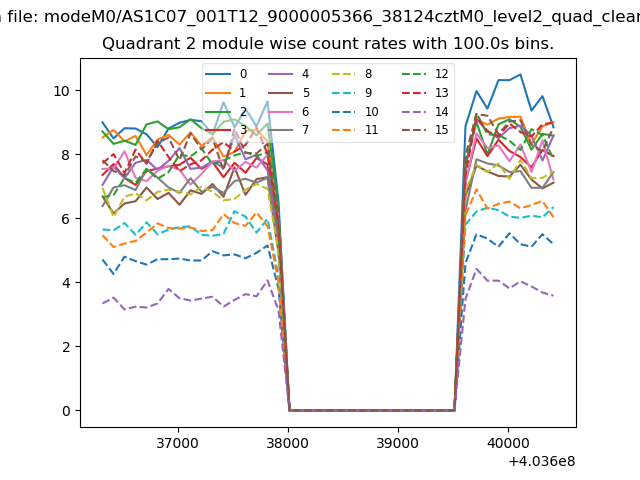
| Module-wise count rates for Quadrant B Data is divided into 100 sec bins |
 |
 |
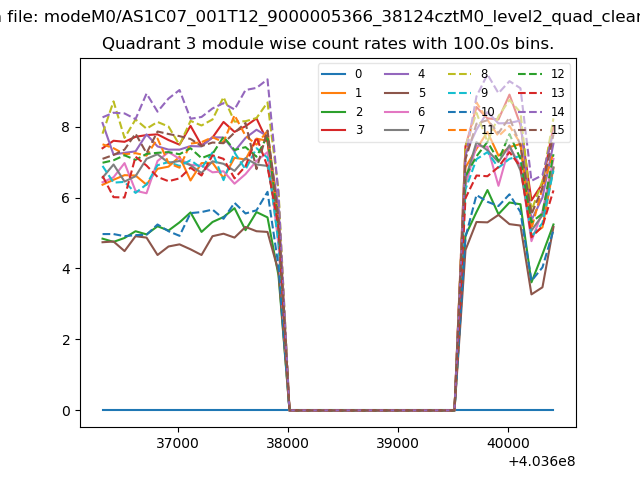
| Module-wise count rates for Quadrant C Data is divided into 100 sec bins |
 |
 |
| Module-wise count rates for Quadrant D Data is divided into 100 sec bins |
 |
 |
| Parameter | Plot |
|---|---|
| CZT HV Monitor | 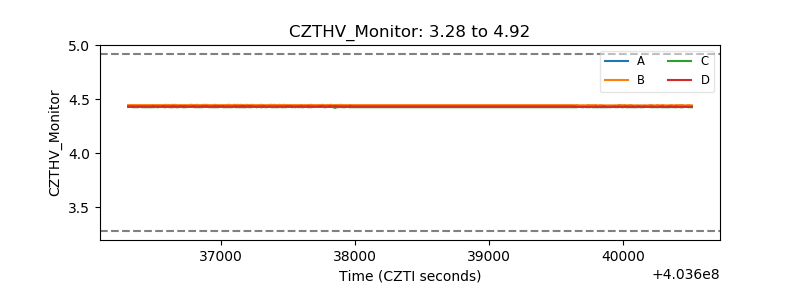 |
| D_VDD | 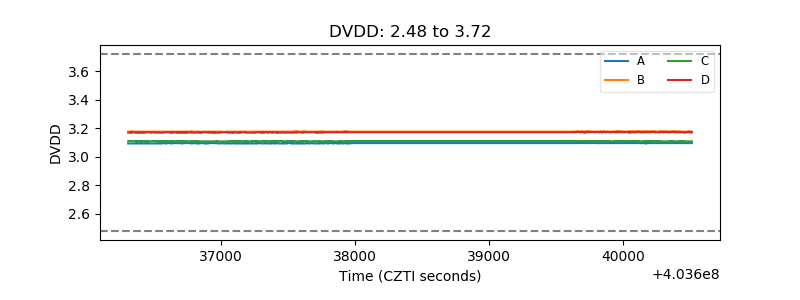 |
| Temperature 1 | 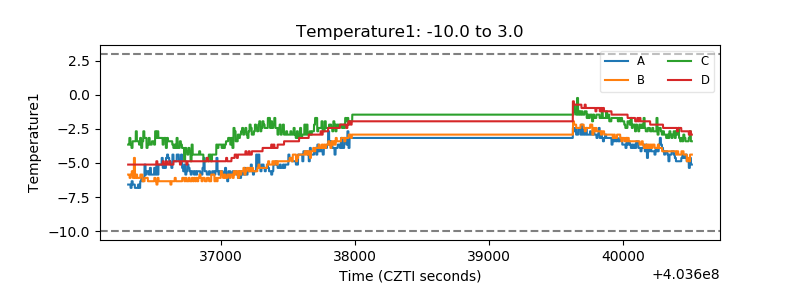 |
| Veto HV Monitor | 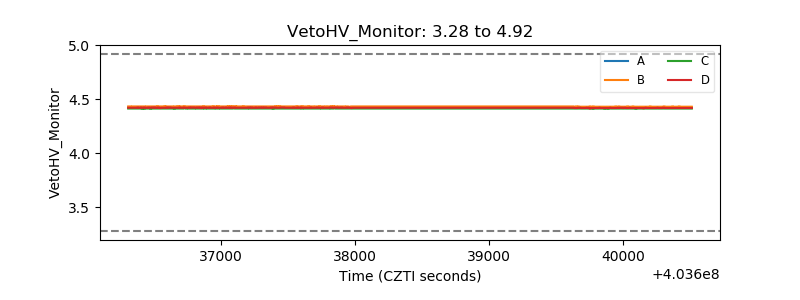 |
| Veto LLD | 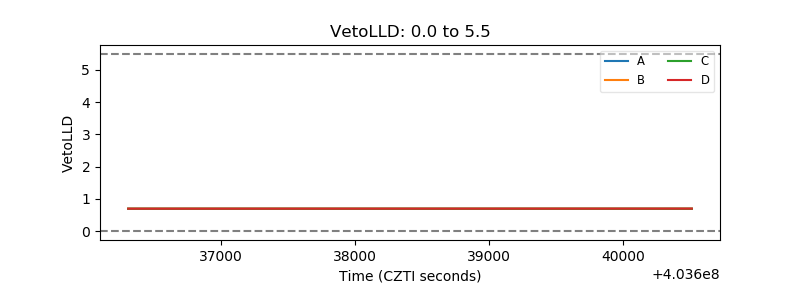 |
| Alpha Counter | 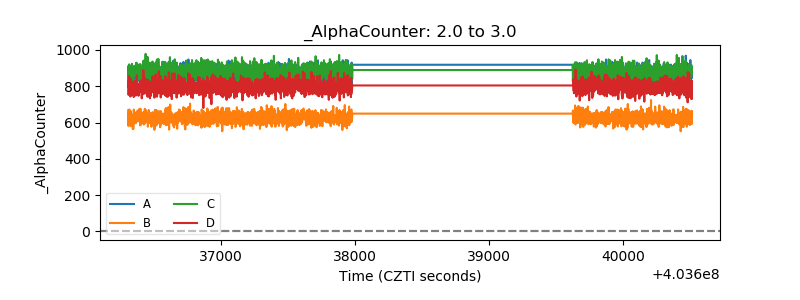 |
| _CPM_Rate | 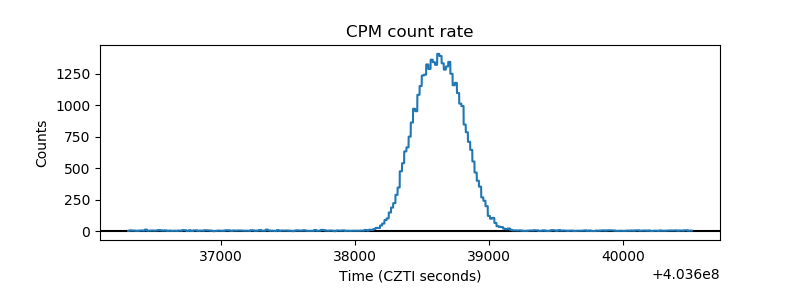 |
| CZT Counter | 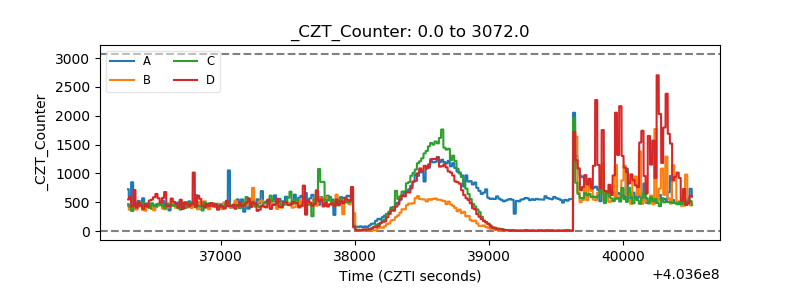 |
| +2.5 Volts monitor | 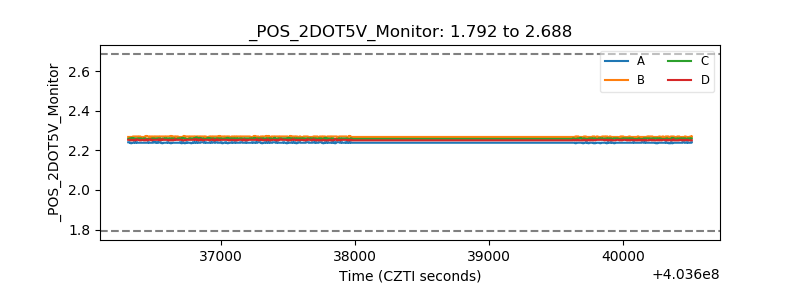 |
| +5 Volts monitor | 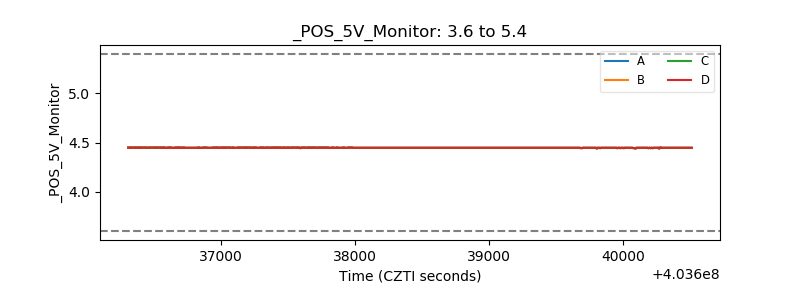 |
| _ROLL_ROT | 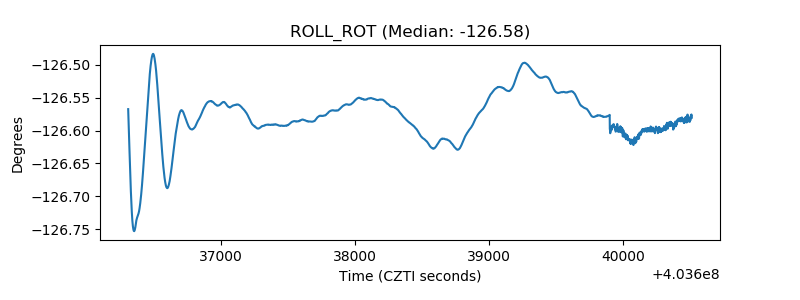 |
| _Roll_DEC | 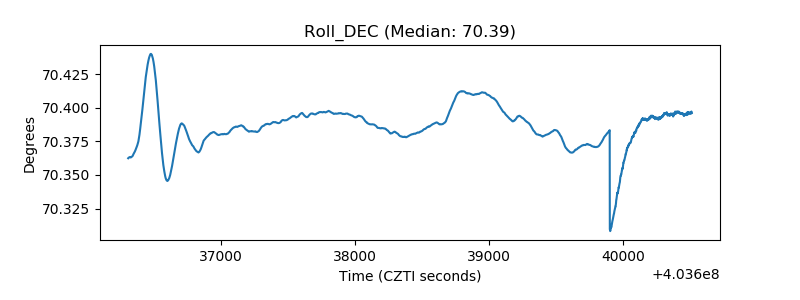 |
| _Roll_RA | 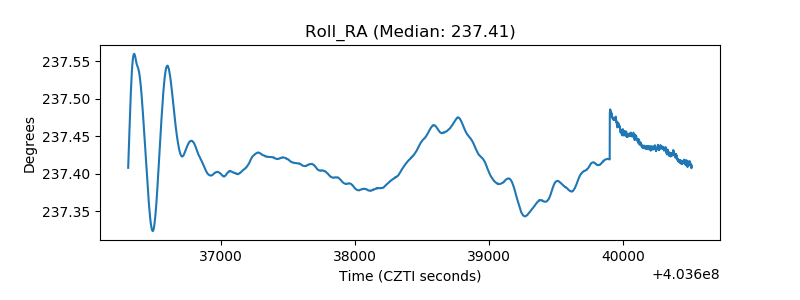 |
| Veto Counter | 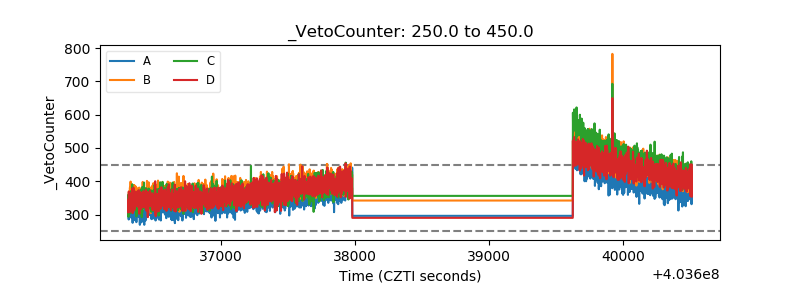 |