| Param | Original file | Final file |
|---|---|---|
| Filename | modeM0/AS1C07_001T12_9000005366_38126cztM0_level2.fits | modeM0/AS1C07_001T12_9000005366_38126cztM0_level2_quad_clean.evt |
| Size (bytes) | 352,356,480 | 93,614,400 |
| Size | 336.0 MB | 89.3 MB |
| Events in quadrant A | 3,314,455 | 632,979 |
| Events in quadrant B | 2,905,566 | 645,873 |
| Events in quadrant C | 2,729,940 | 625,115 |
| Events in quadrant D | 3,677,999 | 557,543 |
| Mode M0 | |||
|---|---|---|---|
| Quadrant | BADHDUFLAG | Total packets | Discarded packets |
| A | 0 | 13282 | 3 |
| B | 0 | 12339 | 2 |
| C | 0 | 11447 | 2 |
| D | 0 | 14707 | 2 |
| Mode M9 | |||
|---|---|---|---|
| Quadrant | BADHDUFLAG | Total packets | Discarded packets |
| A | 0 | 21 | 0 |
| B | 0 | 21 | 0 |
| C | 0 | 21 | 0 |
| D | 0 | 22 | 0 |
| Mode SS | |||
|---|---|---|---|
| Quadrant | BADHDUFLAG | Total packets | Discarded packets |
| A | 0 | 108 | 0 |
| B | 0 | 108 | 0 |
| C | 0 | 108 | 0 |
| D | 0 | 108 | 0 |
| Quadrant | Total seconds | Saturated seconds | Saturation percentage |
|---|---|---|---|
| A | 5332 | 71 | 1.331583% |
| B | 5332 | 99 | 1.856714% |
| C | 5332 | 35 | 0.656414% |
| D | 5332 | 237 | 4.444861% |
Noise dominated data is calculated using 1-second bins in cleaned event files. If a bin has >2000 counts, and if more than 50% of those come from <1% of pixels, then it is considered to be noise-dominated and hence unusable.
| Quadrant | # 1 sec bins | Bins with >0 counts | Bins with >2000 counts | High rate bins dominated by noise | Noise dominated (total time) | Noise dominated (detector-on time) | Marked lightcurve |
|---|---|---|---|---|---|---|---|
| A | 7125 | 5333 | 61 | 61 | 0.86% | 1.14% | 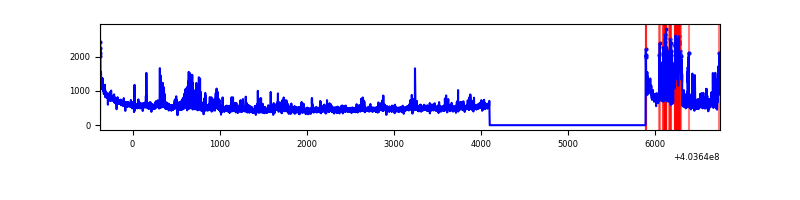 |
| B | 7125 | 5333 | 68 | 68 | 0.95% | 1.28% | 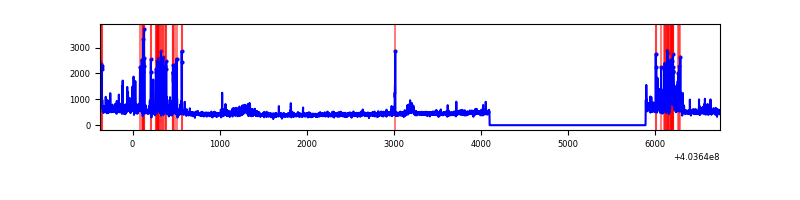 |
| C | 7125 | 5333 | 30 | 30 | 0.42% | 0.56% | 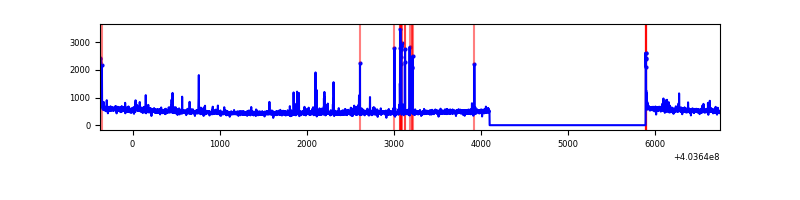 |
| D | 7124 | 5332 | 223 | 223 | 3.13% | 4.18% | 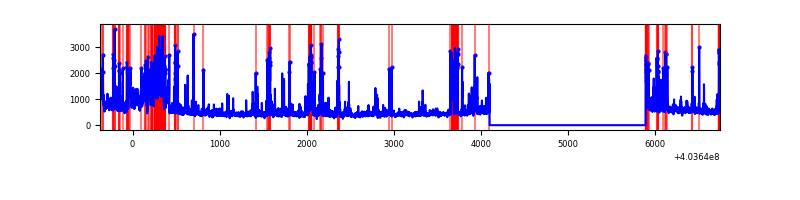 |
Top three noisy pixels from each quadrant. If the there are fewer than three noisy pixels in the level2.evt file, extra rows are filled as -1
| Pixel properties | Quadrant properties | ||||||
|---|---|---|---|---|---|---|---|
| Quadrant | DetID | PixID | Counts | Sigma | Mean | Median | Sigma |
| A | 12 | 16 | 474589 | 3928.34 | 599 | 589 | 120.7 |
| A | 10 | 83 | 377506 | 3123.75 | 599 | 589 | 120.7 |
| A | 12 | 194 | 75885 | 624.03 | 599 | 589 | 120.7 |
| B | 4 | 81 | 242249 | 2137.16 | 600 | 585 | 113.1 |
| B | 5 | 172 | 105297 | 926.02 | 600 | 585 | 113.1 |
| B | 0 | 229 | 97807 | 859.79 | 600 | 585 | 113.1 |
| C | 15 | 214 | 221494 | 1600.93 | 595 | 599 | 138.0 |
| C | 1 | 23 | 126042 | 909.14 | 595 | 599 | 138.0 |
| C | 0 | 10 | 33557 | 238.86 | 595 | 599 | 138.0 |
| D | 10 | 40 | 599759 | 4263.21 | 583 | 567 | 140.5 |
| D | 13 | 249 | 189382 | 1343.41 | 583 | 567 | 140.5 |
| D | 12 | 227 | 104802 | 741.63 | 583 | 567 | 140.5 |
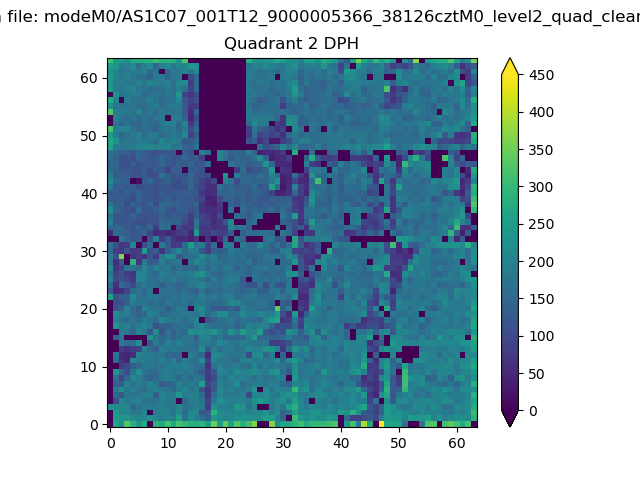
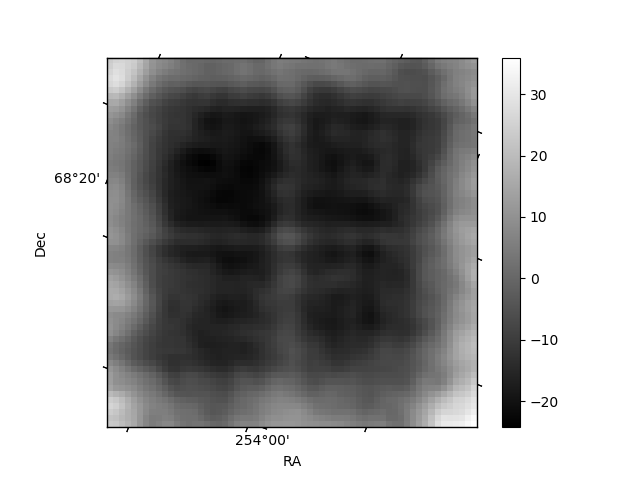
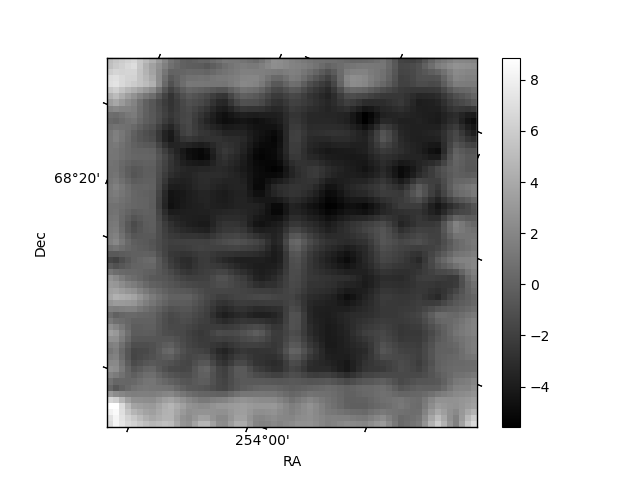
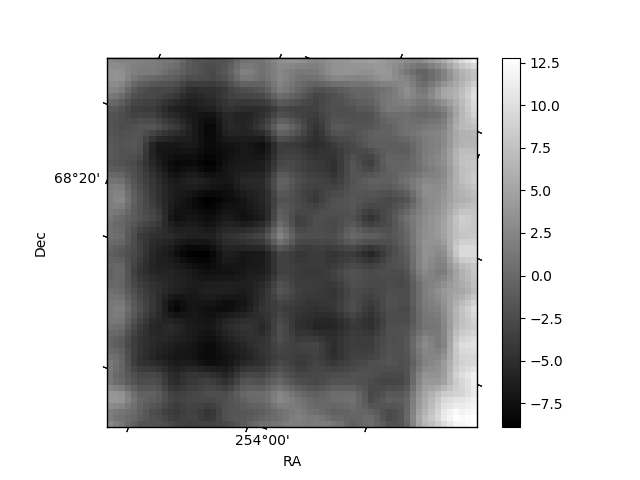
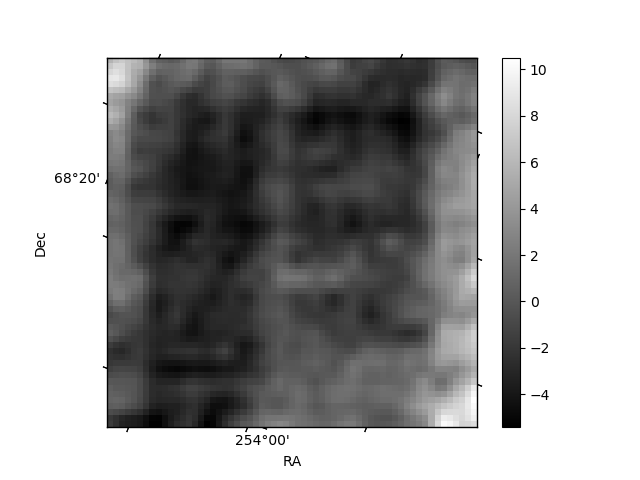
Histogram calculated using DETX and DETY for each event in the final _common_clean file
| Quadrant A | 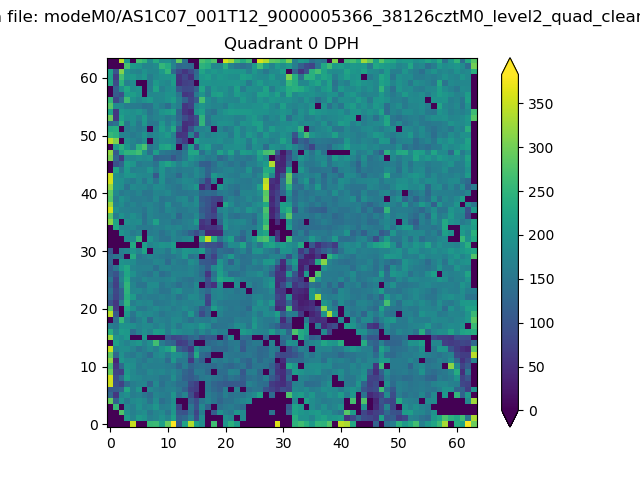 |
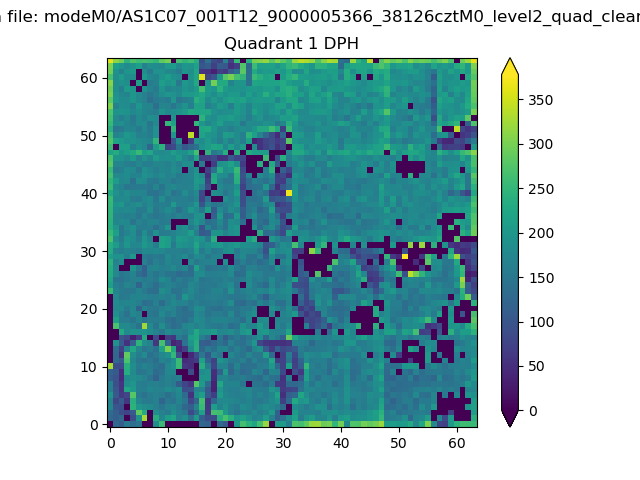 |
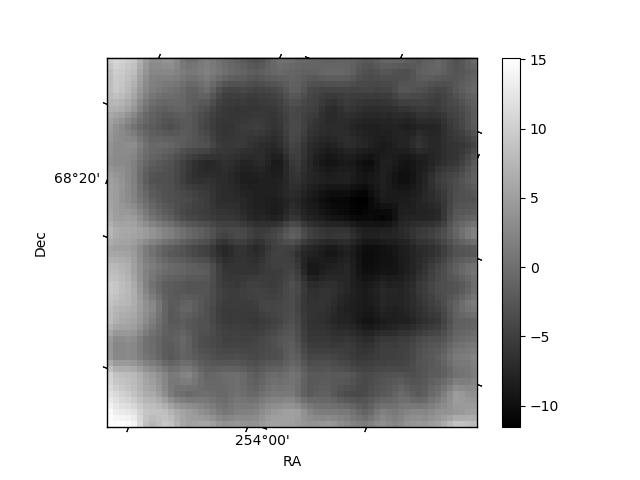
Quadrant B |
|---|---|---|---|
| Quadrant D | 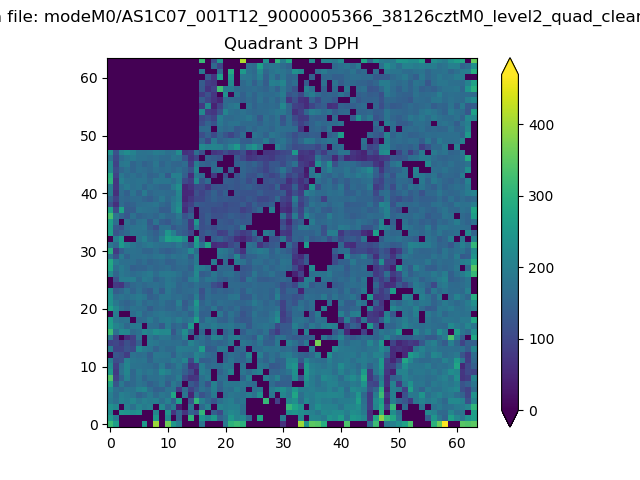 |
 |
Quadrant C |
| Plot type | Count rate plots | Images |
|---|---|---|
| Comparison with Poisson distribution Blue bars denote a histogram of data divided into 1 sec bins. Red curve is a Poisson curve with rate = median count rate of data. |
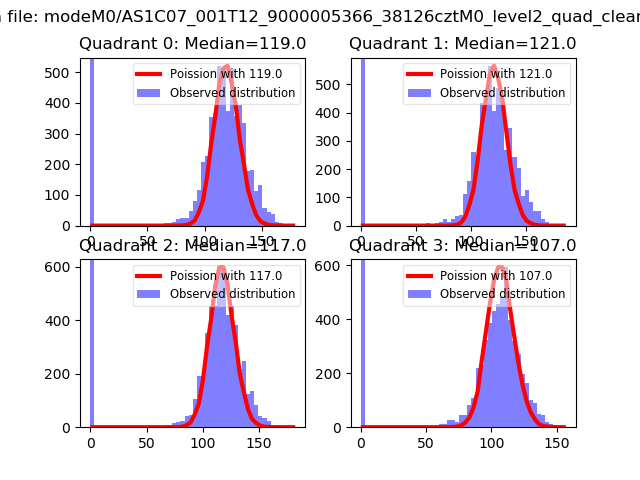 |
 |
| Quadrant-wise count rates Data is divided into 100 sec bins |
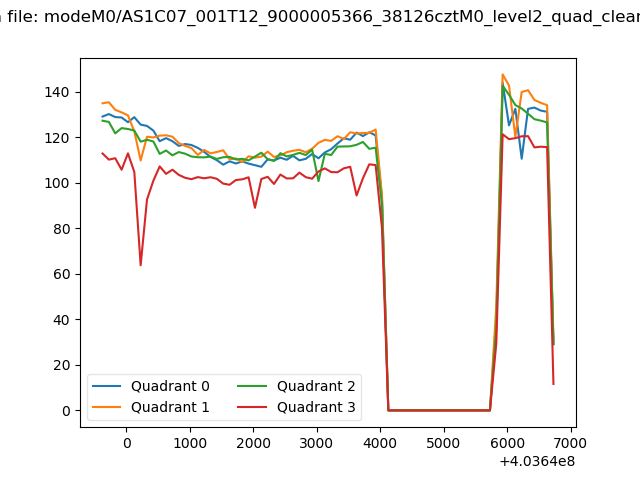 |
|
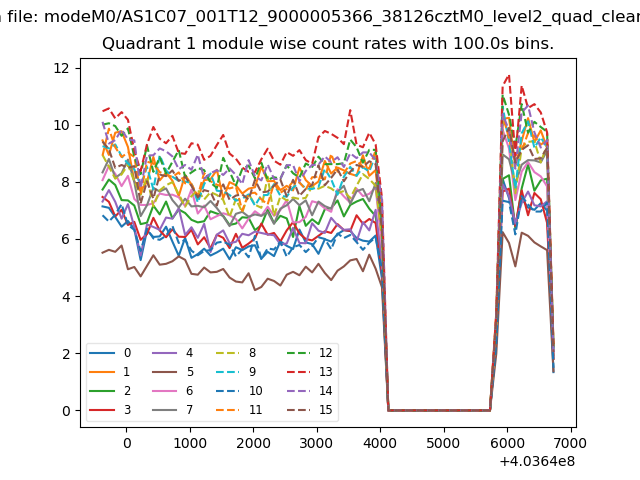
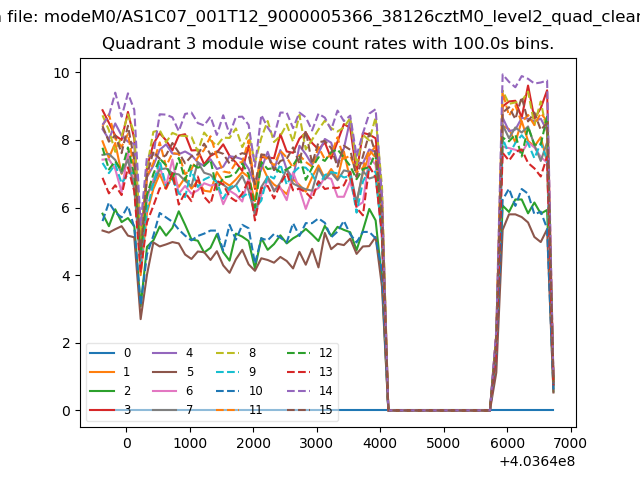
| Module-wise count rates for Quadrant A Data is divided into 100 sec bins |
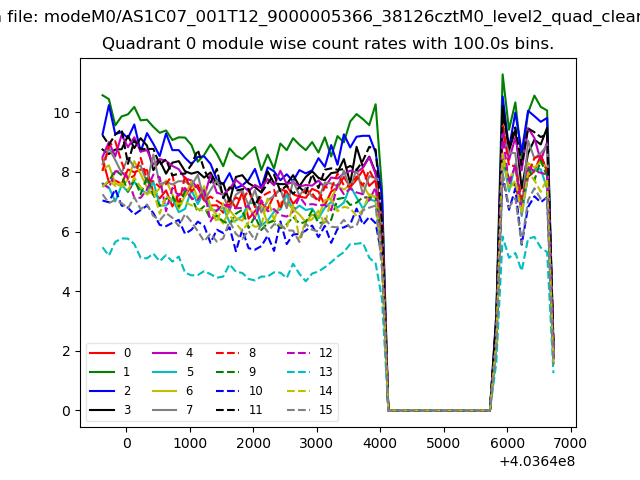 |
 |
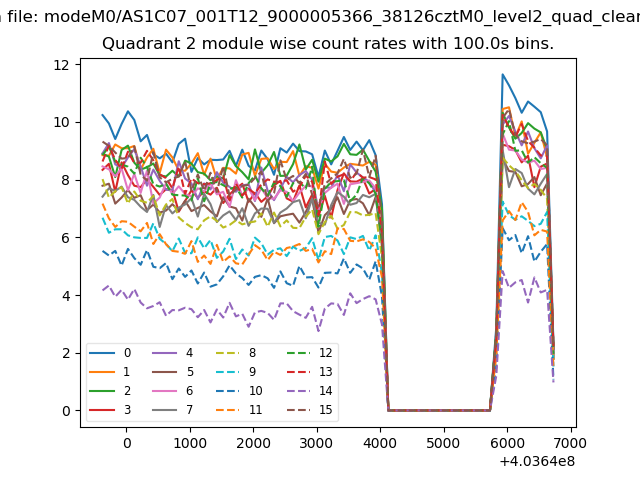
| Module-wise count rates for Quadrant B Data is divided into 100 sec bins |
 |
 |
| Module-wise count rates for Quadrant C Data is divided into 100 sec bins |
 |
 |
| Module-wise count rates for Quadrant D Data is divided into 100 sec bins |
 |
 |
| Parameter | Plot |
|---|---|
| CZT HV Monitor | 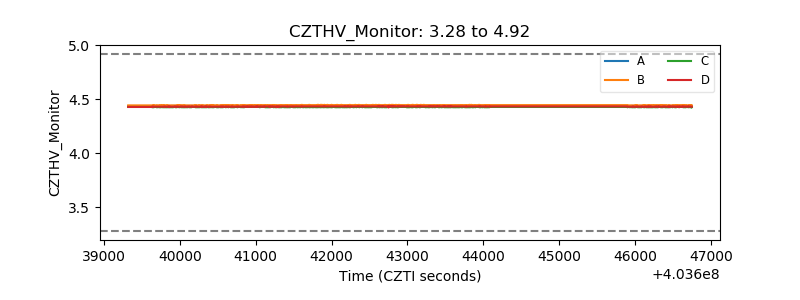 |
| D_VDD | 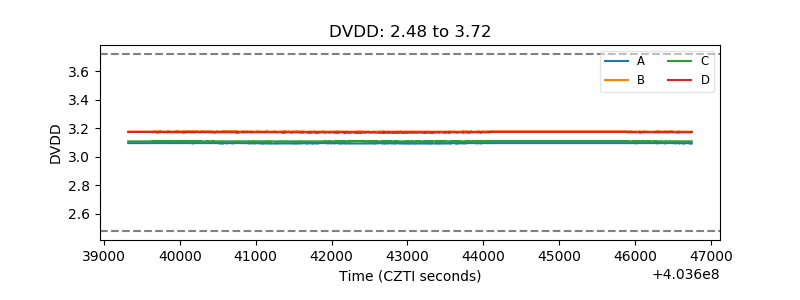 |
| Temperature 1 | 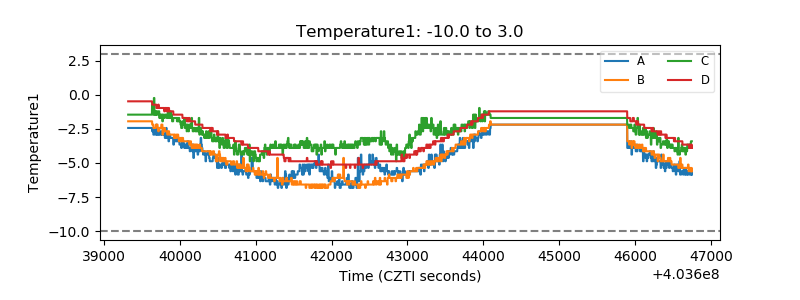 |
| Veto HV Monitor | 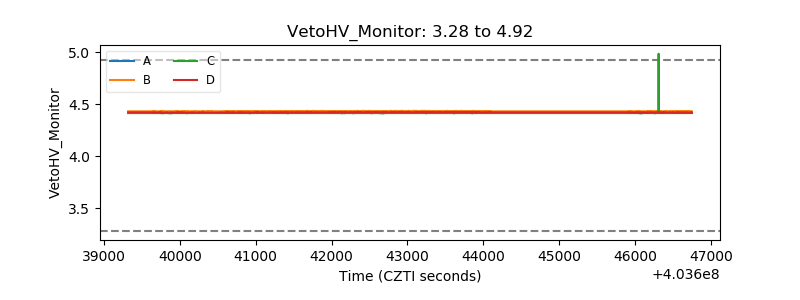 |
| Veto LLD | 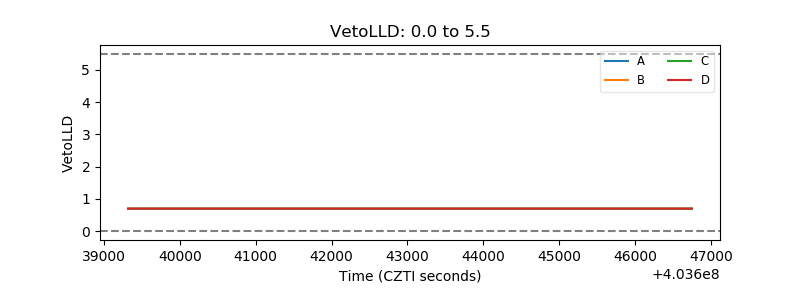 |
| Alpha Counter | 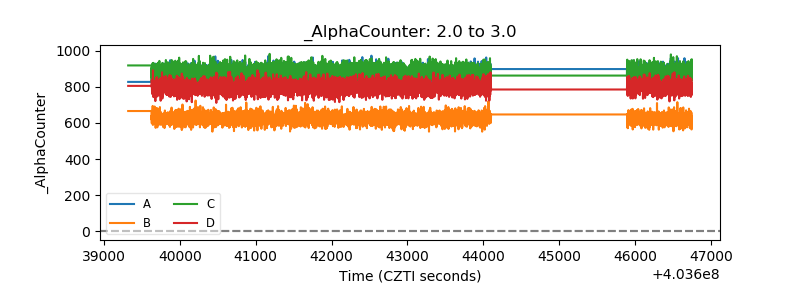 |
| _CPM_Rate | 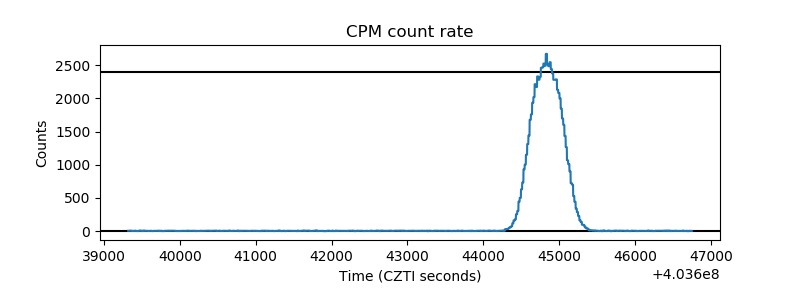 |
| CZT Counter | 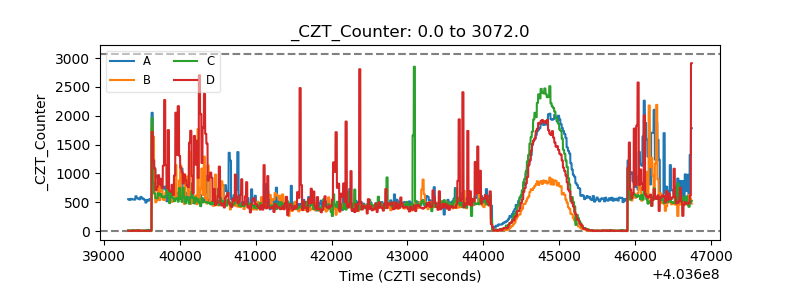 |
| +2.5 Volts monitor | 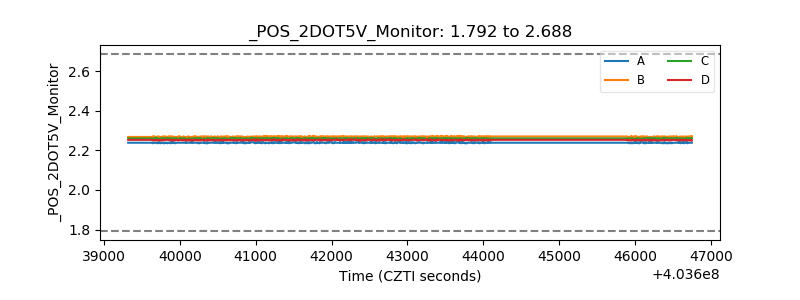 |
| +5 Volts monitor | 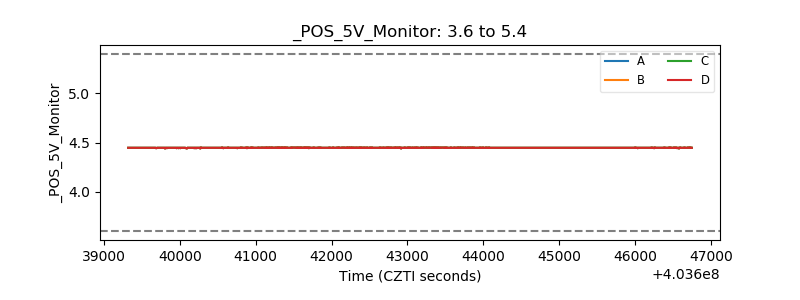 |
| _ROLL_ROT | 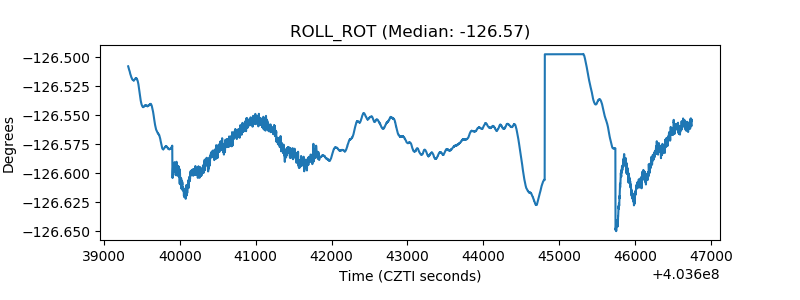 |
| _Roll_DEC | 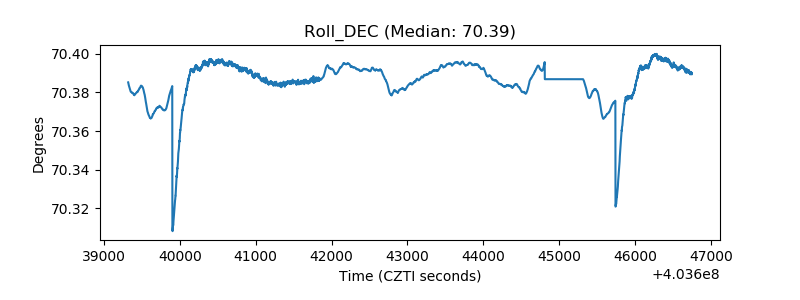 |
| _Roll_RA | 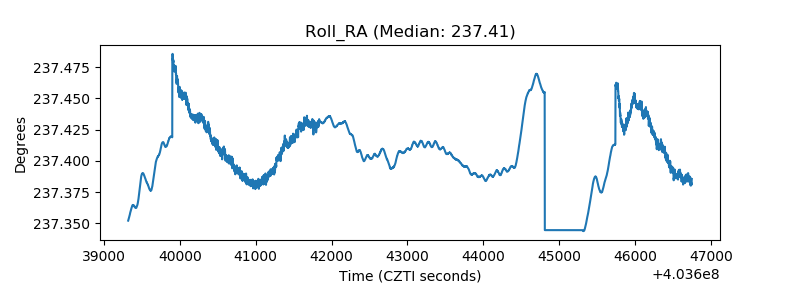 |
| Veto Counter | 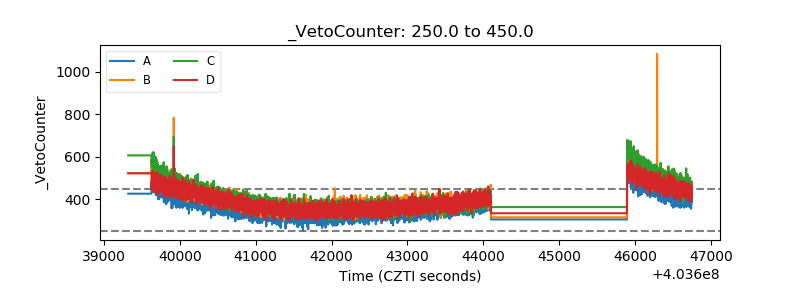 |