| Param | Original file | Final file |
|---|---|---|
| Filename | modeM0/AS1C07_001T12_9000005366_38127cztM0_level2.fits | modeM0/AS1C07_001T12_9000005366_38127cztM0_level2_quad_clean.evt |
| Size (bytes) | 348,782,400 | 93,003,840 |
| Size | 332.6 MB | 88.7 MB |
| Events in quadrant A | 3,417,542 | 628,400 |
| Events in quadrant B | 2,679,521 | 650,861 |
| Events in quadrant C | 2,808,044 | 629,821 |
| Events in quadrant D | 3,608,232 | 549,552 |
| Mode M0 | |||
|---|---|---|---|
| Quadrant | BADHDUFLAG | Total packets | Discarded packets |
| A | 0 | 13455 | 3 |
| B | 0 | 11336 | 2 |
| C | 0 | 11583 | 2 |
| D | 0 | 14192 | 2 |
| Mode M9 | |||
|---|---|---|---|
| Quadrant | BADHDUFLAG | Total packets | Discarded packets |
| A | 0 | 24 | 0 |
| B | 0 | 24 | 0 |
| C | 0 | 24 | 0 |
| D | 0 | 25 | 0 |
| Mode SS | |||
|---|---|---|---|
| Quadrant | BADHDUFLAG | Total packets | Discarded packets |
| A | 0 | 104 | 0 |
| B | 0 | 104 | 0 |
| C | 0 | 104 | 0 |
| D | 0 | 104 | 0 |
| Quadrant | Total seconds | Saturated seconds | Saturation percentage |
|---|---|---|---|
| A | 5106 | 74 | 1.449275% |
| B | 5106 | 60 | 1.175088% |
| C | 5106 | 28 | 0.548374% |
| D | 5106 | 292 | 5.718762% |
Noise dominated data is calculated using 1-second bins in cleaned event files. If a bin has >2000 counts, and if more than 50% of those come from <1% of pixels, then it is considered to be noise-dominated and hence unusable.
| Quadrant | # 1 sec bins | Bins with >0 counts | Bins with >2000 counts | High rate bins dominated by noise | Noise dominated (total time) | Noise dominated (detector-on time) | Marked lightcurve |
|---|---|---|---|---|---|---|---|
| A | 7020 | 5107 | 61 | 61 | 0.87% | 1.19% | 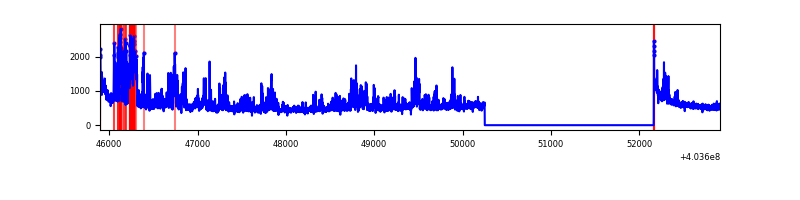 |
| B | 7020 | 5107 | 46 | 46 | 0.66% | 0.90% | 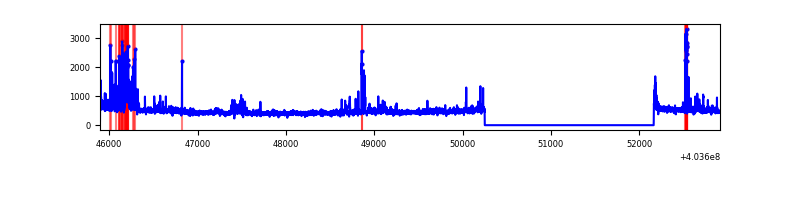 |
| C | 7020 | 5107 | 22 | 22 | 0.31% | 0.43% | 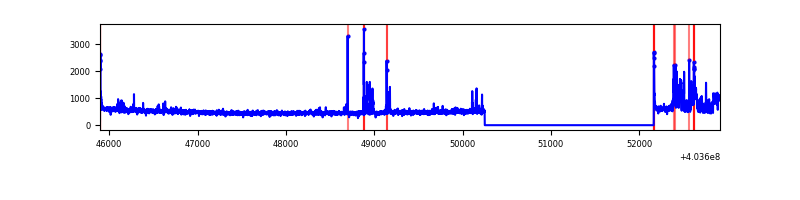 |
| D | 7020 | 5107 | 294 | 294 | 4.19% | 5.76% | 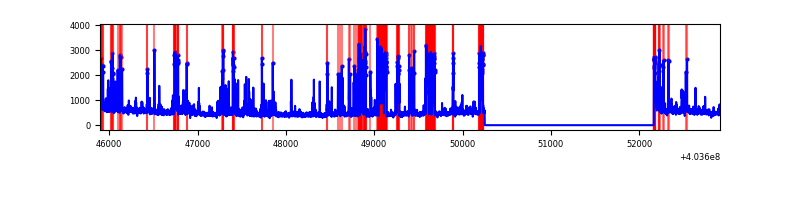 |
Top three noisy pixels from each quadrant. If the there are fewer than three noisy pixels in the level2.evt file, extra rows are filled as -1
| Pixel properties | Quadrant properties | ||||||
|---|---|---|---|---|---|---|---|
| Quadrant | DetID | PixID | Counts | Sigma | Mean | Median | Sigma |
| A | 12 | 16 | 643821 | 5444.1 | 584 | 574 | 118.2 |
| A | 10 | 83 | 352111 | 2975.22 | 584 | 574 | 118.2 |
| A | 12 | 194 | 96456 | 811.49 | 584 | 574 | 118.2 |
| B | 4 | 81 | 149075 | 1355.54 | 587 | 571 | 109.6 |
| B | 5 | 172 | 92915 | 842.91 | 587 | 571 | 109.6 |
| B | 0 | 229 | 74046 | 670.68 | 587 | 571 | 109.6 |
| C | 15 | 214 | 214119 | 1590.83 | 581 | 588 | 134.2 |
| C | 0 | 239 | 200852 | 1491.99 | 581 | 588 | 134.2 |
| C | 1 | 23 | 73255 | 541.38 | 581 | 588 | 134.2 |
| D | 12 | 227 | 830107 | 6144.16 | 562 | 546 | 135.0 |
| D | 12 | 233 | 83365 | 613.4 | 562 | 546 | 135.0 |
| D | 13 | 249 | 78571 | 577.89 | 562 | 546 | 135.0 |
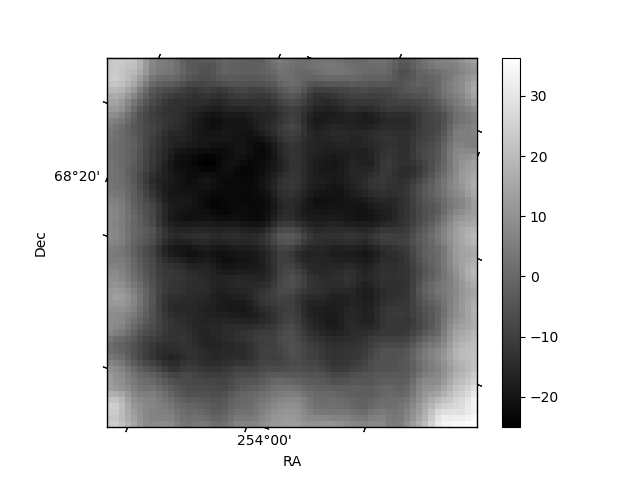
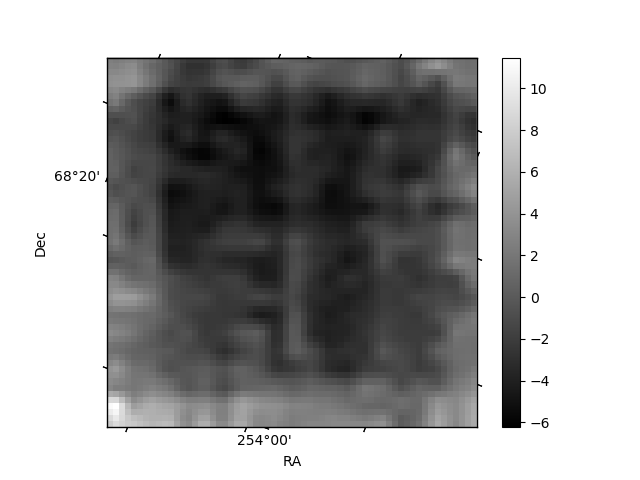
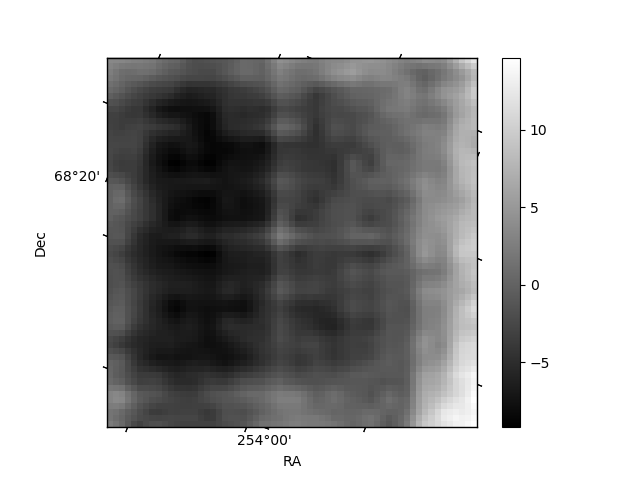
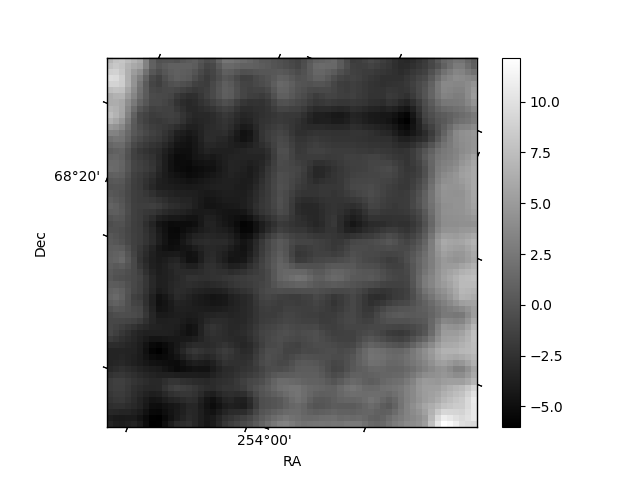
Histogram calculated using DETX and DETY for each event in the final _common_clean file
| Quadrant A | 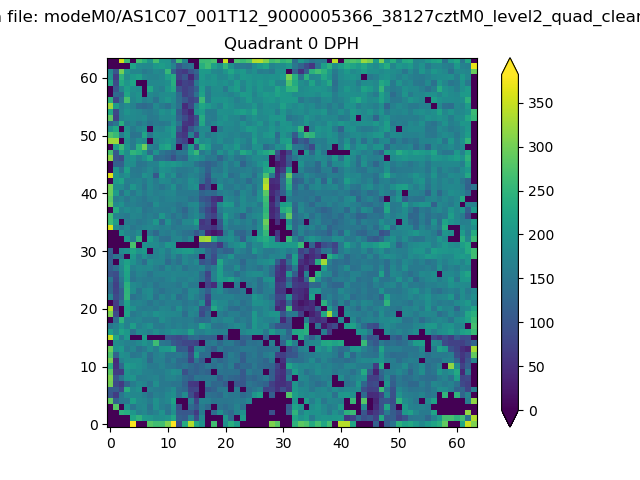 |
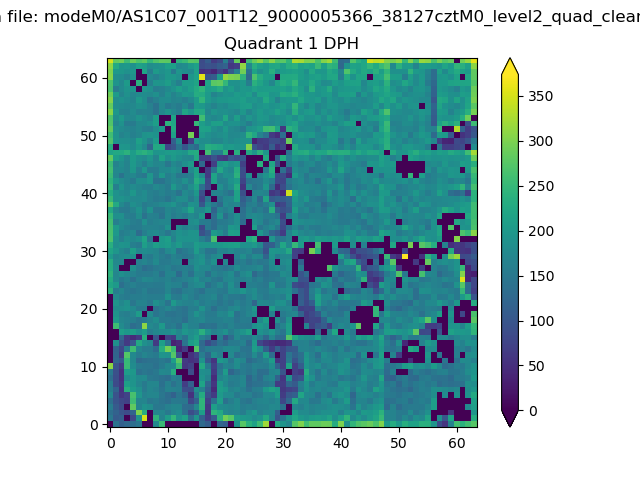 |
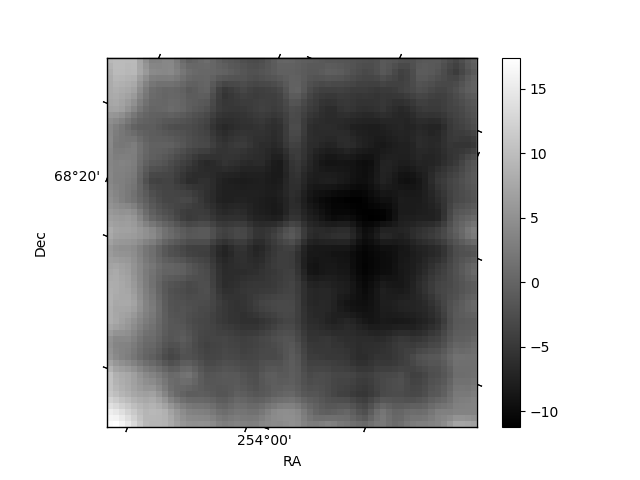
Quadrant B |
|---|---|---|---|
| Quadrant D | 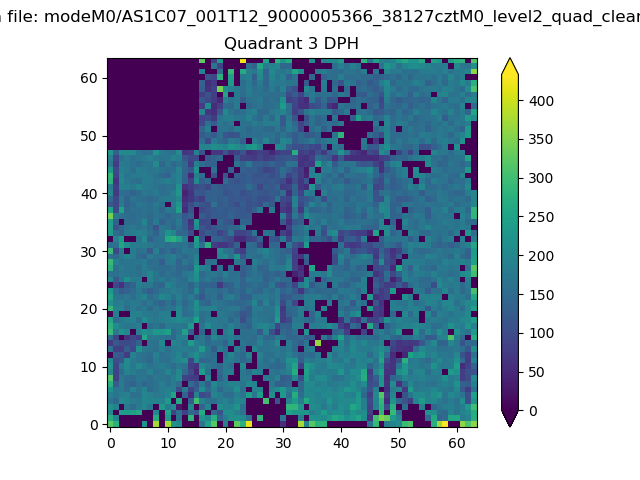 |
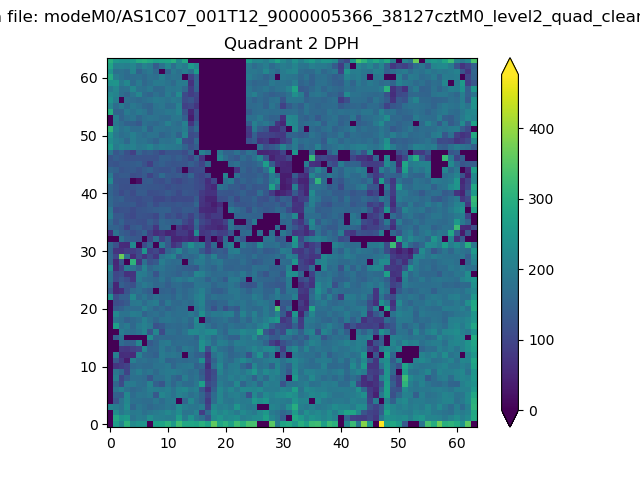 |
Quadrant C |
| Plot type | Count rate plots | Images |
|---|---|---|
| Comparison with Poisson distribution Blue bars denote a histogram of data divided into 1 sec bins. Red curve is a Poisson curve with rate = median count rate of data. |
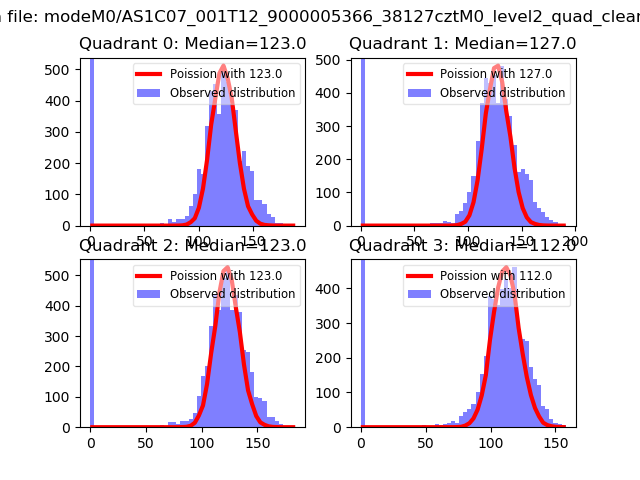 |
 |
| Quadrant-wise count rates Data is divided into 100 sec bins |
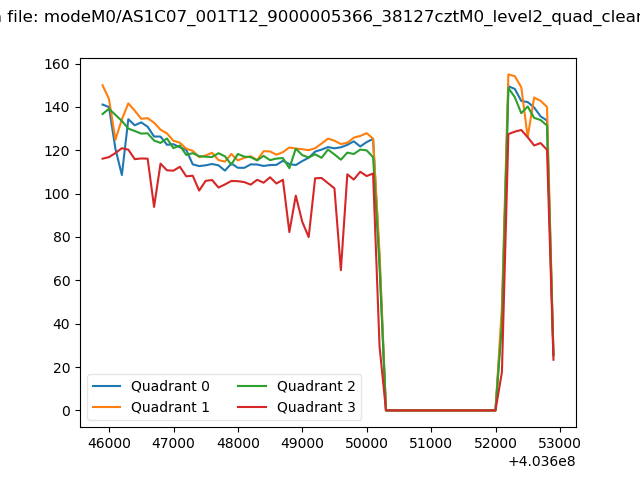 |
|
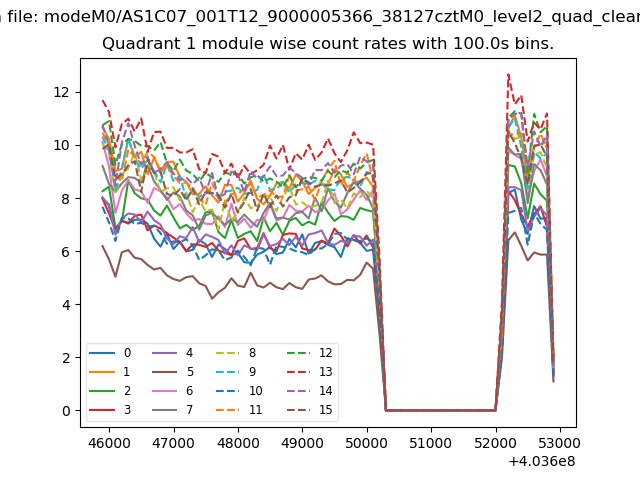
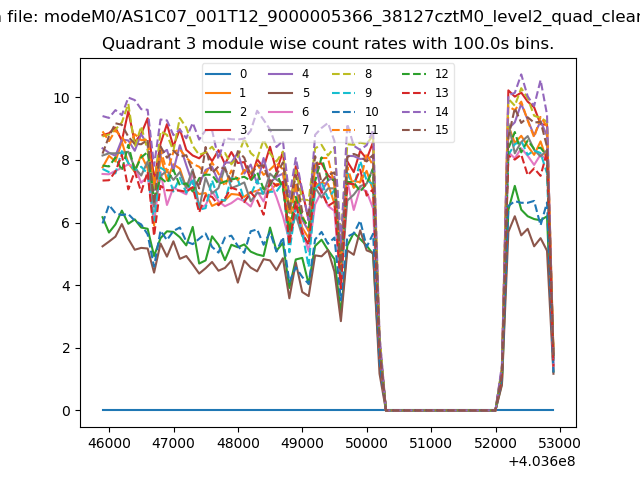
| Module-wise count rates for Quadrant A Data is divided into 100 sec bins |
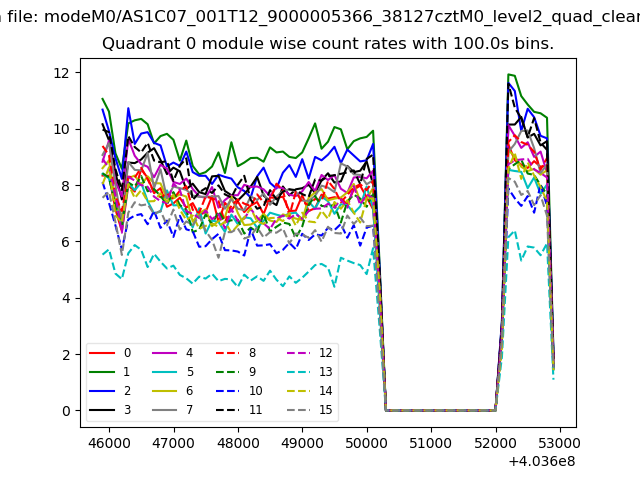 |
 |
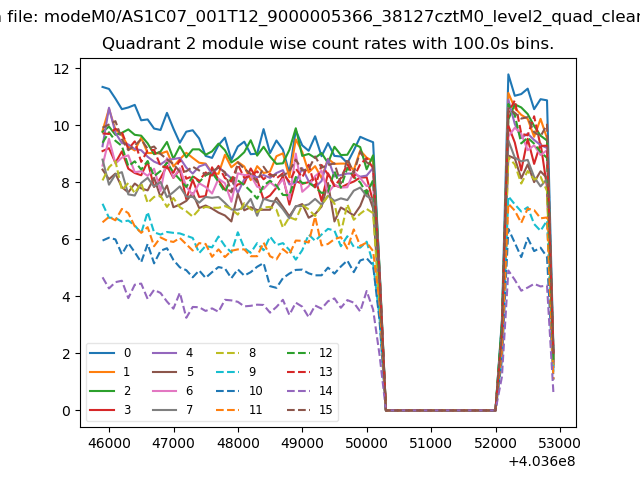
| Module-wise count rates for Quadrant B Data is divided into 100 sec bins |
 |
 |
| Module-wise count rates for Quadrant C Data is divided into 100 sec bins |
 |
 |
| Module-wise count rates for Quadrant D Data is divided into 100 sec bins |
 |
 |
| Parameter | Plot |
|---|---|
| CZT HV Monitor | 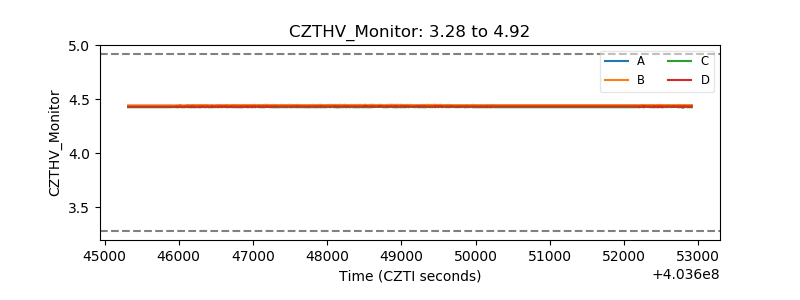 |
| D_VDD | 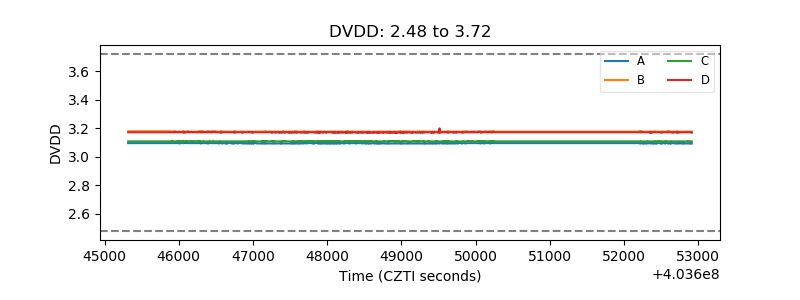 |
| Temperature 1 | 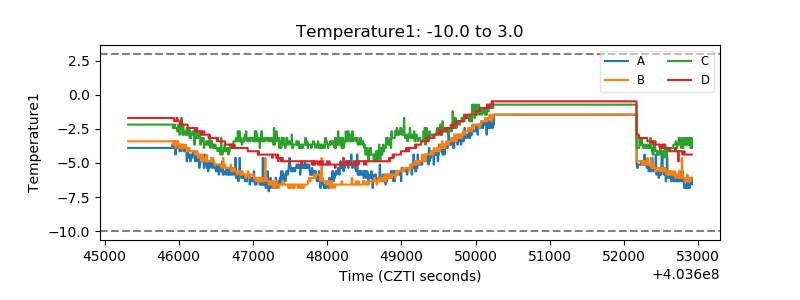 |
| Veto HV Monitor | 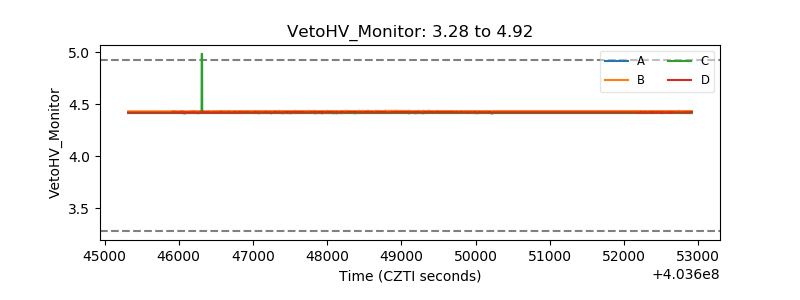 |
| Veto LLD | 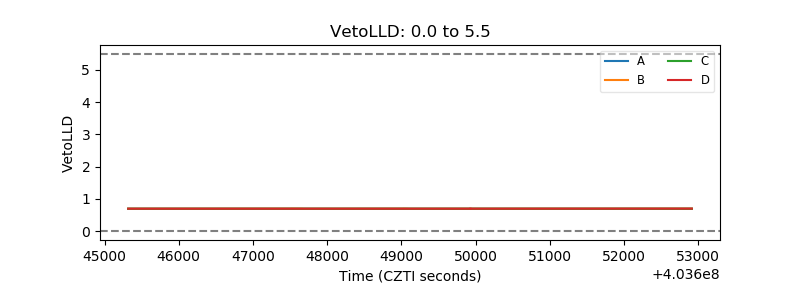 |
| Alpha Counter | 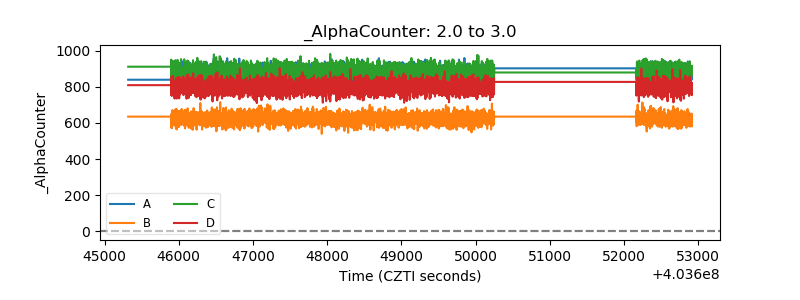 |
| _CPM_Rate | 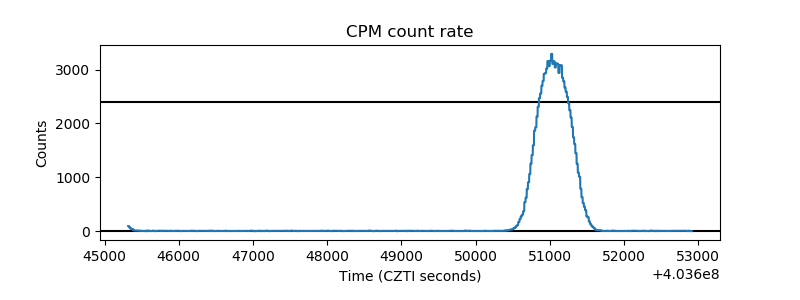 |
| CZT Counter | 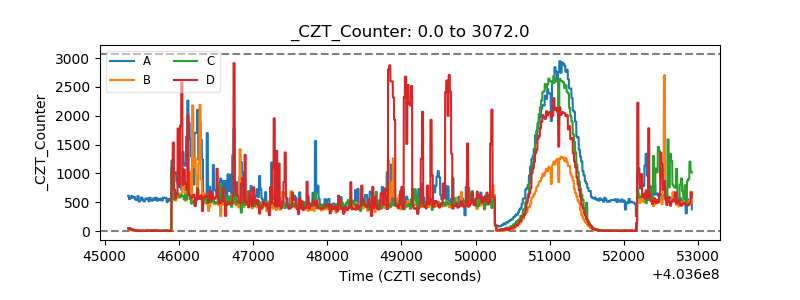 |
| +2.5 Volts monitor | 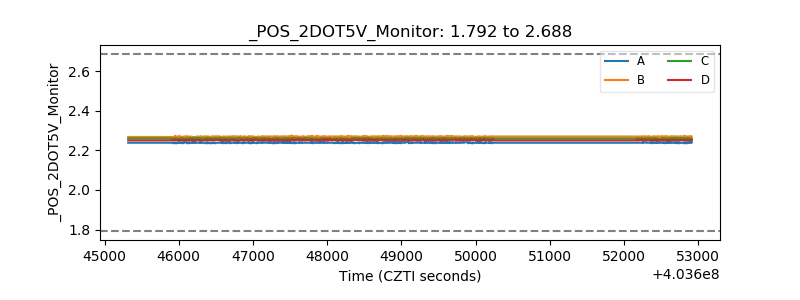 |
| +5 Volts monitor | 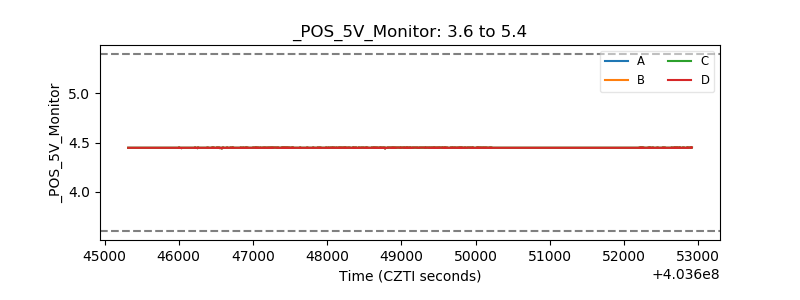 |
| _ROLL_ROT | 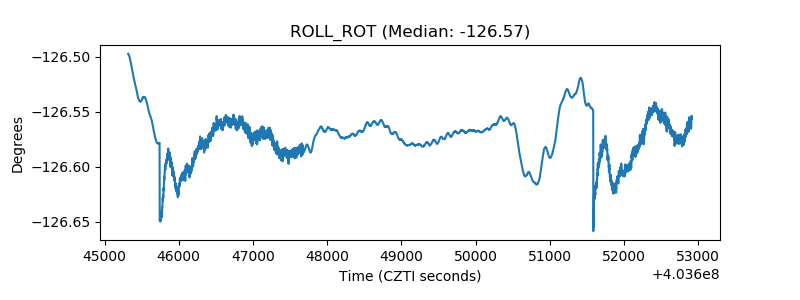 |
| _Roll_DEC | 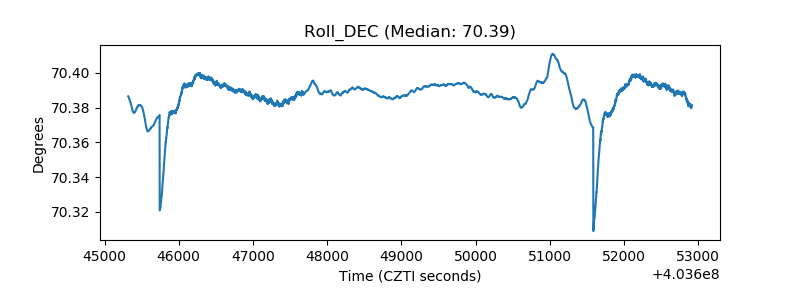 |
| _Roll_RA | 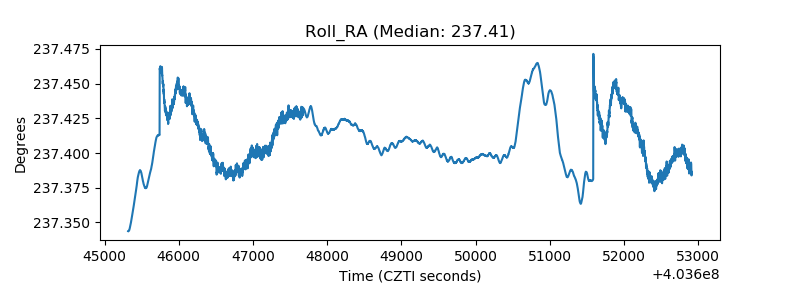 |
| Veto Counter | 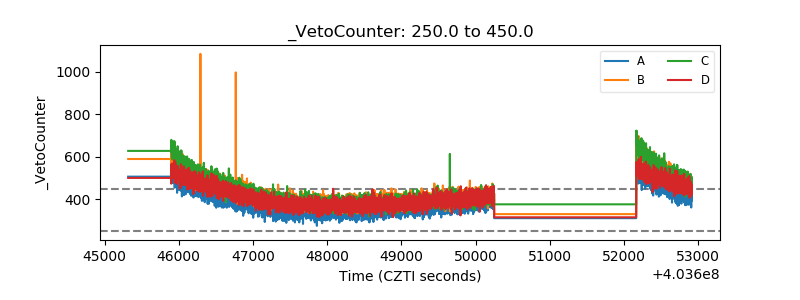 |