| Param | Original file | Final file |
|---|---|---|
| Filename | modeM0/AS1C07_001T12_9000005366_38128cztM0_level2.fits | modeM0/AS1C07_001T12_9000005366_38128cztM0_level2_quad_clean.evt |
| Size (bytes) | 338,639,040 | 100,728,000 |
| Size | 323.0 MB | 96.1 MB |
| Events in quadrant A | 3,467,865 | 679,990 |
| Events in quadrant B | 2,645,453 | 705,682 |
| Events in quadrant C | 2,989,449 | 679,469 |
| Events in quadrant D | 3,015,233 | 610,453 |
| Mode M0 | |||
|---|---|---|---|
| Quadrant | BADHDUFLAG | Total packets | Discarded packets |
| A | 0 | 13740 | 3 |
| B | 0 | 11277 | 2 |
| C | 0 | 12182 | 2 |
| D | 0 | 12573 | 2 |
| Mode M9 | |||
|---|---|---|---|
| Quadrant | BADHDUFLAG | Total packets | Discarded packets |
| A | 0 | 38 | 0 |
| B | 0 | 38 | 0 |
| C | 0 | 38 | 0 |
| D | 0 | 39 | 0 |
| Mode SS | |||
|---|---|---|---|
| Quadrant | BADHDUFLAG | Total packets | Discarded packets |
| A | 0 | 108 | 0 |
| B | 0 | 108 | 0 |
| C | 0 | 108 | 0 |
| D | 0 | 108 | 0 |
| Quadrant | Total seconds | Saturated seconds | Saturation percentage |
|---|---|---|---|
| A | 5359 | 40 | 0.746408% |
| B | 5359 | 35 | 0.653107% |
| C | 5359 | 23 | 0.429185% |
| D | 5359 | 88 | 1.642097% |
Noise dominated data is calculated using 1-second bins in cleaned event files. If a bin has >2000 counts, and if more than 50% of those come from <1% of pixels, then it is considered to be noise-dominated and hence unusable.
| Quadrant | # 1 sec bins | Bins with >0 counts | Bins with >2000 counts | High rate bins dominated by noise | Noise dominated (total time) | Noise dominated (detector-on time) | Marked lightcurve |
|---|---|---|---|---|---|---|---|
| A | 7393 | 5360 | 28 | 28 | 0.38% | 0.52% | 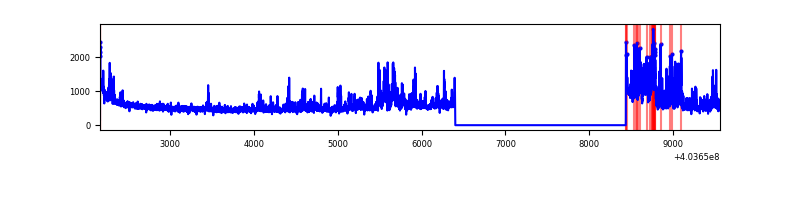 |
| B | 7393 | 5360 | 31 | 31 | 0.42% | 0.58% | 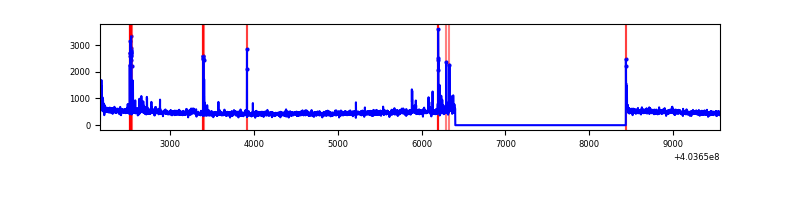 |
| C | 7393 | 5360 | 17 | 17 | 0.23% | 0.32% | 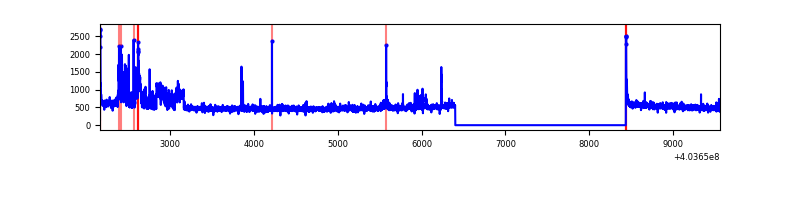 |
| D | 7392 | 5359 | 82 | 82 | 1.11% | 1.53% | 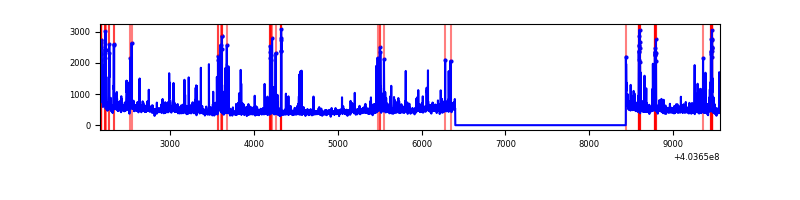 |
Top three noisy pixels from each quadrant. If the there are fewer than three noisy pixels in the level2.evt file, extra rows are filled as -1
| Pixel properties | Quadrant properties | ||||||
|---|---|---|---|---|---|---|---|
| Quadrant | DetID | PixID | Counts | Sigma | Mean | Median | Sigma |
| A | 12 | 16 | 575506 | 4643.85 | 619 | 608 | 123.8 |
| A | 10 | 83 | 356949 | 2878.41 | 619 | 608 | 123.8 |
| A | 12 | 194 | 86480 | 693.65 | 619 | 608 | 123.8 |
| B | 5 | 172 | 82346 | 699.82 | 626 | 610 | 116.8 |
| B | 0 | 229 | 78405 | 666.08 | 626 | 610 | 116.8 |
| B | 4 | 171 | 14623 | 119.98 | 626 | 610 | 116.8 |
| C | 0 | 239 | 267049 | 1892.11 | 615 | 619 | 140.8 |
| C | 15 | 214 | 223401 | 1582.13 | 615 | 619 | 140.8 |
| C | 0 | 10 | 31789 | 221.36 | 615 | 619 | 140.8 |
| D | 13 | 249 | 156955 | 1072.54 | 603 | 586 | 145.8 |
| D | 7 | 55 | 135071 | 922.43 | 603 | 586 | 145.8 |
| D | 12 | 227 | 91180 | 621.39 | 603 | 586 | 145.8 |
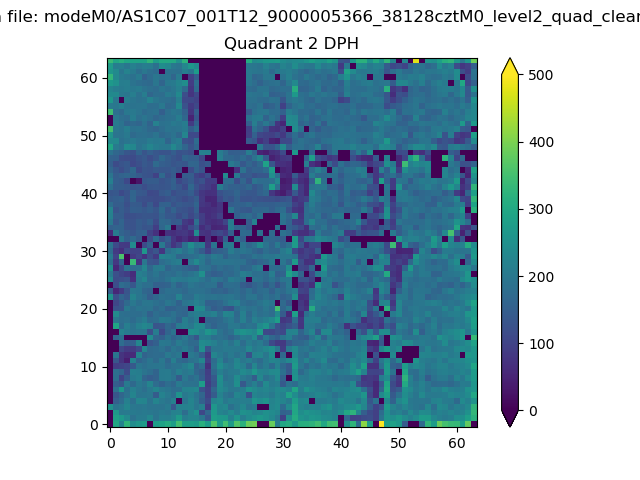
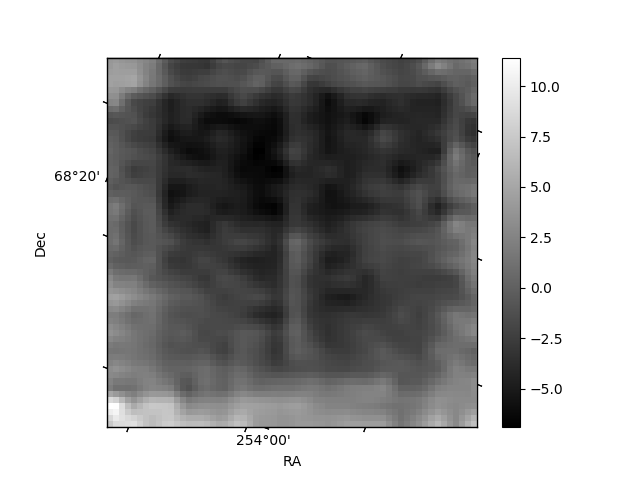
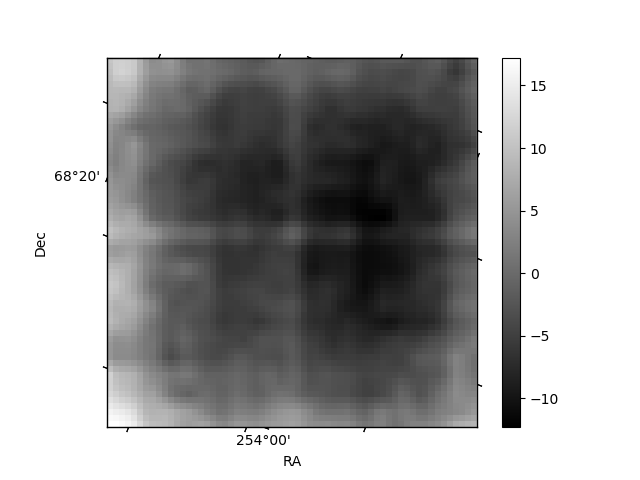
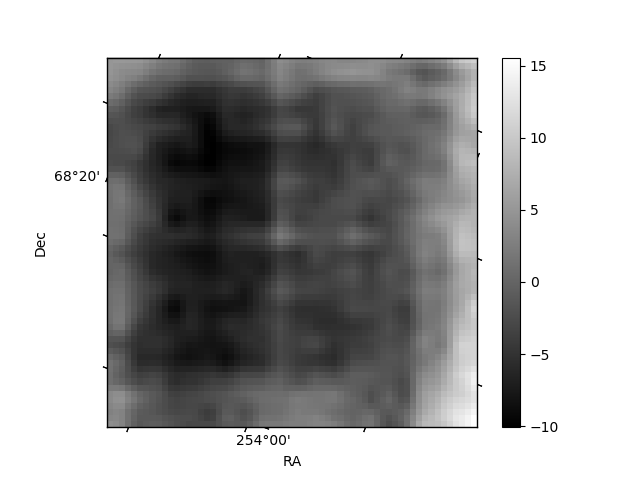
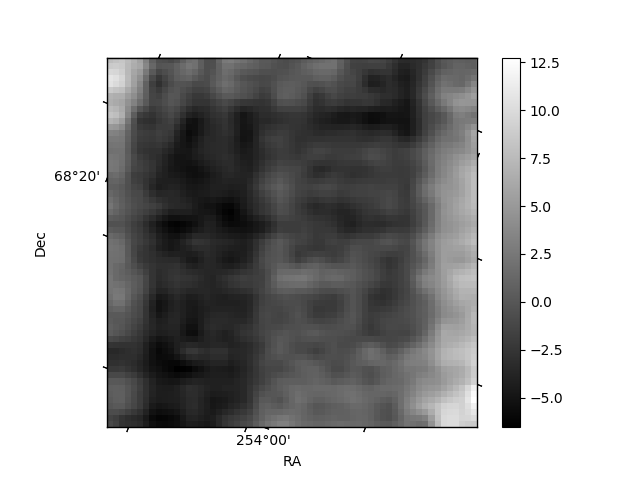
Histogram calculated using DETX and DETY for each event in the final _common_clean file
| Quadrant A | 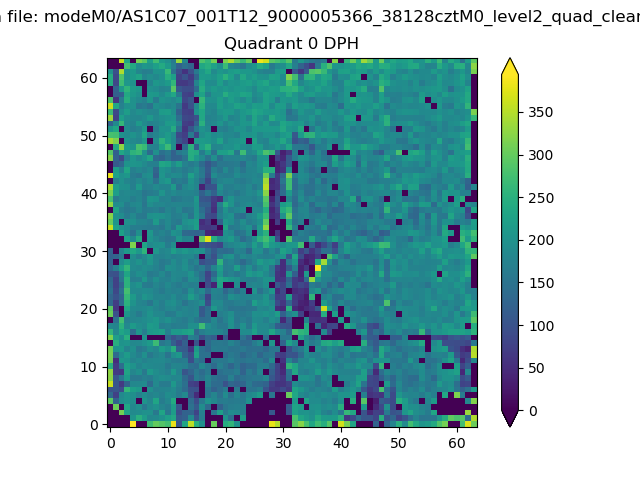 |
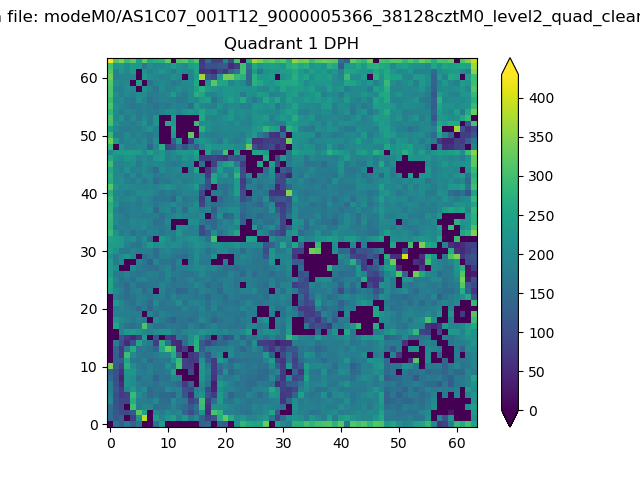 |
Quadrant B |
|---|---|---|---|
| Quadrant D | 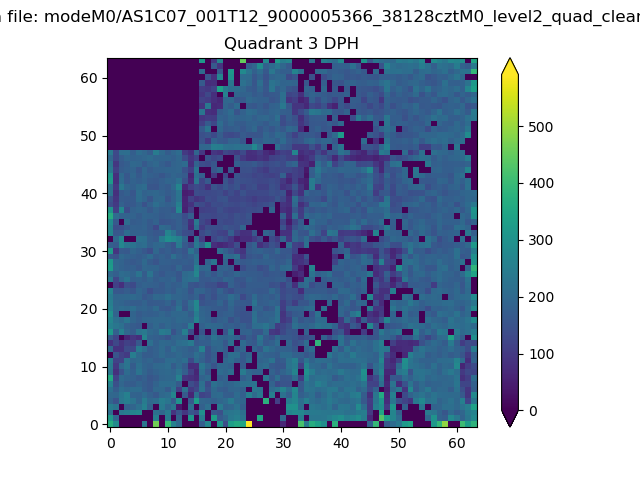 |
 |
Quadrant C |
| Plot type | Count rate plots | Images |
|---|---|---|
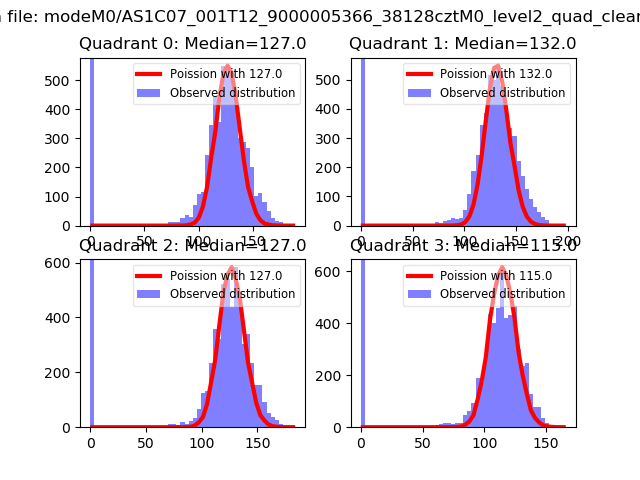
| Comparison with Poisson distribution Blue bars denote a histogram of data divided into 1 sec bins. Red curve is a Poisson curve with rate = median count rate of data. |
 |
 |
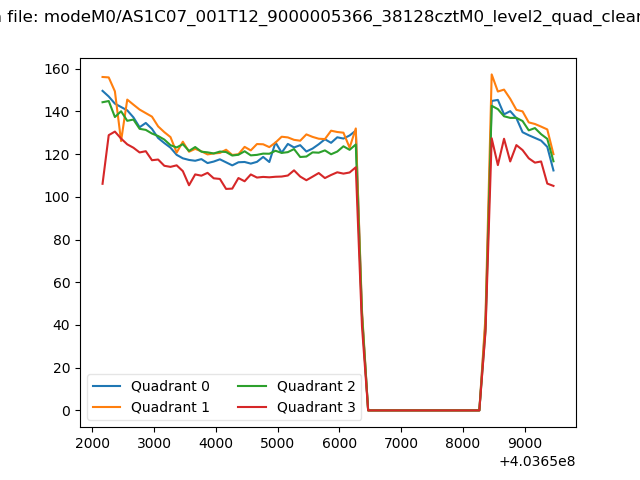
| Quadrant-wise count rates Data is divided into 100 sec bins |
 |
|
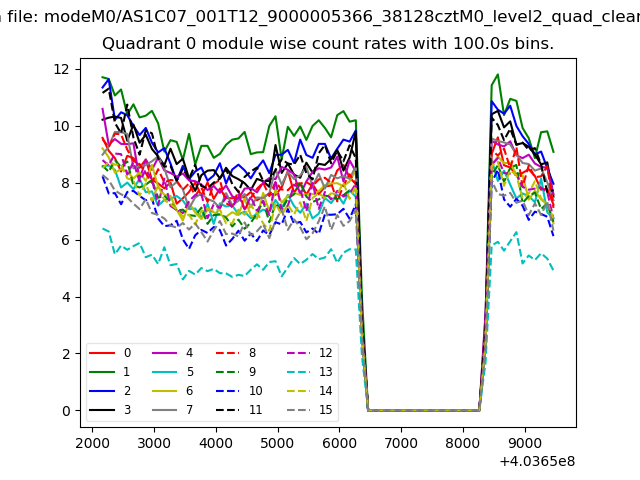
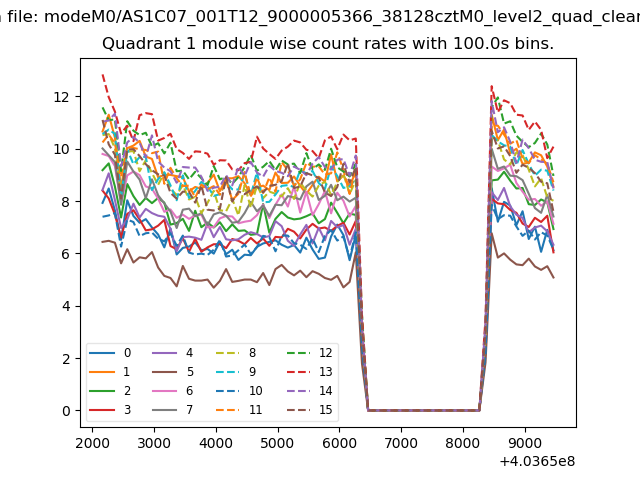
| Module-wise count rates for Quadrant A Data is divided into 100 sec bins |
 |
 |
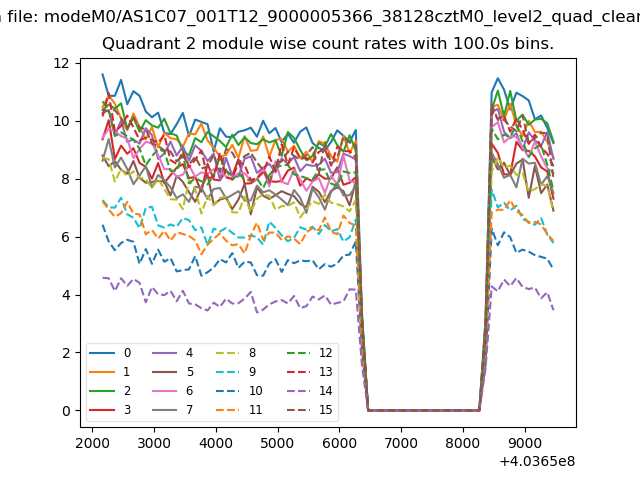
| Module-wise count rates for Quadrant B Data is divided into 100 sec bins |
 |
 |
| Module-wise count rates for Quadrant C Data is divided into 100 sec bins |
 |
 |
| Module-wise count rates for Quadrant D Data is divided into 100 sec bins |
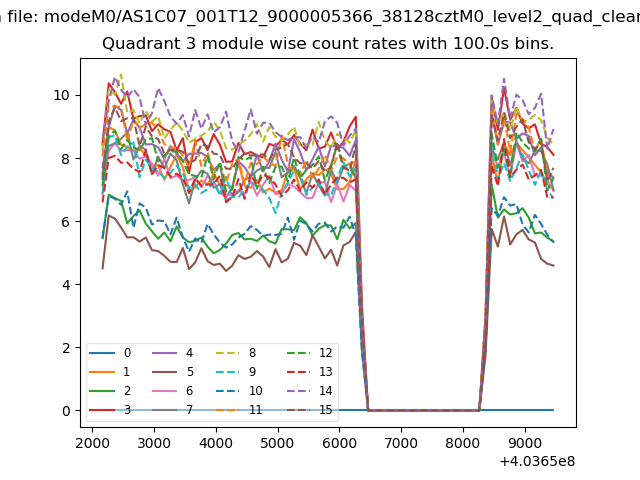 |
 |
| Parameter | Plot |
|---|---|
| CZT HV Monitor | 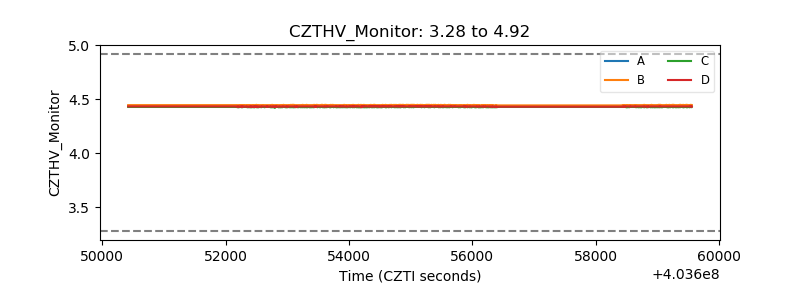 |
| D_VDD | 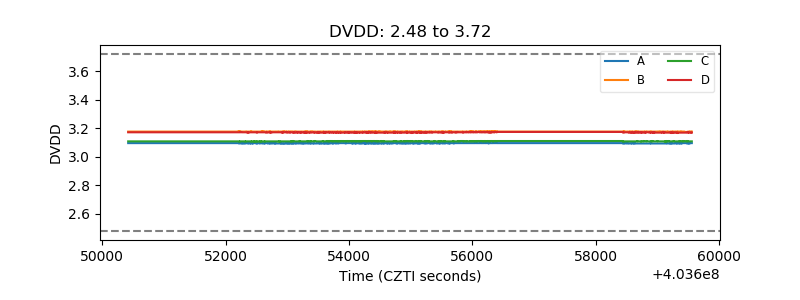 |
| Temperature 1 | 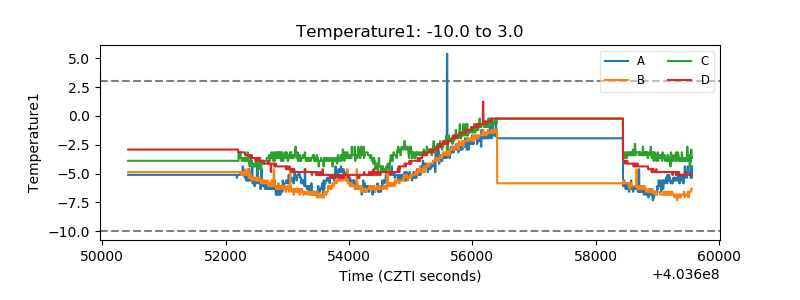 |
| Veto HV Monitor | 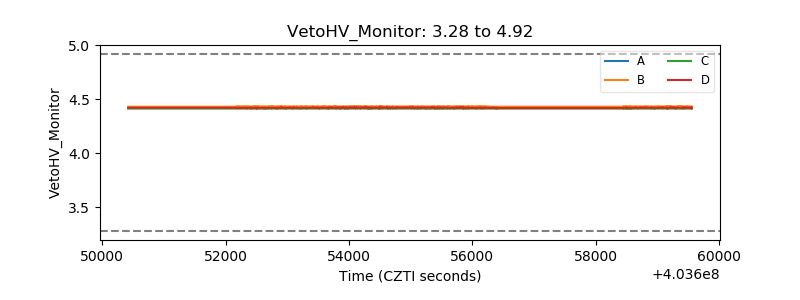 |
| Veto LLD | 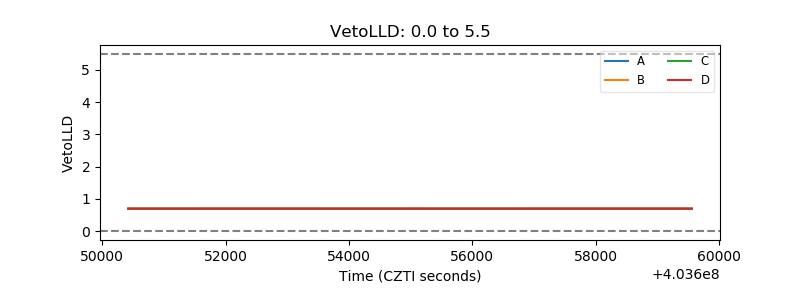 |
| Alpha Counter | 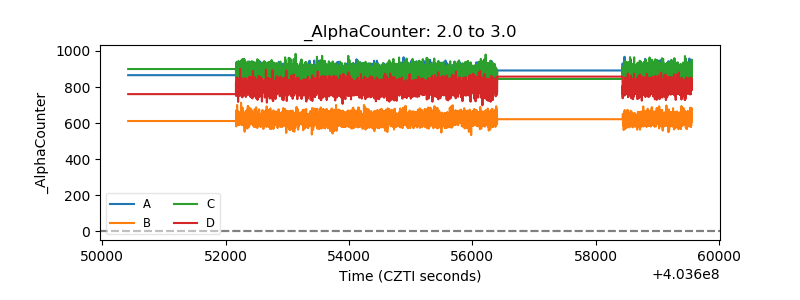 |
| _CPM_Rate | 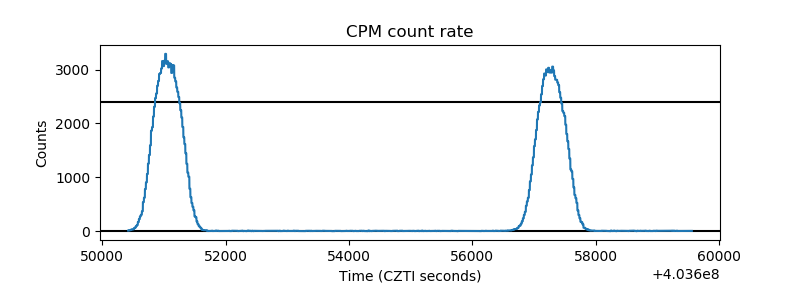 |
| CZT Counter | 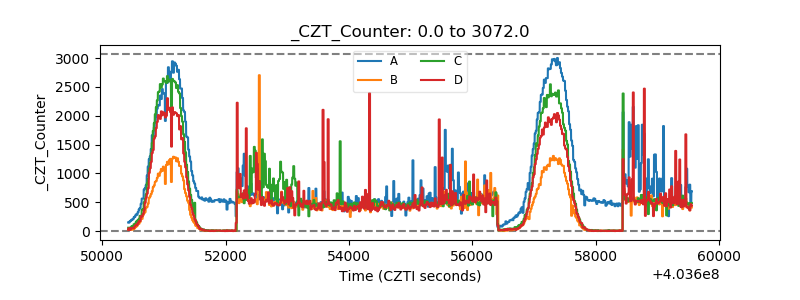 |
| +2.5 Volts monitor |  |
| +5 Volts monitor | 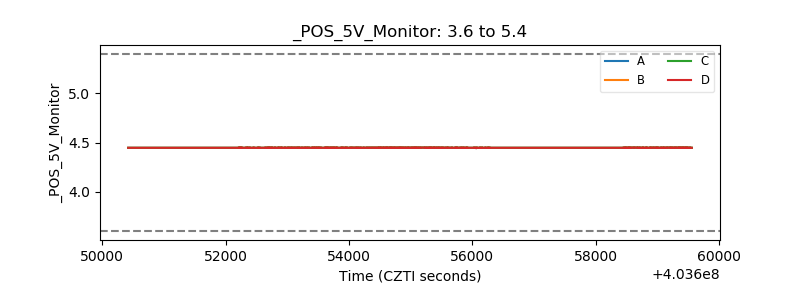 |
| _ROLL_ROT | 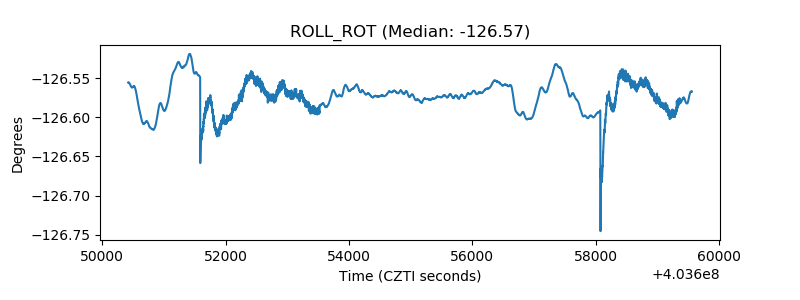 |
| _Roll_DEC | 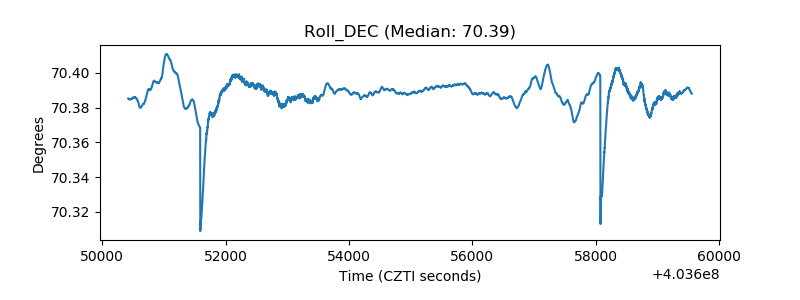 |
| _Roll_RA | 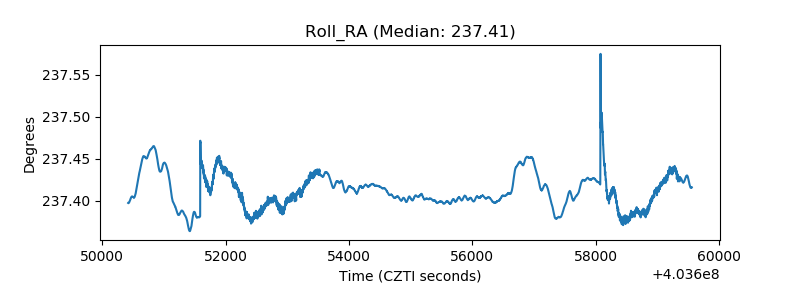 |
| Veto Counter | 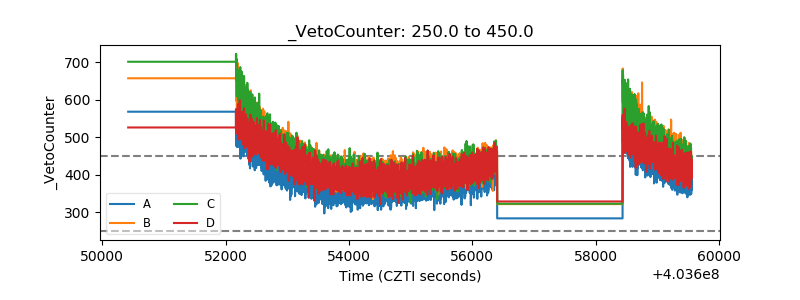 |